| Param | Original file | Final file |
|---|---|---|
| Filename | modeM0/AS1A07_091T07_9000003254_22028cztM0_level2.evt | modeM0/AS1A07_091T07_9000003254_22028cztM0_level2_quad_clean.evt |
| Size (bytes) | 474,716,160 | 103,806,720 |
| Size | 452.7 MB | 99.0 MB |
| Events in quadrant A | 3,236,017 | 692,562 |
| Events in quadrant B | 3,369,349 | 691,751 |
| Events in quadrant C | 3,256,907 | 662,184 |
| Events in quadrant D | 4,075,482 | 646,385 |
| Mode SS | |||
|---|---|---|---|
| Quadrant | BADHDUFLAG | Total packets | Discarded packets |
| A | 0 | 132 | 0 |
| B | 0 | 132 | 0 |
| C | 0 | 132 | 0 |
| D | 0 | 132 | 0 |
| Mode M9 | |||
|---|---|---|---|
| Quadrant | BADHDUFLAG | Total packets | Discarded packets |
| A | 0 | 12 | 0 |
| B | 0 | 12 | 0 |
| C | 0 | 12 | 0 |
| D | 0 | 12 | 0 |
| Mode M0 | |||
|---|---|---|---|
| Quadrant | BADHDUFLAG | Total packets | Discarded packets |
| A | 0 | 13502 | 2 |
| B | 0 | 13888 | 2 |
| C | 0 | 13554 | 2 |
| D | 0 | 16221 | 2 |
| Quadrant | Total seconds | Saturated seconds | Saturation percentage |
|---|---|---|---|
| A | 6461 | 49 | 0.758397% |
| B | 6462 | 65 | 1.005881% |
| C | 6462 | 74 | 1.145156% |
| D | 6462 | 228 | 3.528319% |
Noise dominated data is calculated using 1-second bins in cleaned event files. If a bin has >2000 counts, and if more than 50% of those come from <1% of pixels, then it is considered to be noise-dominated and hence unusable.
| Quadrant | # 1 sec bins | Bins with >0 counts | Bins with >2000 counts | High rate bins dominated by noise | Noise dominated (total time) | Noise dominated (detector-on time) | Marked lightcurve |
|---|---|---|---|---|---|---|---|
| A | 7636 | 6461 | 0 | 0 | 0.00% | 0.00% |  |
| B | 7637 | 6462 | 14 | 14 | 0.18% | 0.22% | 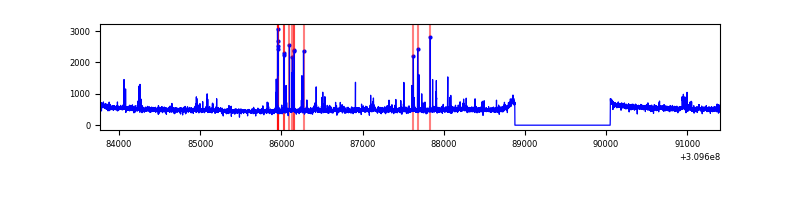 |
| C | 7637 | 6462 | 9 | 9 | 0.12% | 0.14% | 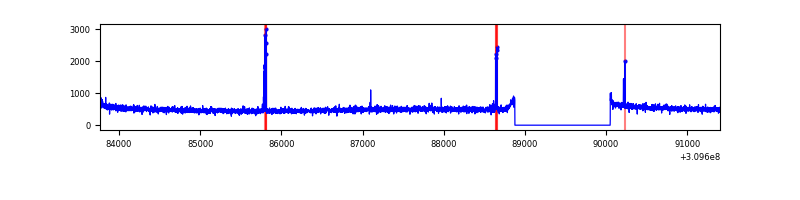 |
| D | 7637 | 6462 | 186 | 186 | 2.44% | 2.88% |  |
Top three noisy pixels from each quadrant. If the there are fewer than three noisy pixels in the level2.evt file, extra rows are filled as -1
| Pixel properties | Quadrant properties | ||||||
|---|---|---|---|---|---|---|---|
| Quadrant | DetID | PixID | Counts | Sigma | Mean | Median | Sigma |
| A | 13 | 254 | 10263 | 57.23 | 836 | 821 | 165.0 |
| A | 15 | 236 | 8240 | 44.97 | 836 | 821 | 165.0 |
| A | 0 | 226 | 7215 | 38.76 | 836 | 821 | 165.0 |
| B | 3 | 64 | 109022 | 706.59 | 818 | 799 | 153.2 |
| B | 0 | 230 | 35550 | 226.89 | 818 | 799 | 153.2 |
| B | 12 | 111 | 18324 | 114.42 | 818 | 799 | 153.2 |
| C | 14 | 238 | 126351 | 694.3 | 785 | 789 | 180.8 |
| C | 10 | 22 | 63989 | 349.46 | 785 | 789 | 180.8 |
| C | 13 | 61 | 5547 | 26.31 | 785 | 789 | 180.8 |
| D | 11 | 176 | 369045 | 1926.67 | 796 | 773 | 191.1 |
| D | 1 | 52 | 299553 | 1563.11 | 796 | 773 | 191.1 |
| D | 2 | 136 | 205430 | 1070.69 | 796 | 773 | 191.1 |
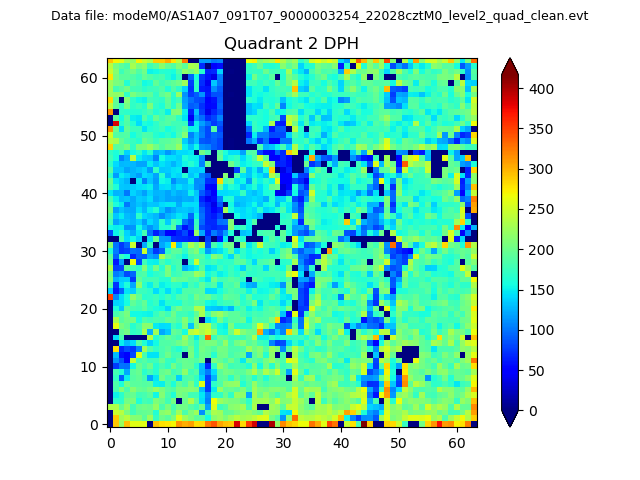
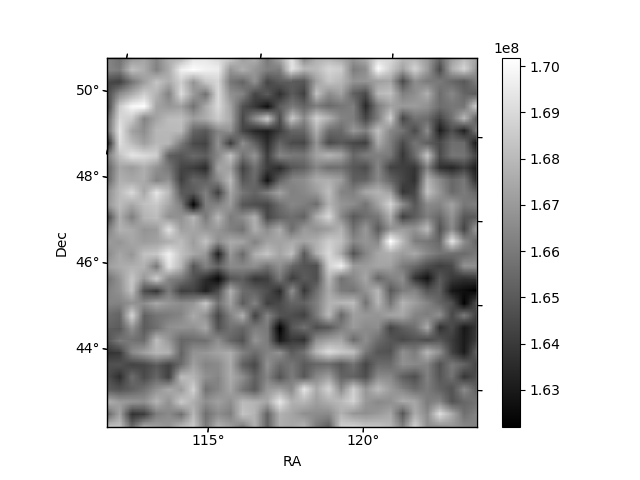
Histogram calculated using DETX and DETY for each event in the final _common_clean file
| Quadrant A | 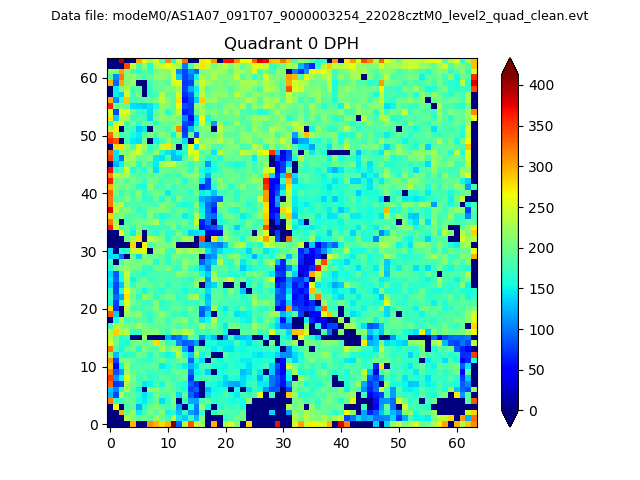 |
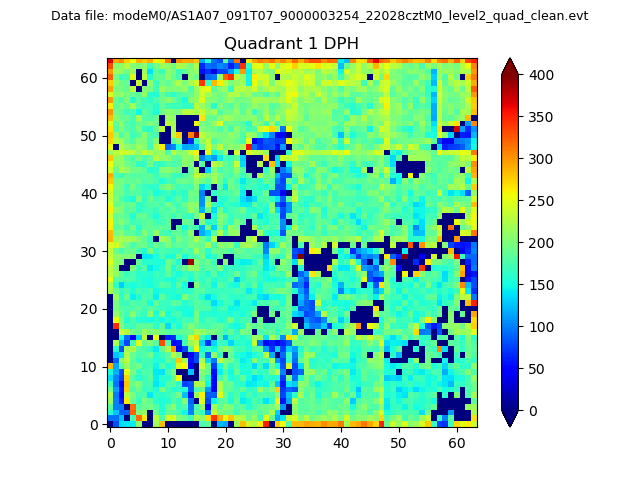 |
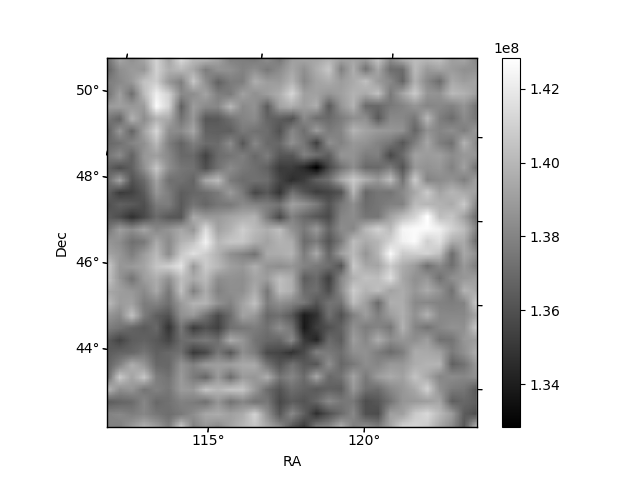
Quadrant B |
|---|---|---|---|
| Quadrant D | 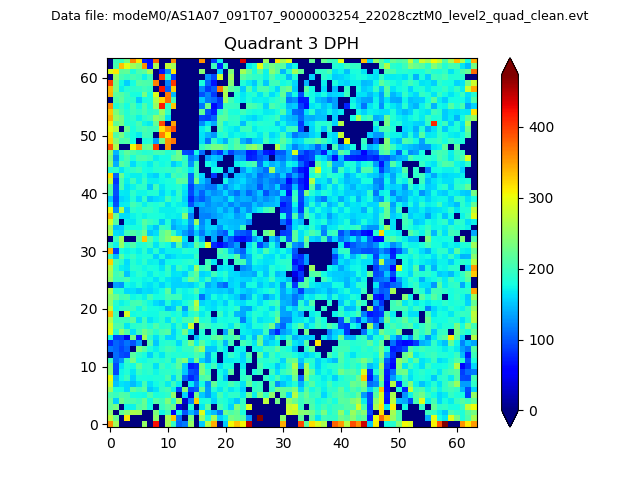 |
 |
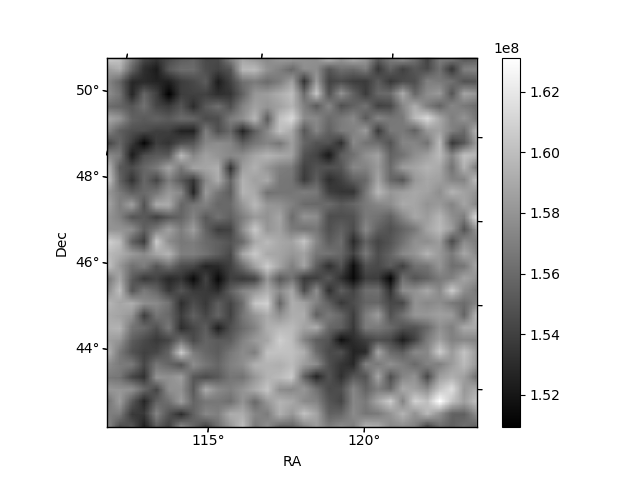
Quadrant C |
| Plot type | Count rate plots | Images |
|---|---|---|
| Comparison with Poisson distribution Blue bars denote a histogram of data divided into 1 sec bins. Red curve is a Poisson curve with rate = median count rate of data. |
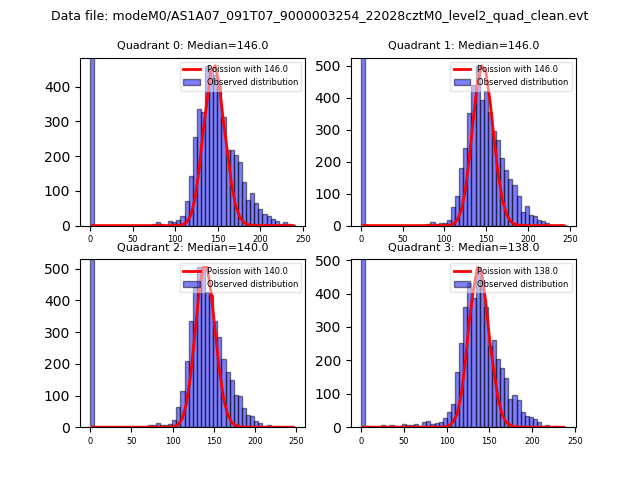 |
 |
| Quadrant-wise count rates Data is divided into 100 sec bins |
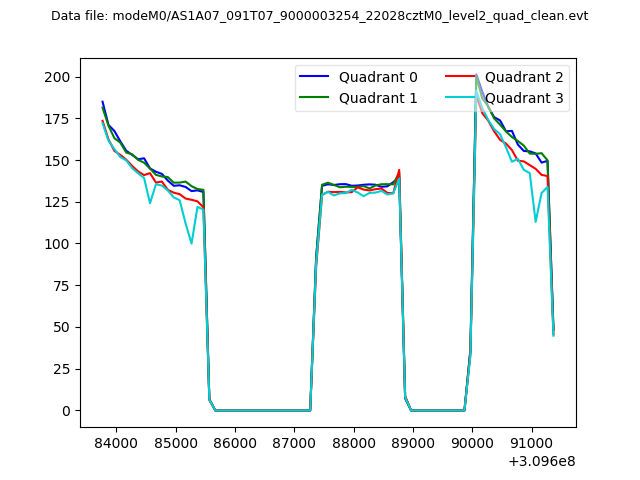 |
|
| Module-wise count rates for Quadrant A Data is divided into 100 sec bins |
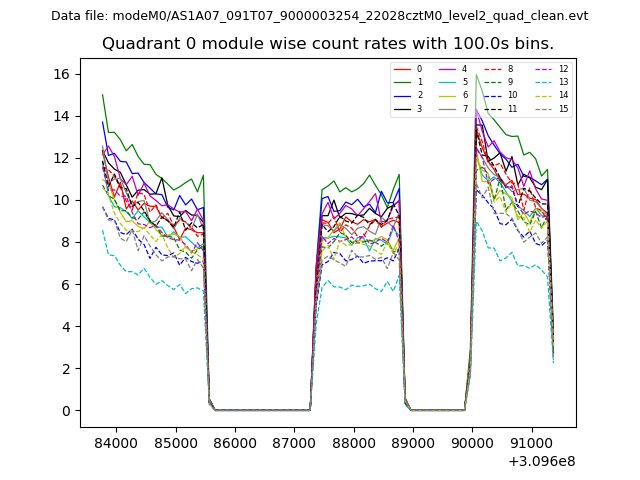 |
 |
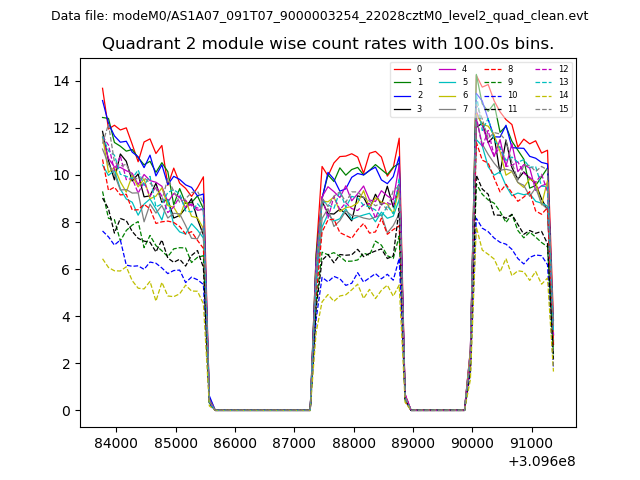
| Module-wise count rates for Quadrant B Data is divided into 100 sec bins |
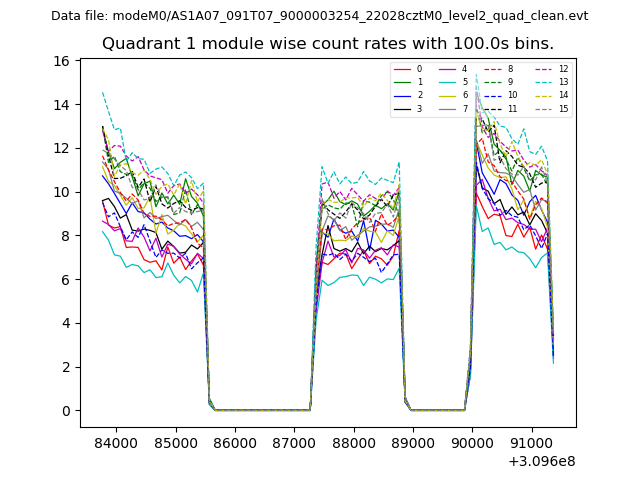 |
 |
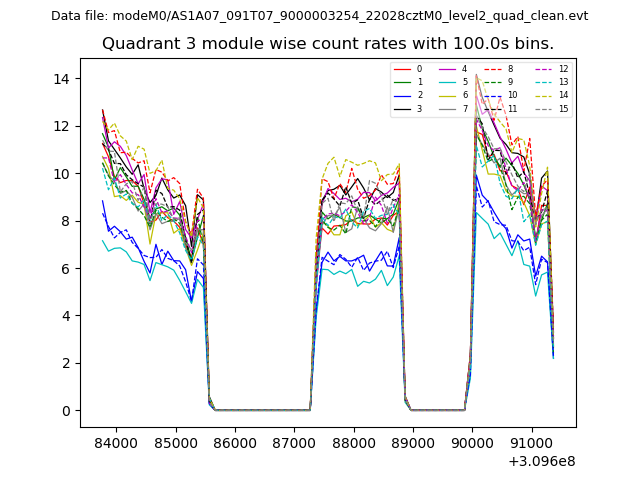
| Module-wise count rates for Quadrant C Data is divided into 100 sec bins |
 |
 |
| Module-wise count rates for Quadrant D Data is divided into 100 sec bins |
 |
 |
| Parameter | Plot |
|---|---|
| CZT HV Monitor | 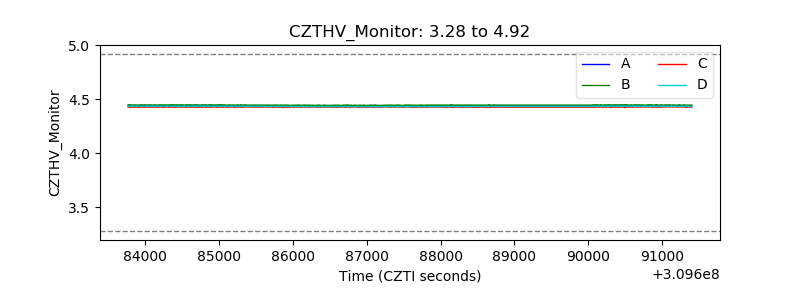 |
| D_VDD |  |
| Temperature 1 | 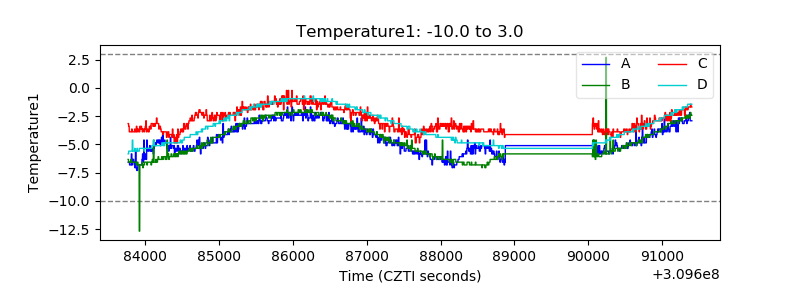 |
| Veto HV Monitor |  |
| Veto LLD | 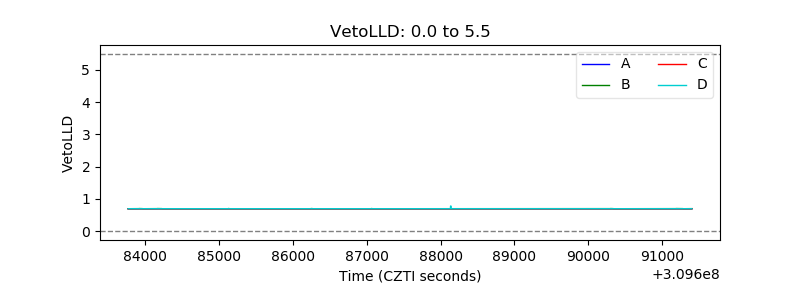 |
| Alpha Counter | 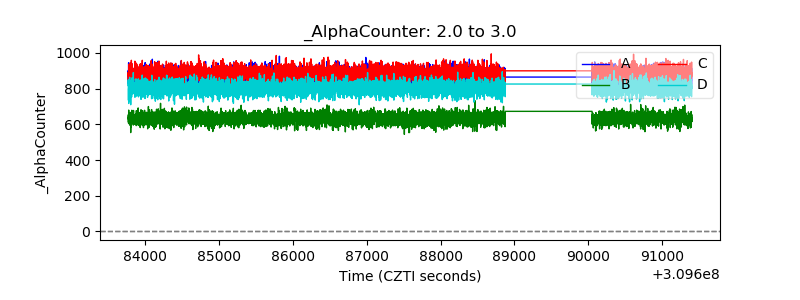 |
| _CPM_Rate | 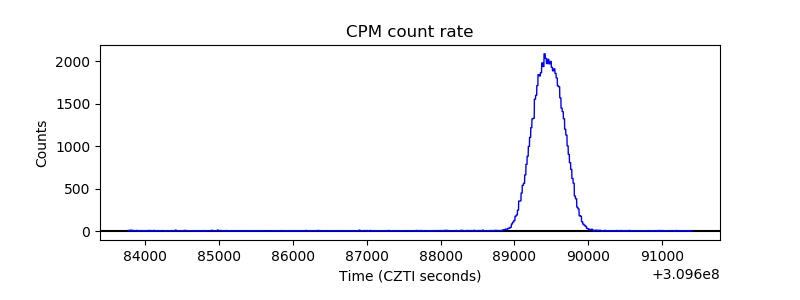 |
| CZT Counter | 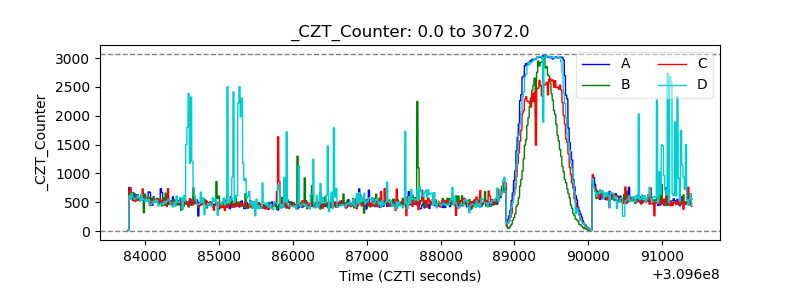 |
| +2.5 Volts monitor |  |
| +5 Volts monitor |  |
| _ROLL_ROT | 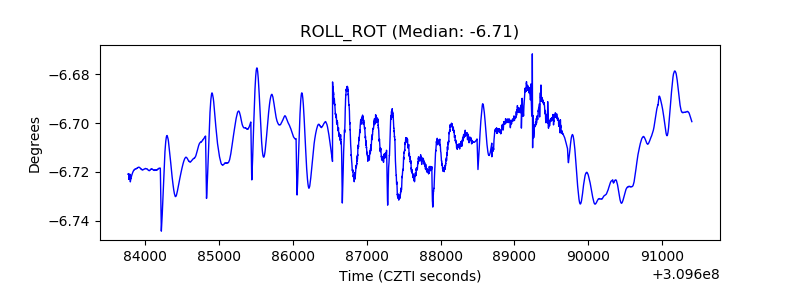 |
| _Roll_DEC | 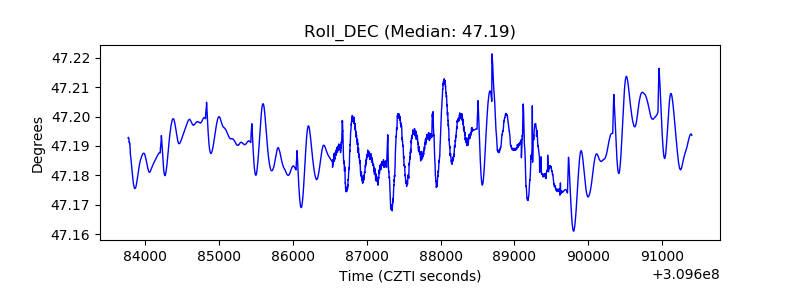 |
| _Roll_RA | 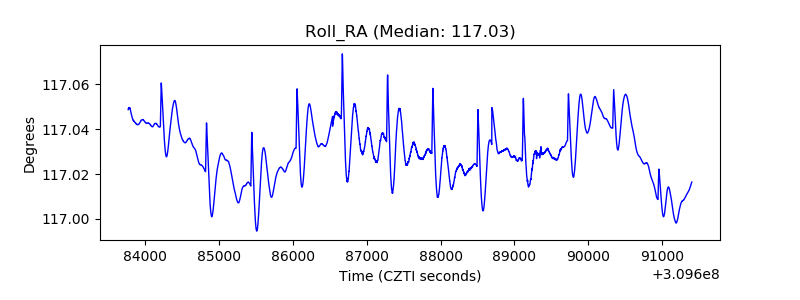 |
| Veto Counter | 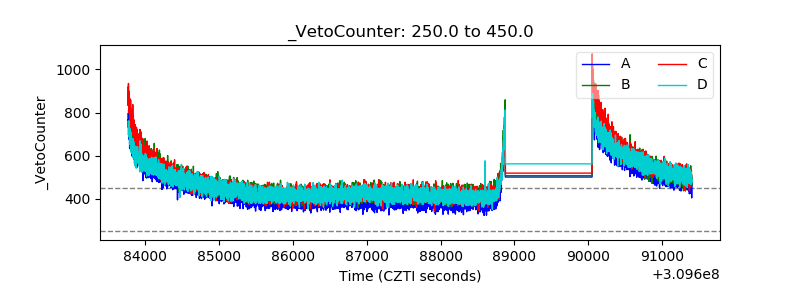 |