| Param | Original file | Final file |
|---|---|---|
| Filename | modeM0/AS1A07_091T07_9000003254_22029cztM0_level2.evt | modeM0/AS1A07_091T07_9000003254_22029cztM0_level2_quad_clean.evt |
| Size (bytes) | 466,871,040 | 91,483,200 |
| Size | 445.2 MB | 87.2 MB |
| Events in quadrant A | 3,142,095 | 605,464 |
| Events in quadrant B | 3,277,420 | 604,484 |
| Events in quadrant C | 3,100,649 | 579,434 |
| Events in quadrant D | 4,208,213 | 558,493 |
| Mode SS | |||
|---|---|---|---|
| Quadrant | BADHDUFLAG | Total packets | Discarded packets |
| A | 0 | 122 | 0 |
| B | 0 | 122 | 0 |
| C | 0 | 122 | 0 |
| D | 0 | 122 | 0 |
| Mode M9 | |||
|---|---|---|---|
| Quadrant | BADHDUFLAG | Total packets | Discarded packets |
| A | 0 | 13 | 0 |
| B | 0 | 13 | 0 |
| C | 0 | 13 | 0 |
| D | 0 | 13 | 0 |
| Mode M0 | |||
|---|---|---|---|
| Quadrant | BADHDUFLAG | Total packets | Discarded packets |
| A | 0 | 12964 | 1 |
| B | 0 | 13379 | 1 |
| C | 0 | 12732 | 1 |
| D | 0 | 16366 | 1 |
| Quadrant | Total seconds | Saturated seconds | Saturation percentage |
|---|---|---|---|
| A | 6053 | 57 | 0.941682% |
| B | 6053 | 94 | 1.552949% |
| C | 6053 | 70 | 1.156451% |
| D | 6053 | 359 | 5.930943% |
Noise dominated data is calculated using 1-second bins in cleaned event files. If a bin has >2000 counts, and if more than 50% of those come from <1% of pixels, then it is considered to be noise-dominated and hence unusable.
| Quadrant | # 1 sec bins | Bins with >0 counts | Bins with >2000 counts | High rate bins dominated by noise | Noise dominated (total time) | Noise dominated (detector-on time) | Marked lightcurve |
|---|---|---|---|---|---|---|---|
| A | 7343 | 6053 | 0 | 0 | 0.00% | 0.00% | 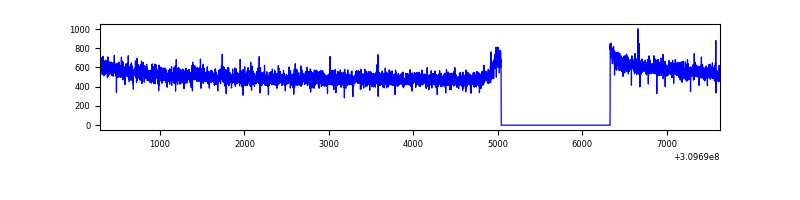 |
| B | 7343 | 6053 | 33 | 33 | 0.45% | 0.55% | 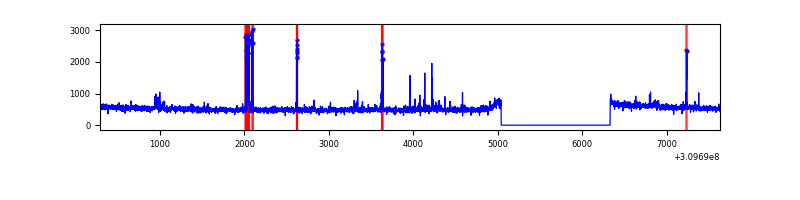 |
| C | 7343 | 6053 | 0 | 0 | 0.00% | 0.00% | 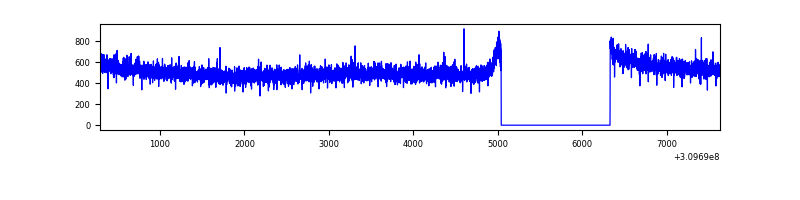 |
| D | 7343 | 6053 | 321 | 321 | 4.37% | 5.30% | 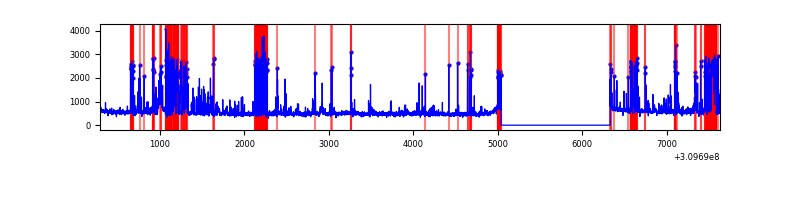 |
Top three noisy pixels from each quadrant. If the there are fewer than three noisy pixels in the level2.evt file, extra rows are filled as -1
| Pixel properties | Quadrant properties | ||||||
|---|---|---|---|---|---|---|---|
| Quadrant | DetID | PixID | Counts | Sigma | Mean | Median | Sigma |
| A | 15 | 236 | 13075 | 75.84 | 812 | 798 | 161.9 |
| A | 13 | 254 | 9785 | 55.51 | 812 | 798 | 161.9 |
| A | 0 | 226 | 7099 | 38.92 | 812 | 798 | 161.9 |
| B | 3 | 64 | 136074 | 920.06 | 791 | 772 | 147.1 |
| B | 0 | 230 | 41342 | 275.88 | 791 | 772 | 147.1 |
| B | 12 | 111 | 16796 | 108.96 | 791 | 772 | 147.1 |
| C | 14 | 238 | 122029 | 691.96 | 763 | 769 | 175.2 |
| C | 13 | 61 | 5316 | 25.95 | 763 | 769 | 175.2 |
| C | 3 | 202 | 1892 | 6.41 | 763 | 769 | 175.2 |
| D | 1 | 52 | 767259 | 4222.39 | 760 | 739 | 181.5 |
| D | 11 | 176 | 253467 | 1392.16 | 760 | 739 | 181.5 |
| D | 5 | 222 | 187768 | 1030.25 | 760 | 739 | 181.5 |
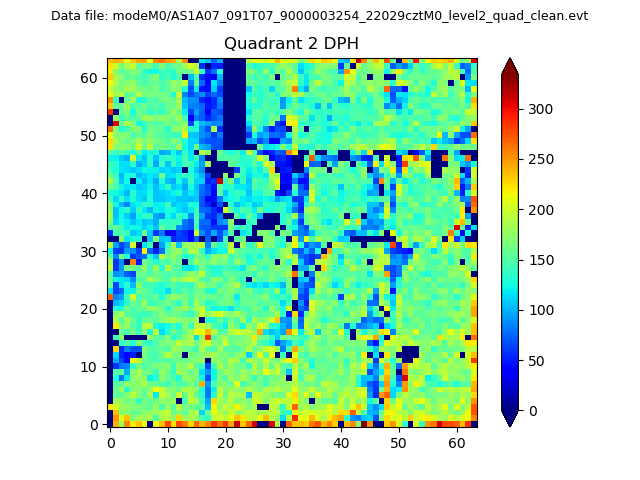
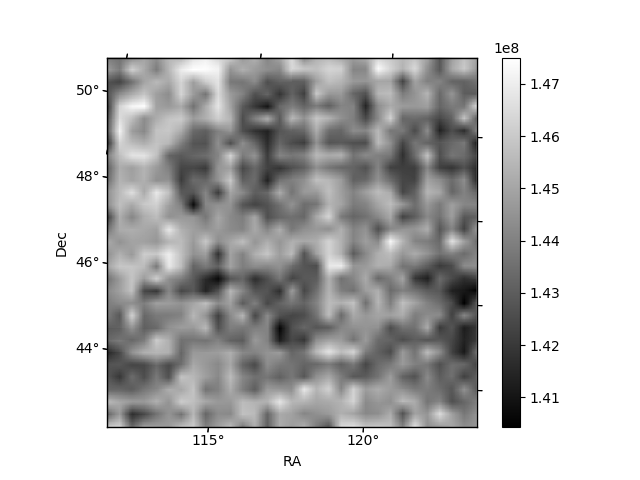
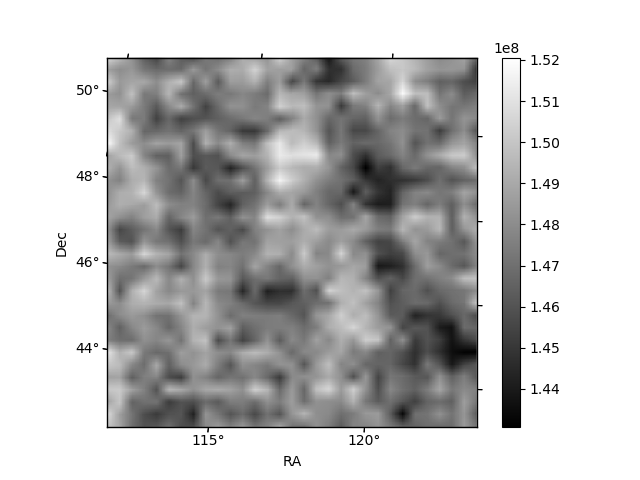
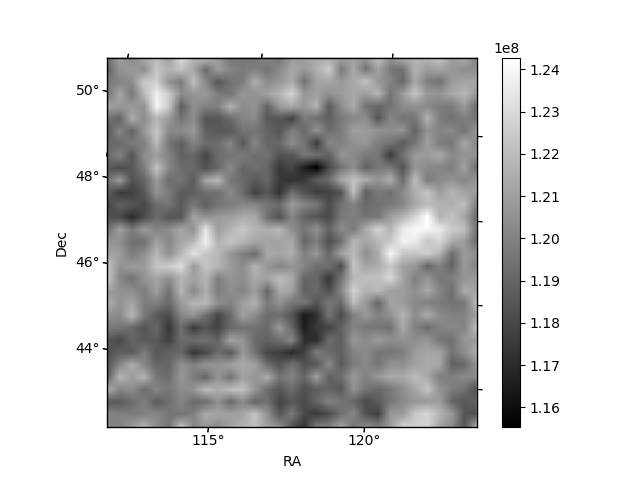
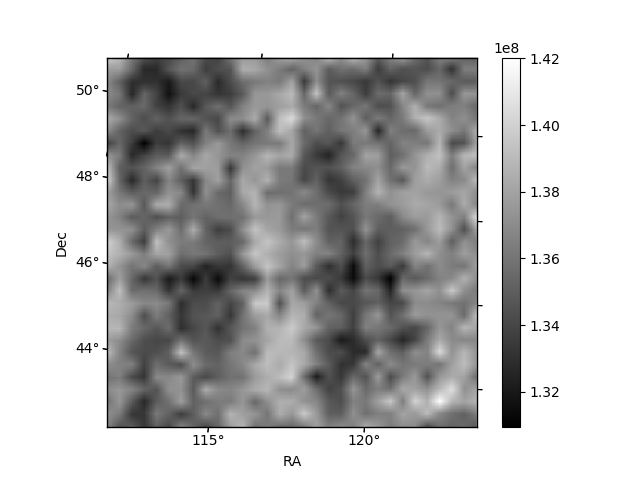
Histogram calculated using DETX and DETY for each event in the final _common_clean file
| Quadrant A | 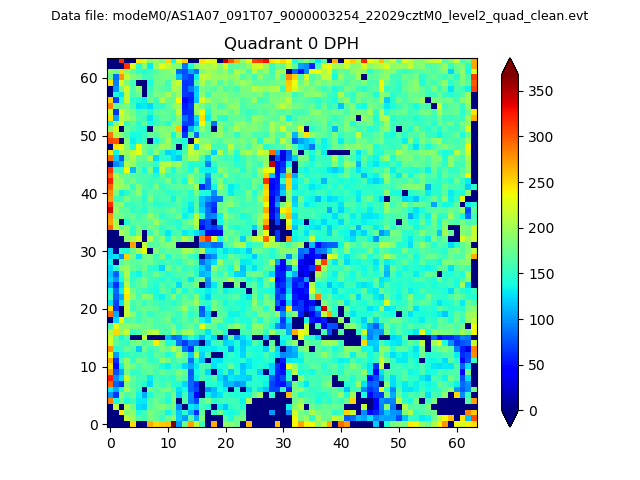 |
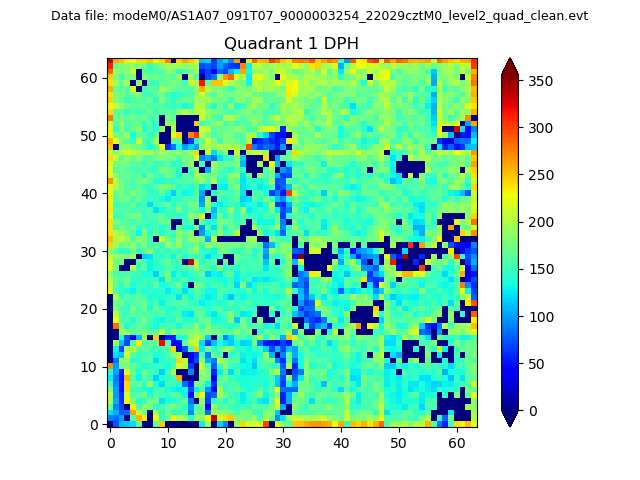 |
Quadrant B |
|---|---|---|---|
| Quadrant D | 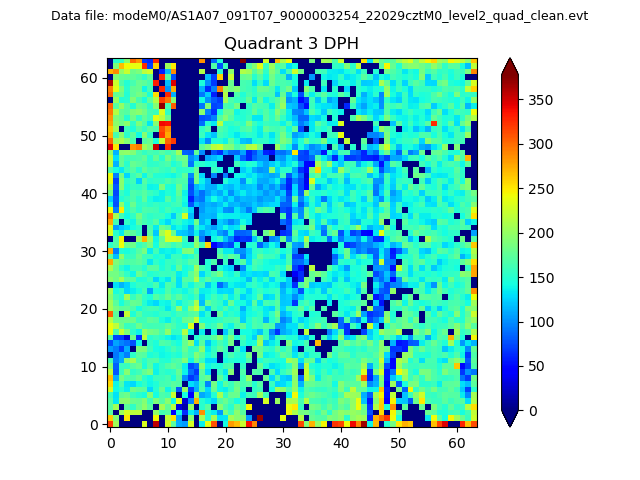 |
 |
Quadrant C |
| Plot type | Count rate plots | Images |
|---|---|---|
| Comparison with Poisson distribution Blue bars denote a histogram of data divided into 1 sec bins. Red curve is a Poisson curve with rate = median count rate of data. |
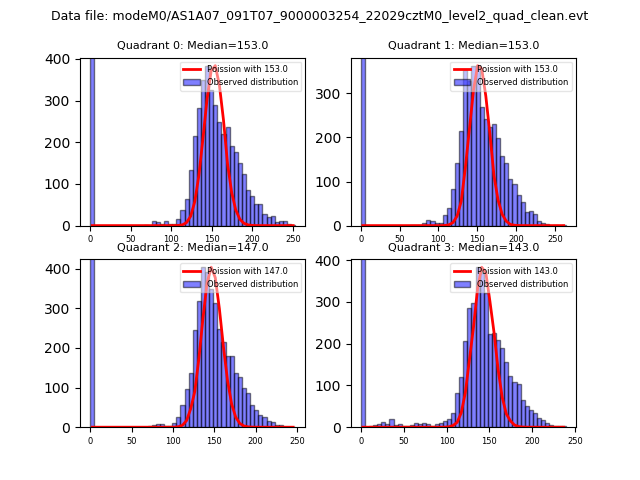 |
 |
| Quadrant-wise count rates Data is divided into 100 sec bins |
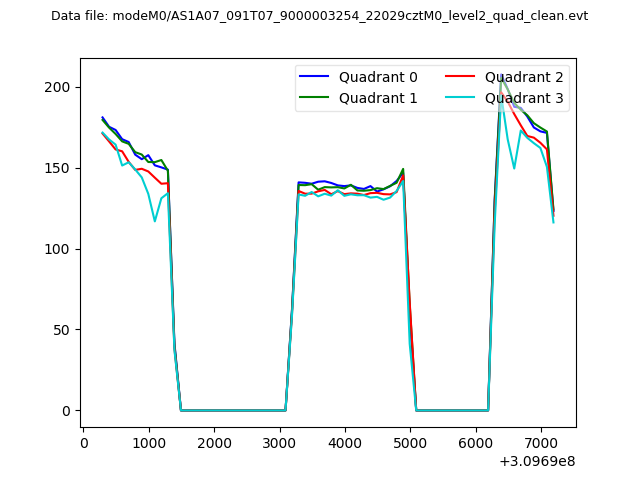 |
|
| Module-wise count rates for Quadrant A Data is divided into 100 sec bins |
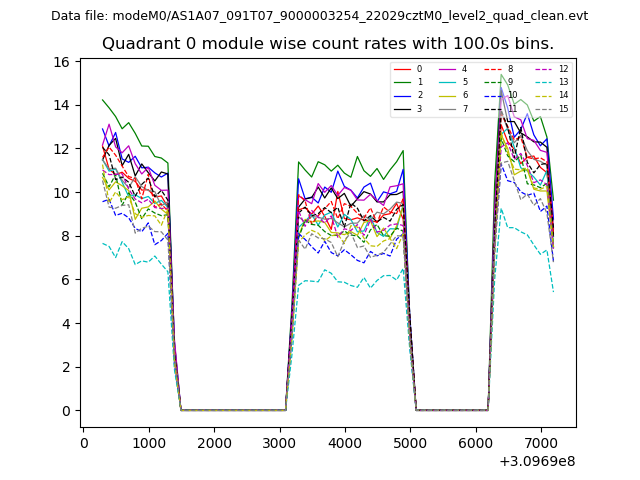 |
 |
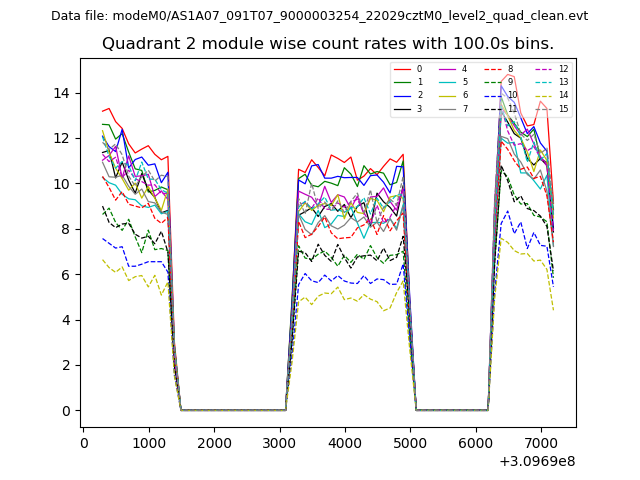
| Module-wise count rates for Quadrant B Data is divided into 100 sec bins |
 |
 |
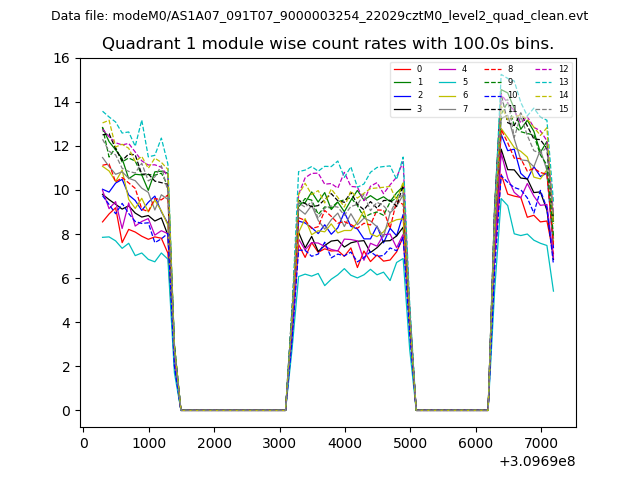
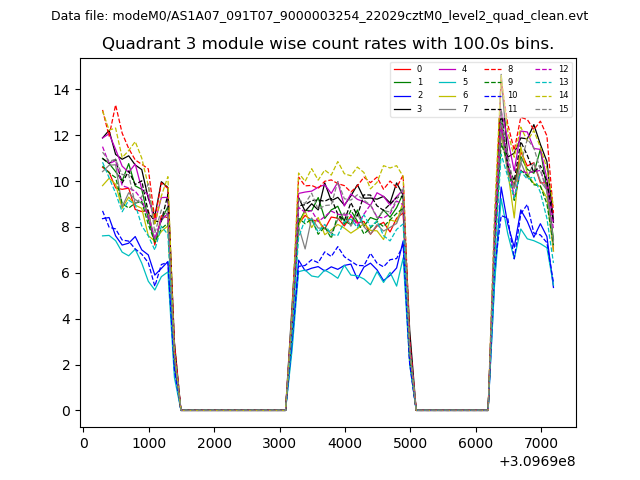
| Module-wise count rates for Quadrant C Data is divided into 100 sec bins |
 |
 |
| Module-wise count rates for Quadrant D Data is divided into 100 sec bins |
 |
 |
| Parameter | Plot |
|---|---|
| CZT HV Monitor | 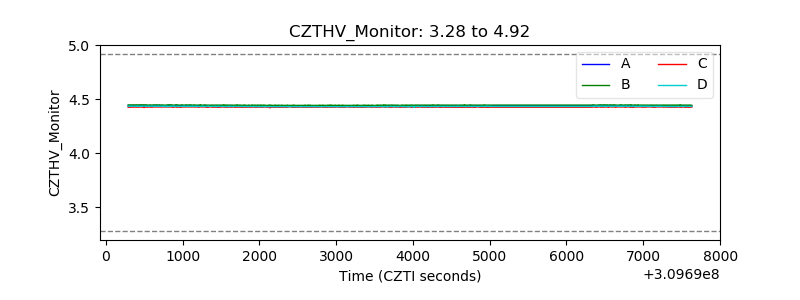 |
| D_VDD | 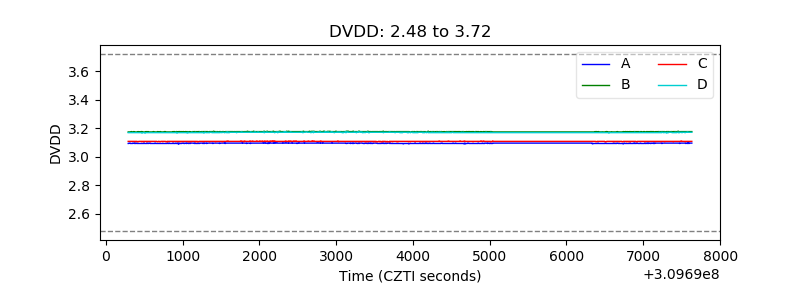 |
| Temperature 1 | 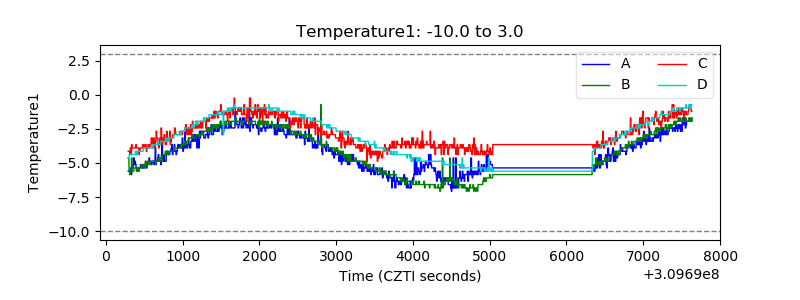 |
| Veto HV Monitor | 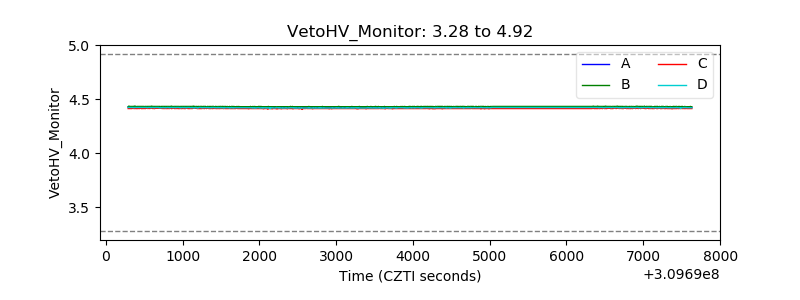 |
| Veto LLD | 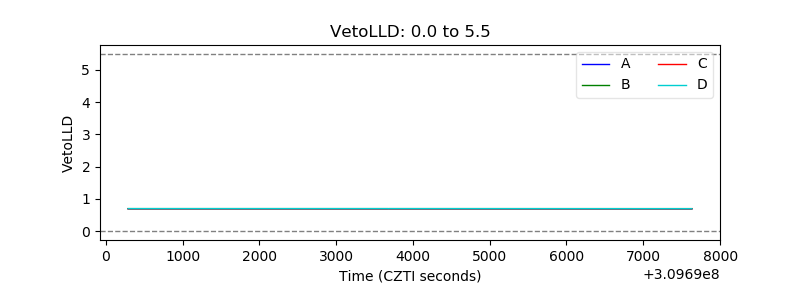 |
| Alpha Counter | 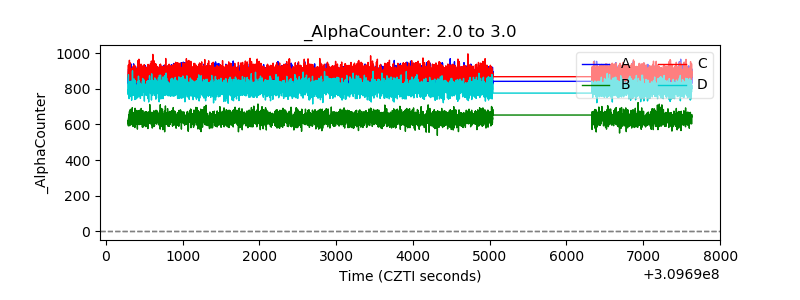 |
| _CPM_Rate | 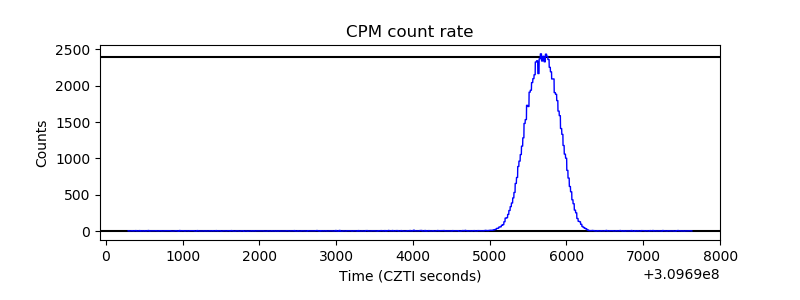 |
| CZT Counter | 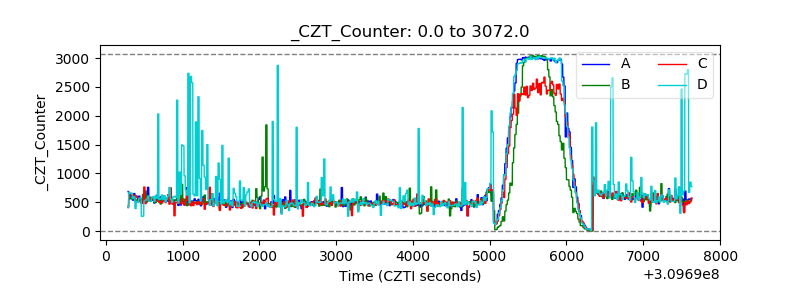 |
| +2.5 Volts monitor |  |
| +5 Volts monitor |  |
| _ROLL_ROT | 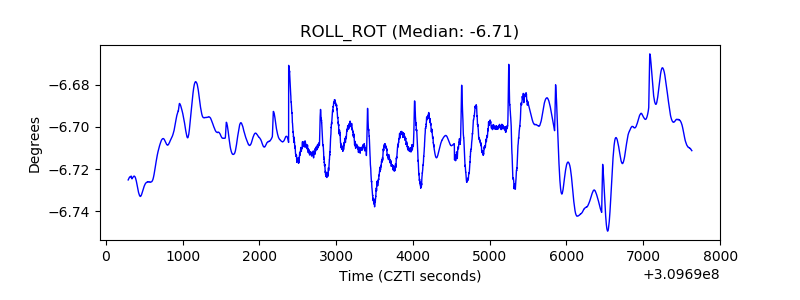 |
| _Roll_DEC | 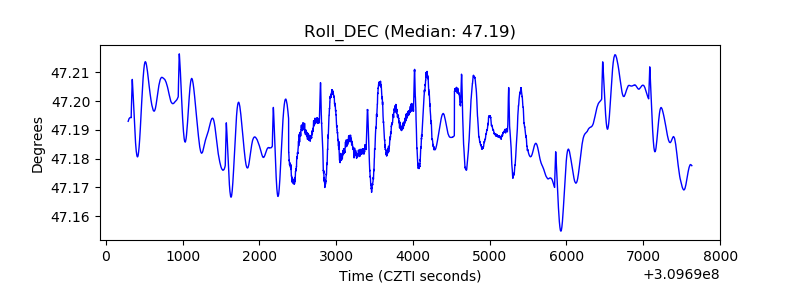 |
| _Roll_RA | 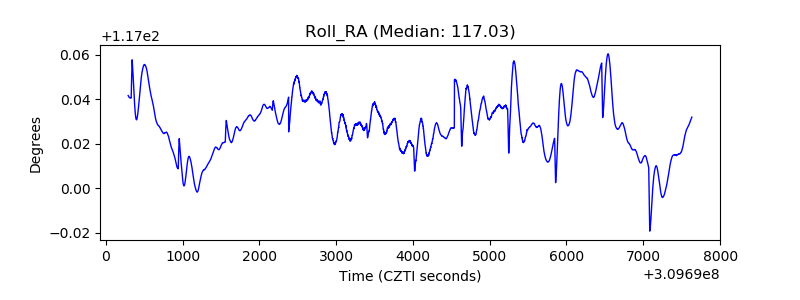 |
| Veto Counter | 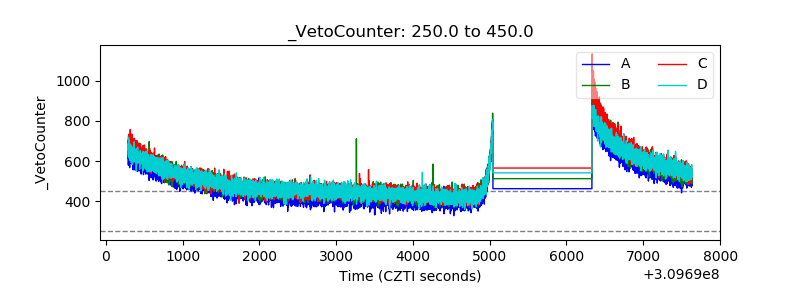 |