| Param | Original file | Final file |
|---|---|---|
| Filename | modeM0/AS1A07_091T07_9000003254_22032cztM0_level2.evt | modeM0/AS1A07_091T07_9000003254_22032cztM0_level2_quad_clean.evt |
| Size (bytes) | 264,484,800 | 19,638,720 |
| Size | 252.2 MB | 18.7 MB |
| Events in quadrant A | 1,298,254 | 108,767 |
| Events in quadrant B | 1,295,101 | 108,917 |
| Events in quadrant C | 1,271,140 | 106,242 |
| Events in quadrant D | 3,978,363 | 94,718 |
| Mode SS | |||
|---|---|---|---|
| Quadrant | BADHDUFLAG | Total packets | Discarded packets |
| A | 0 | 48 | 0 |
| B | 0 | 48 | 0 |
| C | 0 | 48 | 0 |
| D | 0 | 48 | 0 |
| Mode M0 | |||
|---|---|---|---|
| Quadrant | BADHDUFLAG | Total packets | Discarded packets |
| A | 0 | 5316 | 0 |
| B | 0 | 5275 | 0 |
| C | 0 | 5079 | 0 |
| D | 0 | 13510 | 0 |
| Quadrant | Total seconds | Saturated seconds | Saturation percentage |
|---|---|---|---|
| A | 2438 | 3 | 0.123052% |
| B | 2439 | 11 | 0.451005% |
| C | 2439 | 9 | 0.369004% |
| D | 2439 | 976 | 40.016400% |
Noise dominated data is calculated using 1-second bins in cleaned event files. If a bin has >2000 counts, and if more than 50% of those come from <1% of pixels, then it is considered to be noise-dominated and hence unusable.
| Quadrant | # 1 sec bins | Bins with >0 counts | Bins with >2000 counts | High rate bins dominated by noise | Noise dominated (total time) | Noise dominated (detector-on time) | Marked lightcurve |
|---|---|---|---|---|---|---|---|
| A | 2438 | 2438 | 0 | 0 | 0.00% | 0.00% | 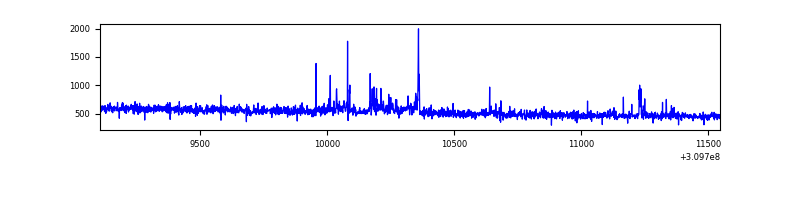 |
| B | 2439 | 2439 | 4 | 4 | 0.16% | 0.16% | 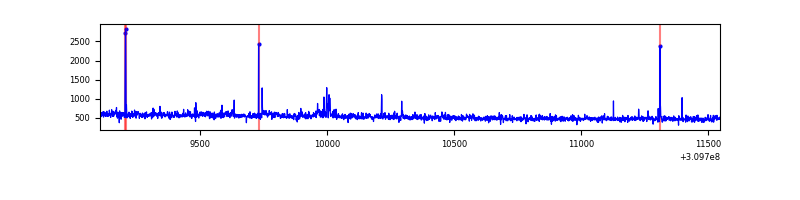 |
| C | 2439 | 2439 | 0 | 0 | 0.00% | 0.00% | 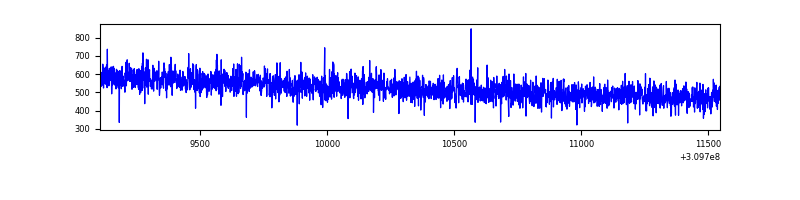 |
| D | 2439 | 2439 | 936 | 936 | 38.38% | 38.38% | 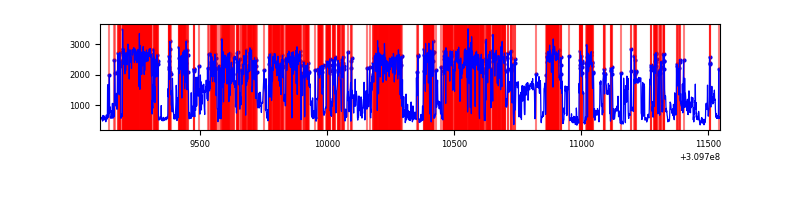 |
Top three noisy pixels from each quadrant. If the there are fewer than three noisy pixels in the level2.evt file, extra rows are filled as -1
| Pixel properties | Quadrant properties | ||||||
|---|---|---|---|---|---|---|---|
| Quadrant | DetID | PixID | Counts | Sigma | Mean | Median | Sigma |
| A | 15 | 236 | 45494 | 680.52 | 324 | 318 | 66.4 |
| A | 13 | 254 | 4476 | 62.63 | 324 | 318 | 66.4 |
| A | 0 | 226 | 2911 | 39.06 | 324 | 318 | 66.4 |
| B | 0 | 190 | 20587 | 333.04 | 319 | 312 | 60.9 |
| B | 3 | 64 | 18414 | 297.35 | 319 | 312 | 60.9 |
| B | 4 | 216 | 6890 | 108.05 | 319 | 312 | 60.9 |
| C | 14 | 238 | 50215 | 678.3 | 313 | 315 | 73.6 |
| C | 13 | 61 | 2151 | 24.96 | 313 | 315 | 73.6 |
| C | 3 | 202 | 840 | 7.14 | 313 | 315 | 73.6 |
| D | 1 | 52 | 2615882 | 40007.35 | 266 | 258 | 65.4 |
| D | 12 | 233 | 195995 | 2993.9 | 266 | 258 | 65.4 |
| D | 11 | 176 | 59197 | 901.5 | 266 | 258 | 65.4 |
Histogram calculated using DETX and DETY for each event in the final _common_clean file
| Quadrant A | 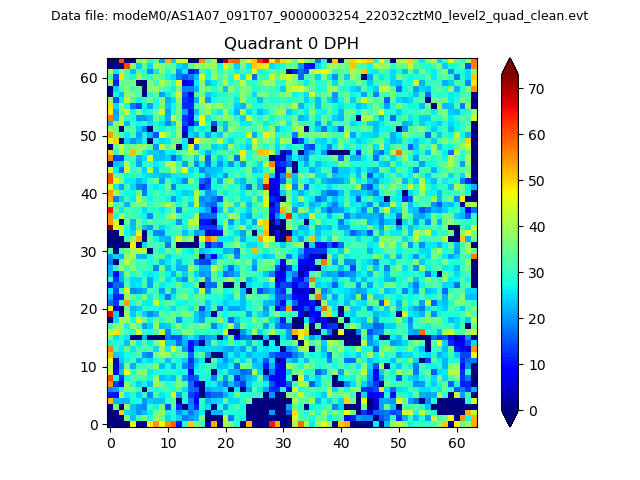 |
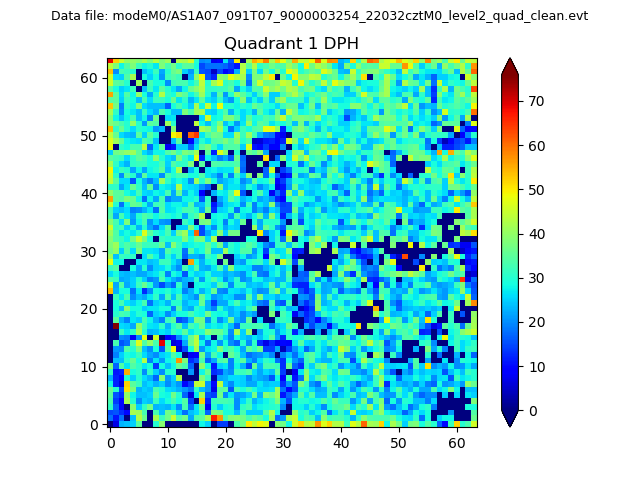 |
Quadrant B |
|---|---|---|---|
| Quadrant D | 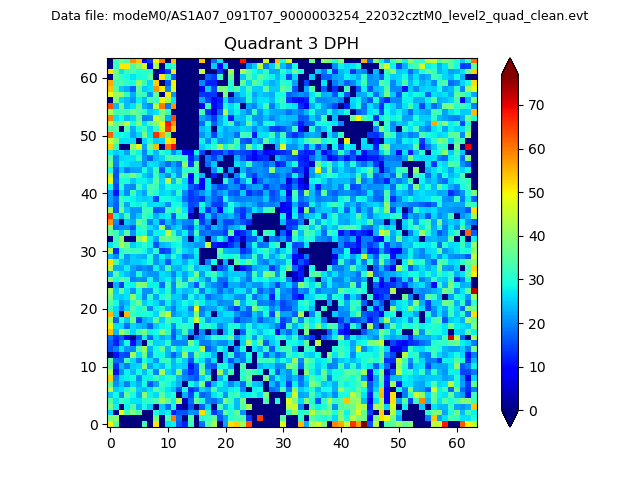 |
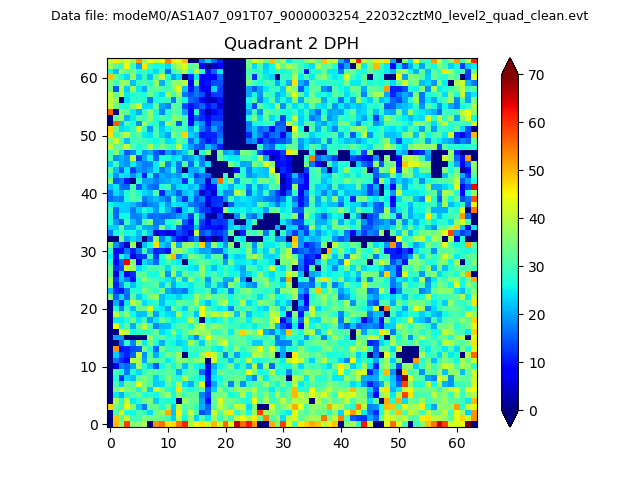 |
Quadrant C |
| Plot type | Count rate plots | Images |
|---|---|---|
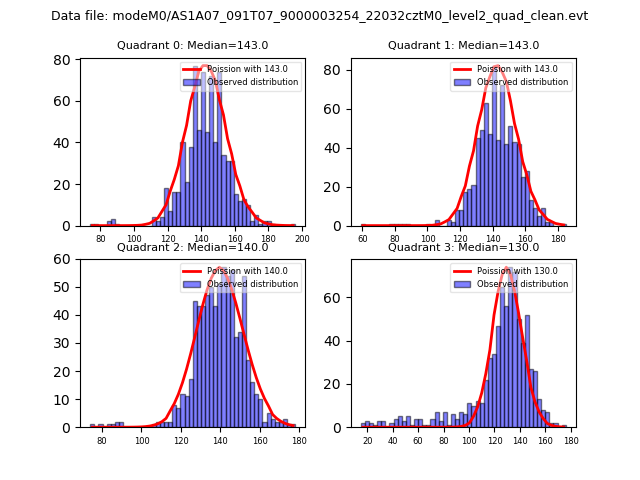
| Comparison with Poisson distribution Blue bars denote a histogram of data divided into 1 sec bins. Red curve is a Poisson curve with rate = median count rate of data. |
 |
 |
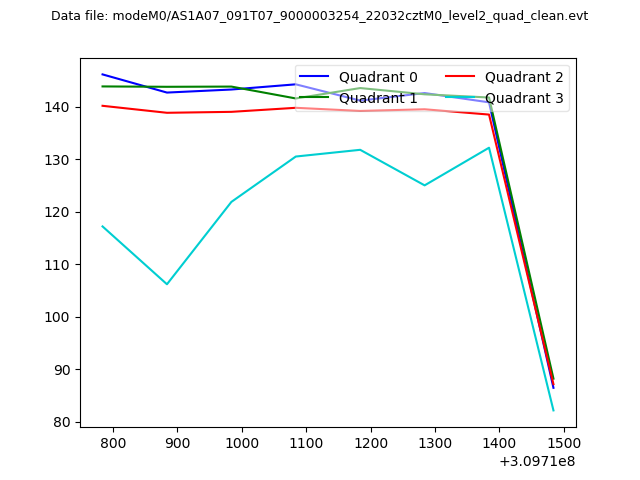
| Quadrant-wise count rates Data is divided into 100 sec bins |
 |
|
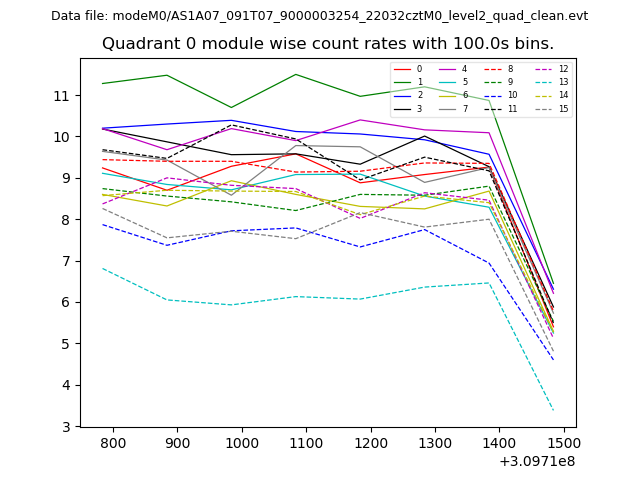
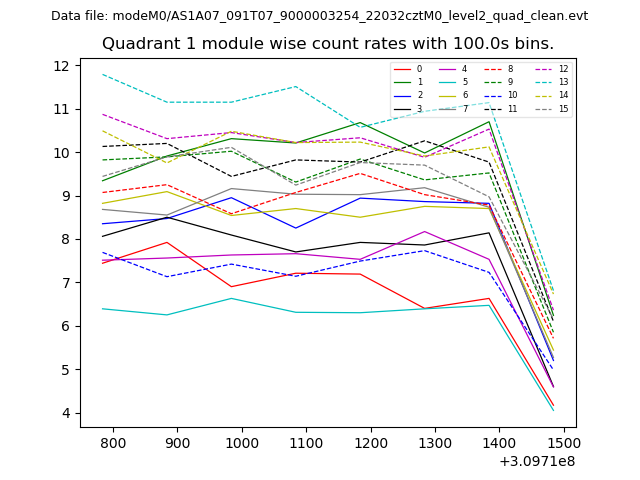
| Module-wise count rates for Quadrant A Data is divided into 100 sec bins |
 |
 |
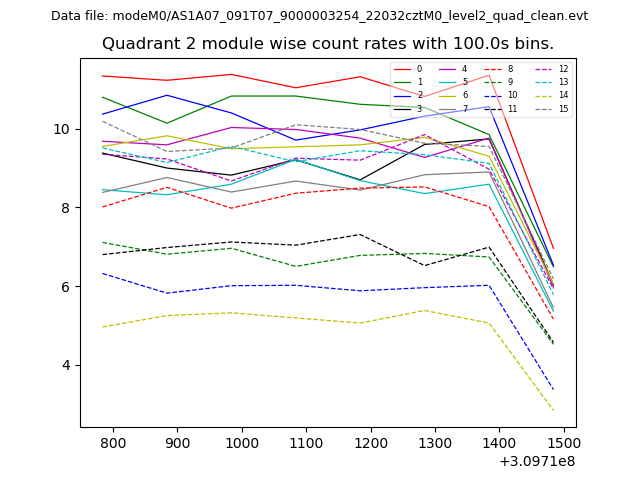
| Module-wise count rates for Quadrant B Data is divided into 100 sec bins |
 |
 |
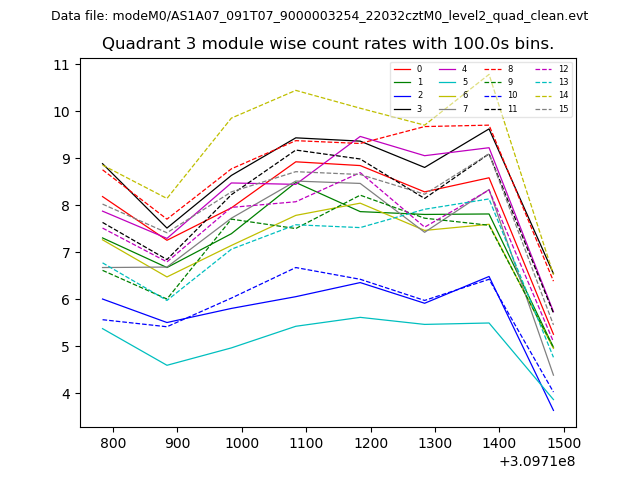
| Module-wise count rates for Quadrant C Data is divided into 100 sec bins |
 |
 |
| Module-wise count rates for Quadrant D Data is divided into 100 sec bins |
 |
 |
| Parameter | Plot |
|---|---|
| CZT HV Monitor | 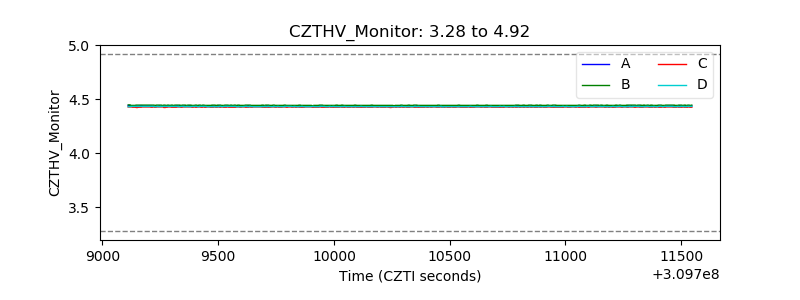 |
| D_VDD |  |
| Temperature 1 | 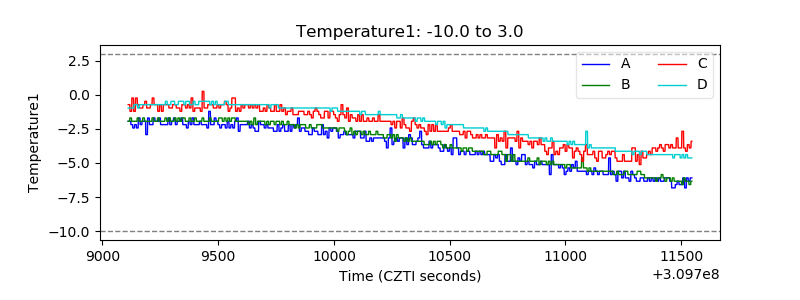 |
| Veto HV Monitor | 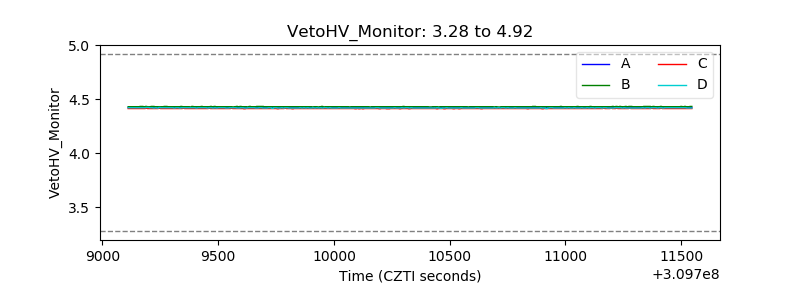 |
| Veto LLD | 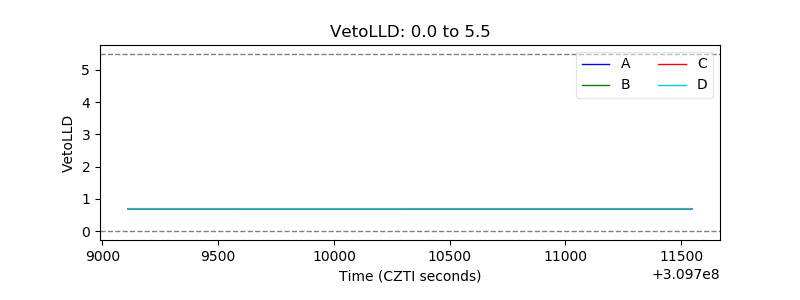 |
| Alpha Counter | 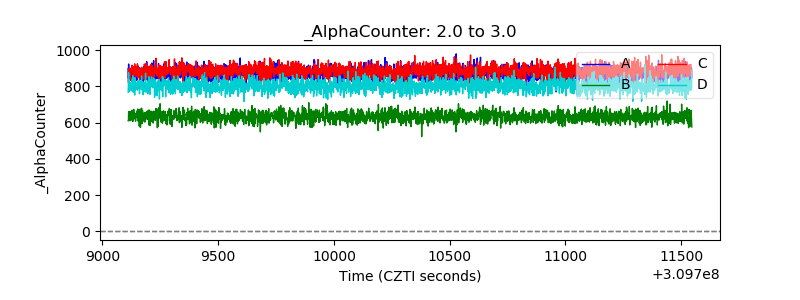 |
| _CPM_Rate |  |
| CZT Counter | 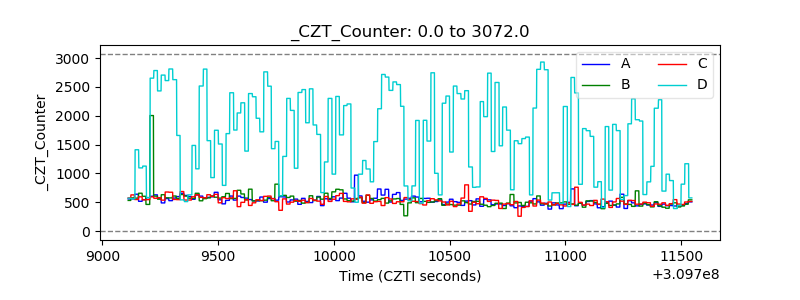 |
| +2.5 Volts monitor |  |
| +5 Volts monitor |  |
| _ROLL_ROT | 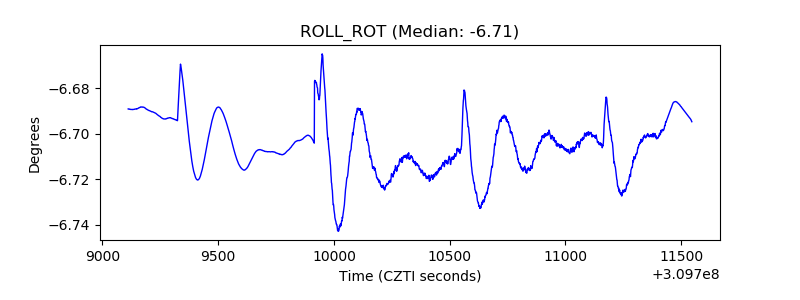 |
| _Roll_DEC | 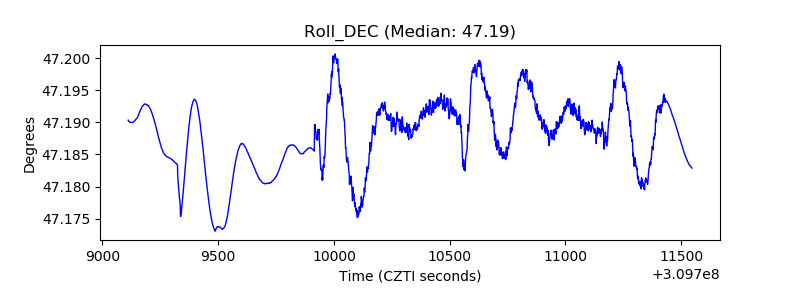 |
| _Roll_RA |  |
| Veto Counter | 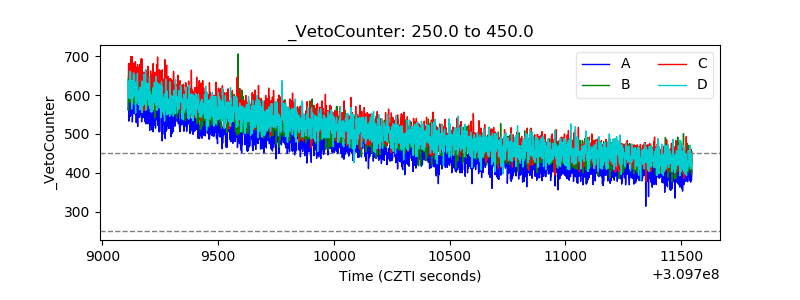 |