| Param | Original file | Final file |
|---|---|---|
| Filename | modeM0/AS1A07_134T01_9000003256_22032cztM0_level2.evt | modeM0/AS1A07_134T01_9000003256_22032cztM0_level2_quad_clean.evt |
| Size (bytes) | 236,318,400 | 35,824,320 |
| Size | 225.4 MB | 34.2 MB |
| Events in quadrant A | 1,328,785 | 235,442 |
| Events in quadrant B | 1,397,482 | 237,928 |
| Events in quadrant C | 1,321,691 | 228,250 |
| Events in quadrant D | 2,941,090 | 206,733 |
| Mode M9 | |||
|---|---|---|---|
| Quadrant | BADHDUFLAG | Total packets | Discarded packets |
| A | 0 | 12 | 0 |
| B | 0 | 12 | 0 |
| C | 0 | 12 | 0 |
| D | 0 | 12 | 0 |
| Mode SS | |||
|---|---|---|---|
| Quadrant | BADHDUFLAG | Total packets | Discarded packets |
| A | 0 | 52 | 0 |
| B | 0 | 52 | 0 |
| C | 0 | 52 | 0 |
| D | 0 | 52 | 0 |
| Mode M0 | |||
|---|---|---|---|
| Quadrant | BADHDUFLAG | Total packets | Discarded packets |
| A | 0 | 5383 | 1 |
| B | 0 | 5651 | 1 |
| C | 0 | 5427 | 1 |
| D | 0 | 10344 | 1 |
| Quadrant | Total seconds | Saturated seconds | Saturation percentage |
|---|---|---|---|
| A | 2451 | 85 | 3.467972% |
| B | 2451 | 103 | 4.202366% |
| C | 2451 | 104 | 4.243166% |
| D | 2451 | 504 | 20.563035% |
Noise dominated data is calculated using 1-second bins in cleaned event files. If a bin has >2000 counts, and if more than 50% of those come from <1% of pixels, then it is considered to be noise-dominated and hence unusable.
| Quadrant | # 1 sec bins | Bins with >0 counts | Bins with >2000 counts | High rate bins dominated by noise | Noise dominated (total time) | Noise dominated (detector-on time) | Marked lightcurve |
|---|---|---|---|---|---|---|---|
| A | 3606 | 2451 | 0 | 0 | 0.00% | 0.00% | 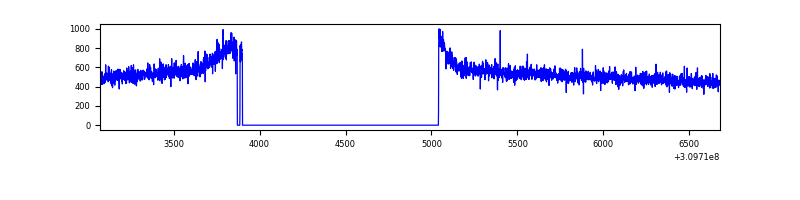 |
| B | 3606 | 2451 | 3 | 3 | 0.08% | 0.12% | 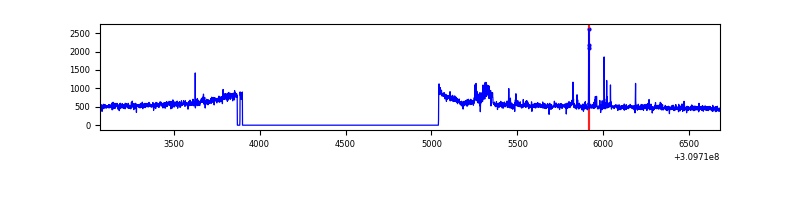 |
| C | 3606 | 2451 | 0 | 0 | 0.00% | 0.00% | 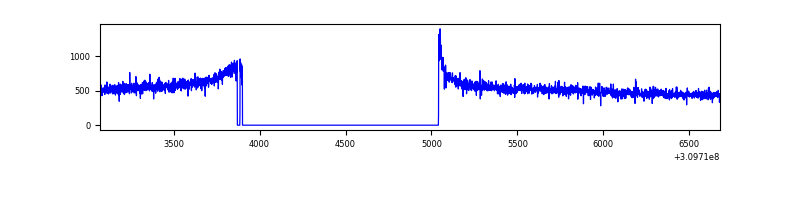 |
| D | 3606 | 2451 | 439 | 439 | 12.17% | 17.91% | 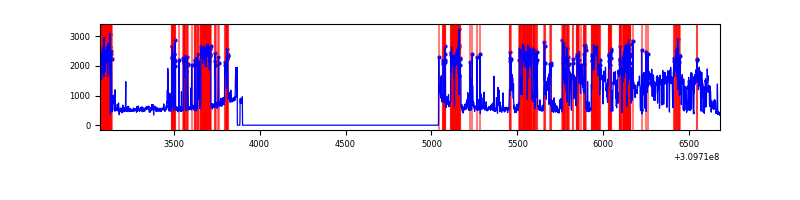 |
Top three noisy pixels from each quadrant. If the there are fewer than three noisy pixels in the level2.evt file, extra rows are filled as -1
| Pixel properties | Quadrant properties | ||||||
|---|---|---|---|---|---|---|---|
| Quadrant | DetID | PixID | Counts | Sigma | Mean | Median | Sigma |
| A | 13 | 254 | 4269 | 54.7 | 344 | 337 | 71.9 |
| A | 0 | 226 | 2993 | 36.95 | 344 | 337 | 71.9 |
| A | 3 | 137 | 2948 | 36.33 | 344 | 337 | 71.9 |
| B | 0 | 197 | 30776 | 453.16 | 339 | 330 | 67.2 |
| B | 3 | 64 | 15790 | 230.11 | 339 | 330 | 67.2 |
| B | 0 | 190 | 13846 | 201.17 | 339 | 330 | 67.2 |
| C | 14 | 238 | 51570 | 664.08 | 324 | 326 | 77.2 |
| C | 0 | 10 | 6437 | 79.19 | 324 | 326 | 77.2 |
| C | 13 | 61 | 2306 | 25.65 | 324 | 326 | 77.2 |
| D | 1 | 52 | 1688274 | 21845.62 | 311 | 302 | 77.3 |
| D | 11 | 176 | 29123 | 373.0 | 311 | 302 | 77.3 |
| D | 12 | 233 | 18745 | 238.69 | 311 | 302 | 77.3 |
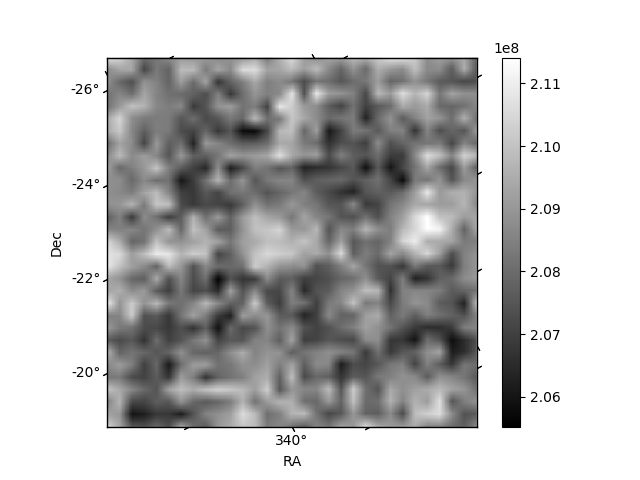
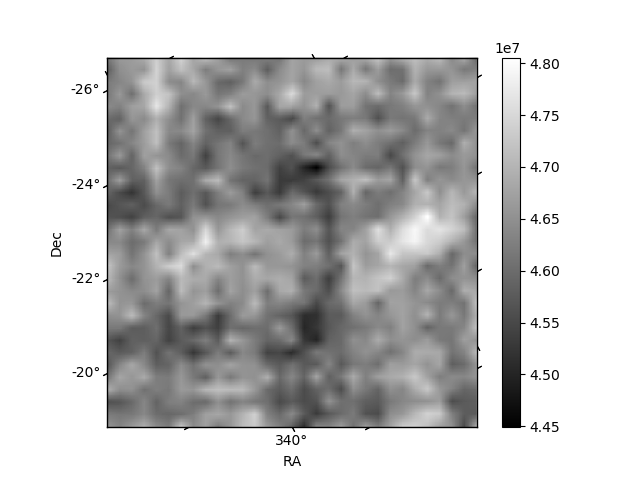
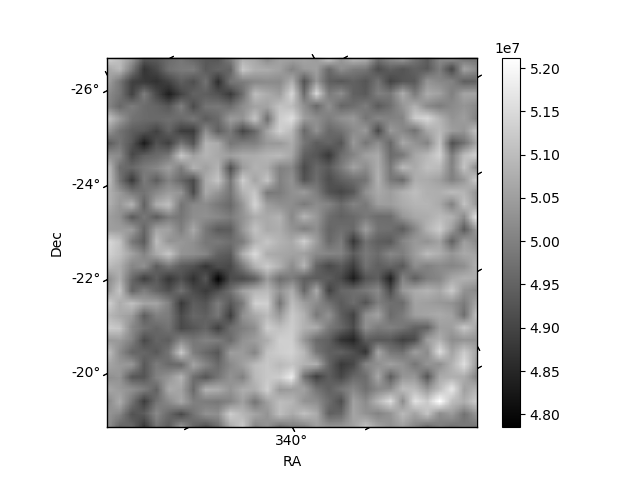
Histogram calculated using DETX and DETY for each event in the final _common_clean file
| Quadrant A | 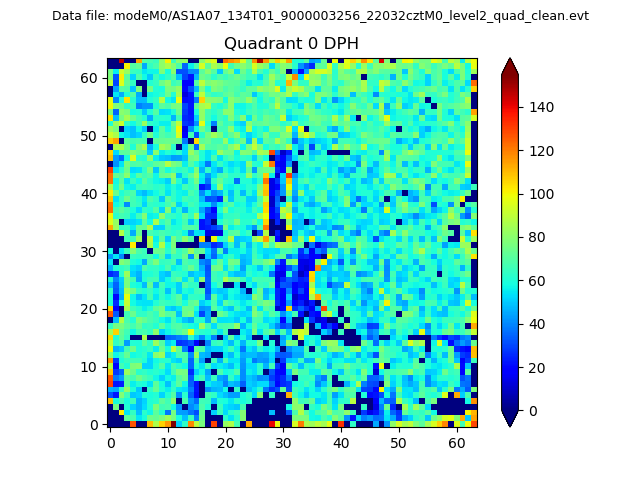 |
 |
Quadrant B |
|---|---|---|---|
| Quadrant D | 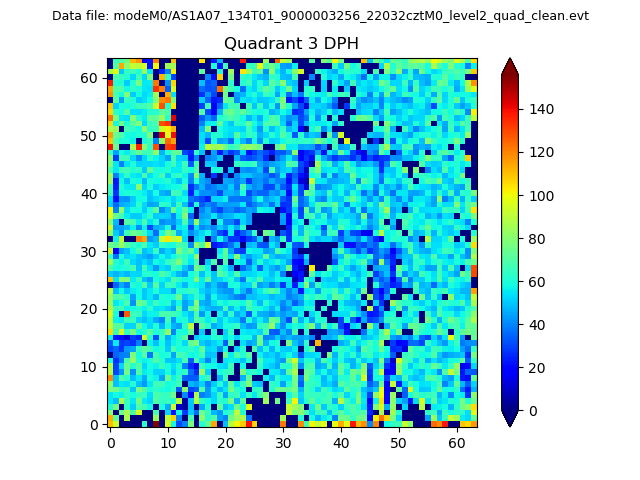 |
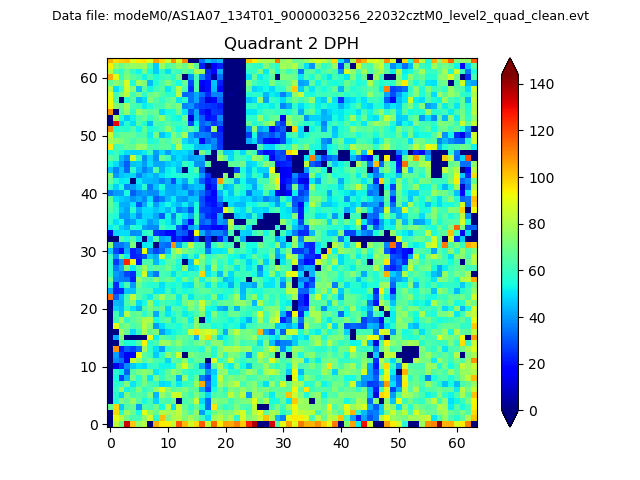 |
Quadrant C |
| Plot type | Count rate plots | Images |
|---|---|---|
| Comparison with Poisson distribution Blue bars denote a histogram of data divided into 1 sec bins. Red curve is a Poisson curve with rate = median count rate of data. |
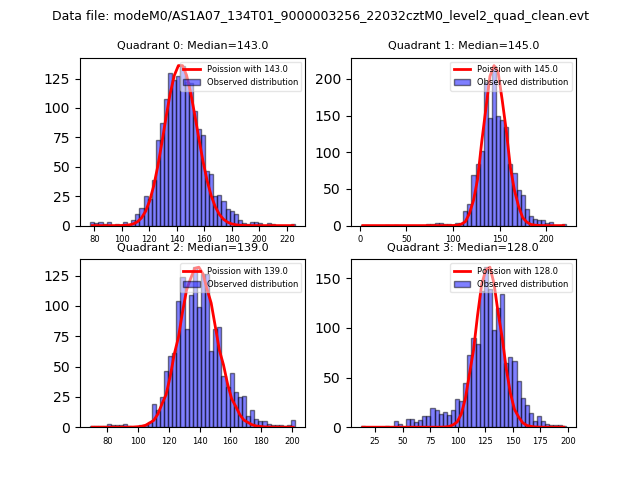 |
 |
| Quadrant-wise count rates Data is divided into 100 sec bins |
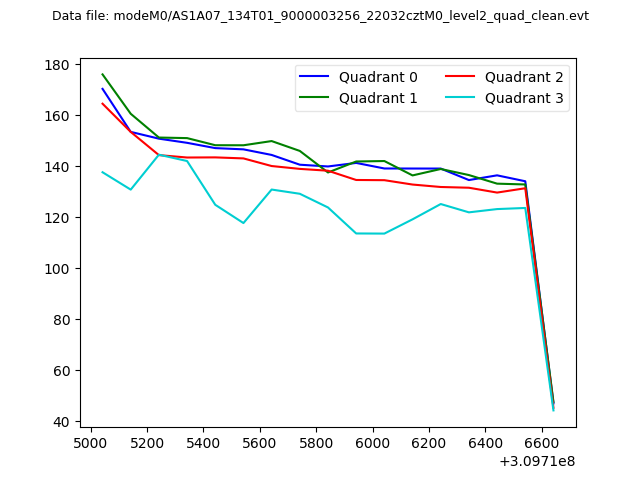 |
|
| Module-wise count rates for Quadrant A Data is divided into 100 sec bins |
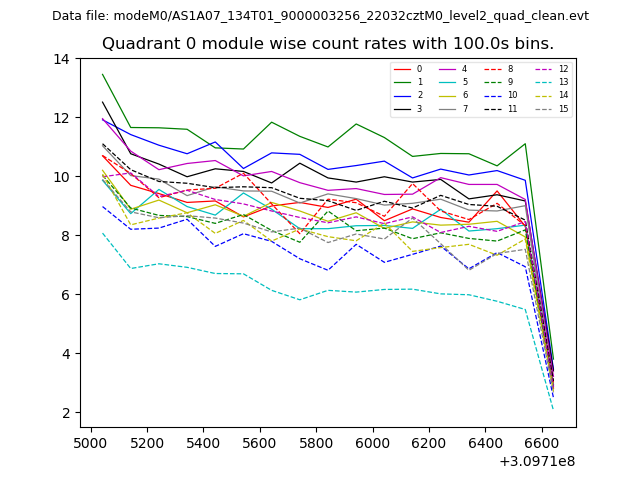 |
 |
| Module-wise count rates for Quadrant B Data is divided into 100 sec bins |
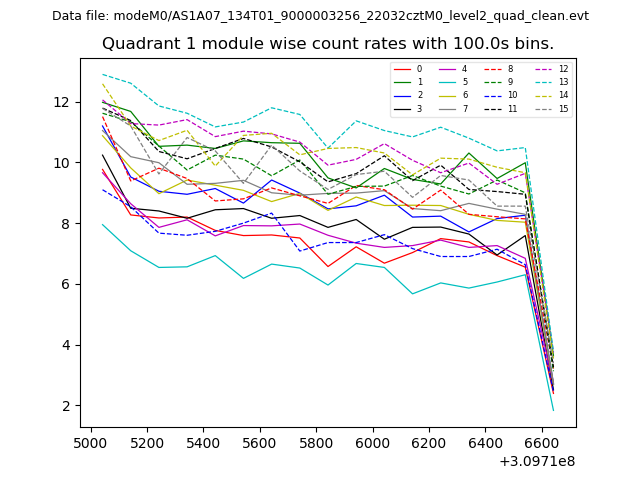 |
 |
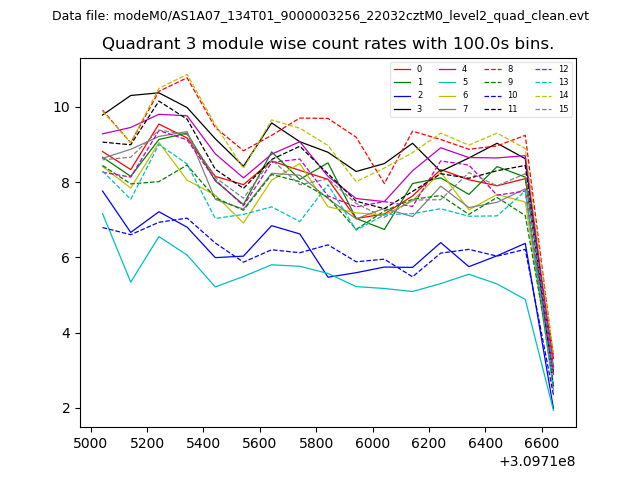
| Module-wise count rates for Quadrant C Data is divided into 100 sec bins |
 |
 |
| Module-wise count rates for Quadrant D Data is divided into 100 sec bins |
 |
 |
| Parameter | Plot |
|---|---|
| CZT HV Monitor | 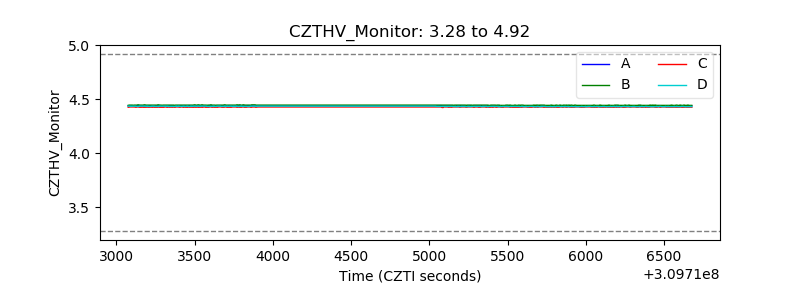 |
| D_VDD | 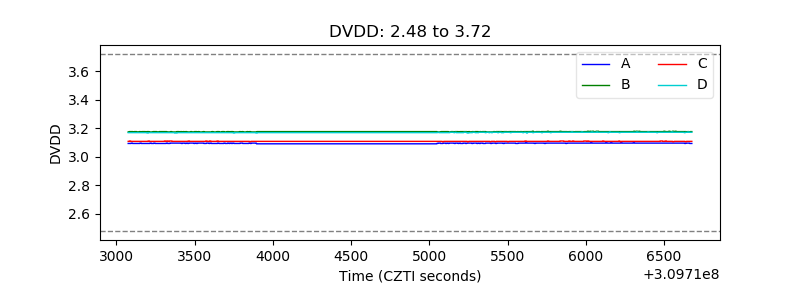 |
| Temperature 1 | 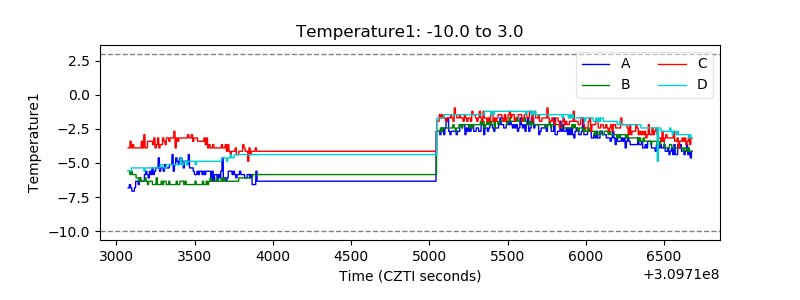 |
| Veto HV Monitor | 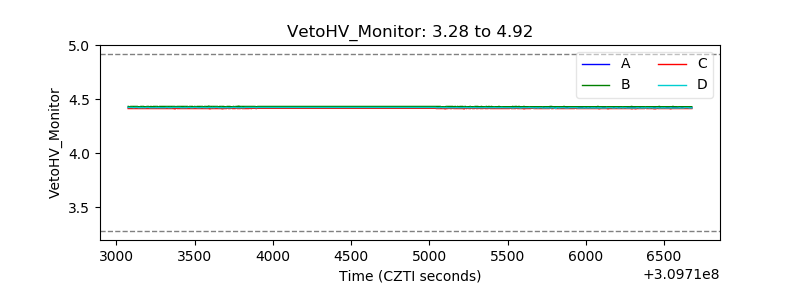 |
| Veto LLD | 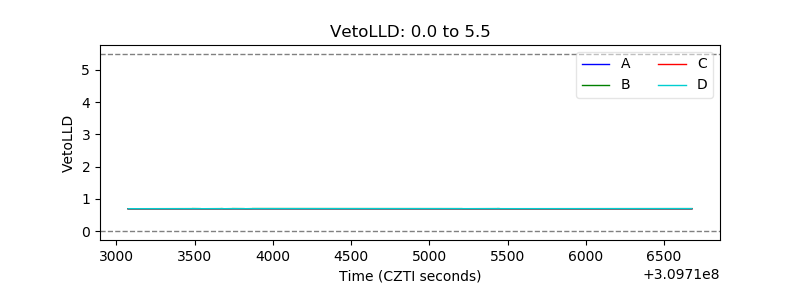 |
| Alpha Counter | 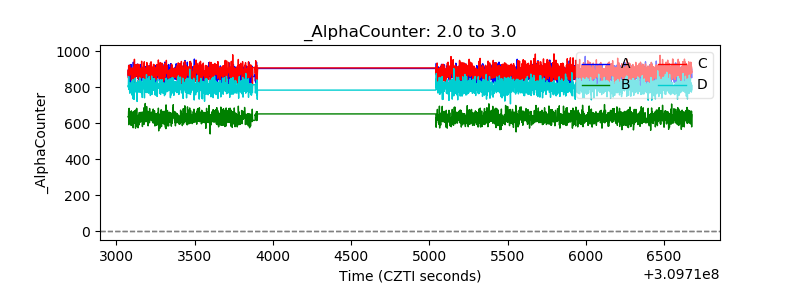 |
| _CPM_Rate | 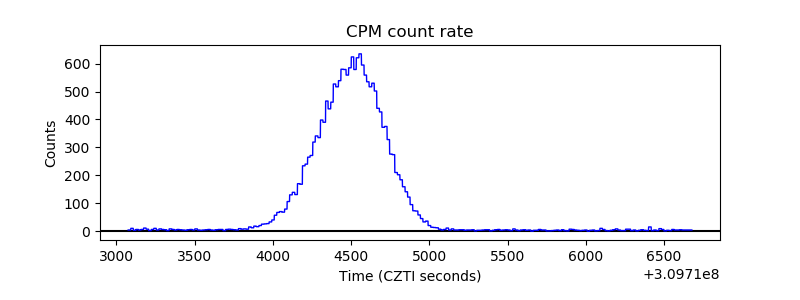 |
| CZT Counter | 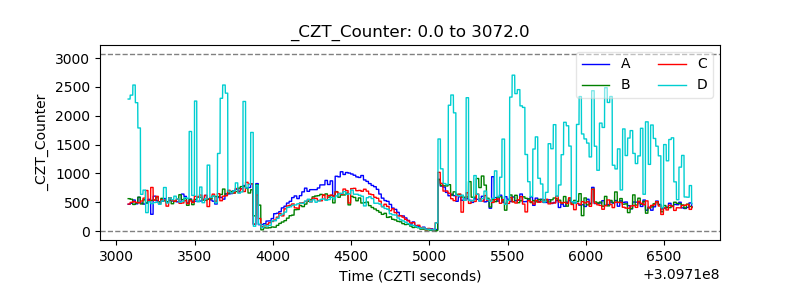 |
| +2.5 Volts monitor | 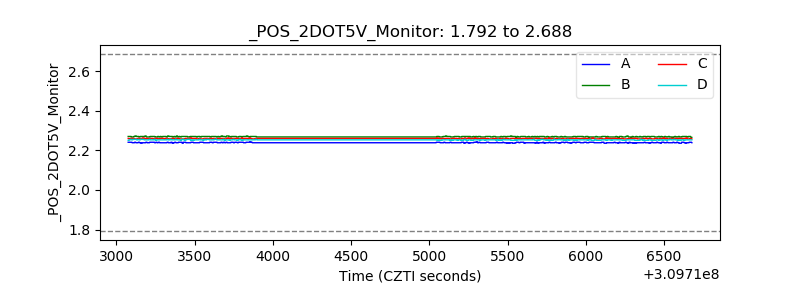 |
| +5 Volts monitor |  |
| _ROLL_ROT | 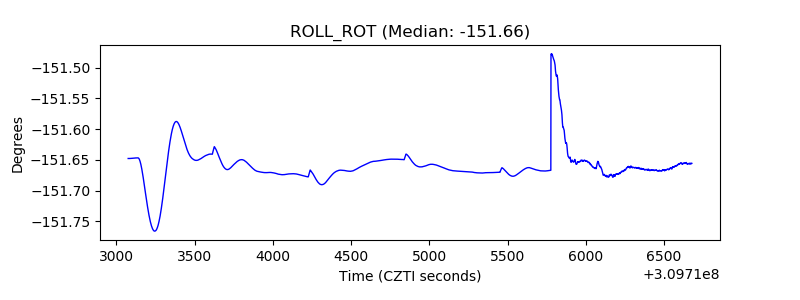 |
| _Roll_DEC |  |
| _Roll_RA | 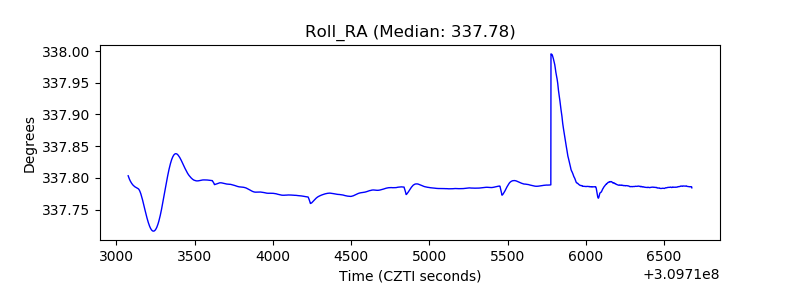 |
| Veto Counter | 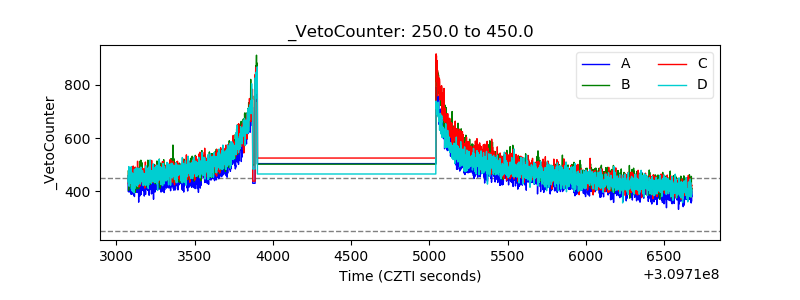 |