| Param | Original file | Final file |
|---|---|---|
| Filename | modeM0/AS1A07_134T01_9000003256_22033cztM0_level2.evt | modeM0/AS1A07_134T01_9000003256_22033cztM0_level2_quad_clean.evt |
| Size (bytes) | 596,623,680 | 90,915,840 |
| Size | 569.0 MB | 86.7 MB |
| Events in quadrant A | 3,212,415 | 592,879 |
| Events in quadrant B | 3,489,309 | 595,181 |
| Events in quadrant C | 3,200,628 | 569,883 |
| Events in quadrant D | 7,717,722 | 532,927 |
| Mode M9 | |||
|---|---|---|---|
| Quadrant | BADHDUFLAG | Total packets | Discarded packets |
| A | 0 | 8 | 0 |
| B | 0 | 8 | 0 |
| C | 0 | 8 | 0 |
| D | 0 | 8 | 0 |
| Mode SS | |||
|---|---|---|---|
| Quadrant | BADHDUFLAG | Total packets | Discarded packets |
| A | 0 | 136 | 0 |
| B | 0 | 136 | 0 |
| C | 0 | 136 | 0 |
| D | 0 | 136 | 0 |
| Mode M0 | |||
|---|---|---|---|
| Quadrant | BADHDUFLAG | Total packets | Discarded packets |
| A | 0 | 13791 | 1 |
| B | 0 | 14555 | 1 |
| C | 0 | 13833 | 2 |
| D | 0 | 27519 | 1 |
| Quadrant | Total seconds | Saturated seconds | Saturation percentage |
|---|---|---|---|
| A | 6623 | 96 | 1.449494% |
| B | 6624 | 142 | 2.143720% |
| C | 6623 | 133 | 2.008153% |
| D | 6623 | 817 | 12.335799% |
Noise dominated data is calculated using 1-second bins in cleaned event files. If a bin has >2000 counts, and if more than 50% of those come from <1% of pixels, then it is considered to be noise-dominated and hence unusable.
| Quadrant | # 1 sec bins | Bins with >0 counts | Bins with >2000 counts | High rate bins dominated by noise | Noise dominated (total time) | Noise dominated (detector-on time) | Marked lightcurve |
|---|---|---|---|---|---|---|---|
| A | 7408 | 6623 | 0 | 0 | 0.00% | 0.00% |  |
| B | 7409 | 6624 | 25 | 25 | 0.34% | 0.38% | 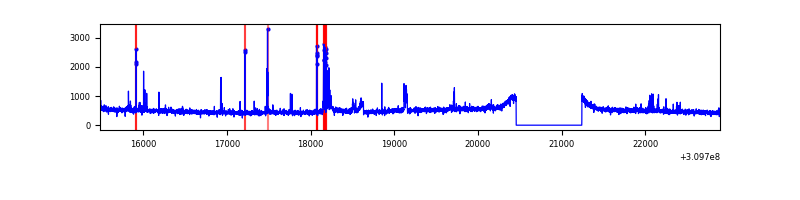 |
| C | 7408 | 6623 | 0 | 0 | 0.00% | 0.00% | 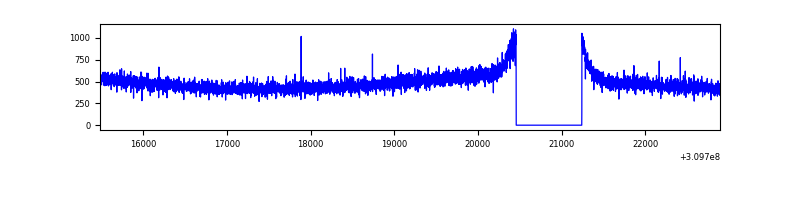 |
| D | 7408 | 6623 | 951 | 951 | 12.84% | 14.36% | 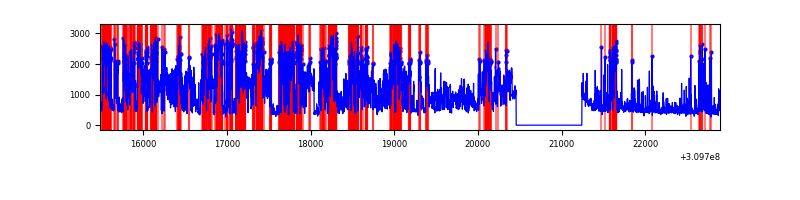 |
Top three noisy pixels from each quadrant. If the there are fewer than three noisy pixels in the level2.evt file, extra rows are filled as -1
| Pixel properties | Quadrant properties | ||||||
|---|---|---|---|---|---|---|---|
| Quadrant | DetID | PixID | Counts | Sigma | Mean | Median | Sigma |
| A | 13 | 254 | 11084 | 61.45 | 832 | 816 | 167.1 |
| A | 0 | 226 | 7035 | 37.22 | 832 | 816 | 167.1 |
| A | 3 | 137 | 7029 | 37.18 | 832 | 816 | 167.1 |
| B | 3 | 64 | 167535 | 1044.68 | 824 | 805 | 159.6 |
| B | 0 | 230 | 36442 | 223.29 | 824 | 805 | 159.6 |
| B | 0 | 190 | 34723 | 212.52 | 824 | 805 | 159.6 |
| C | 14 | 238 | 123985 | 662.19 | 789 | 793 | 186.0 |
| C | 13 | 61 | 5508 | 25.34 | 789 | 793 | 186.0 |
| C | 8 | 208 | 2494 | 9.14 | 789 | 793 | 186.0 |
| D | 1 | 52 | 4459489 | 23623.56 | 780 | 760 | 188.7 |
| D | 12 | 233 | 125476 | 660.78 | 780 | 760 | 188.7 |
| D | 11 | 176 | 66417 | 347.87 | 780 | 760 | 188.7 |
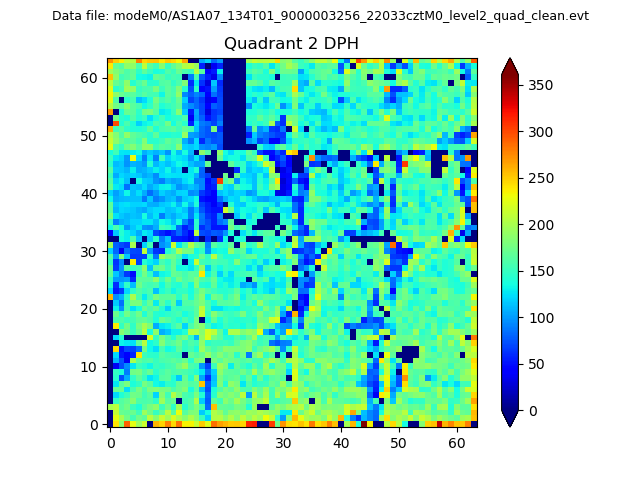
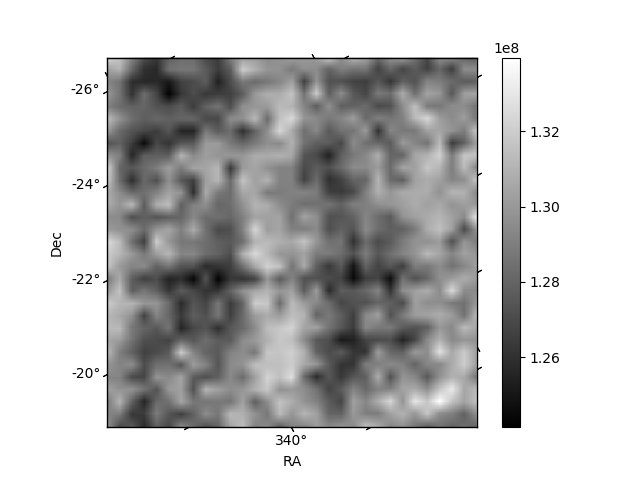
Histogram calculated using DETX and DETY for each event in the final _common_clean file
| Quadrant A | 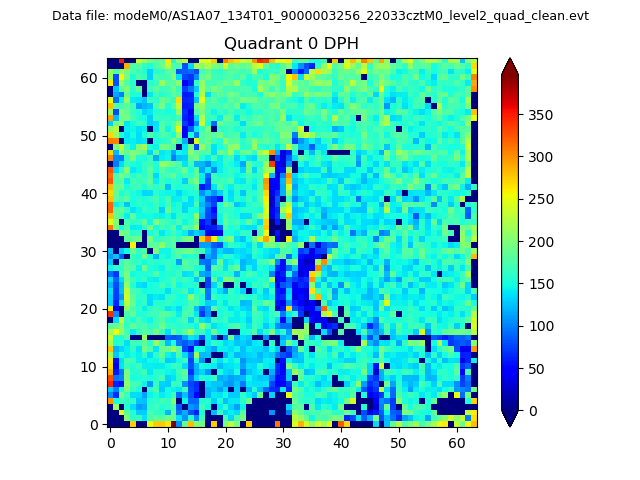 |
 |
Quadrant B |
|---|---|---|---|
| Quadrant D | 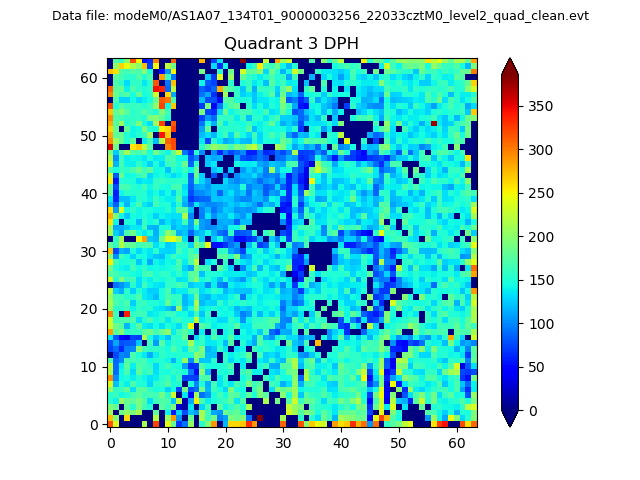 |
 |
Quadrant C |
| Plot type | Count rate plots | Images |
|---|---|---|
| Comparison with Poisson distribution Blue bars denote a histogram of data divided into 1 sec bins. Red curve is a Poisson curve with rate = median count rate of data. |
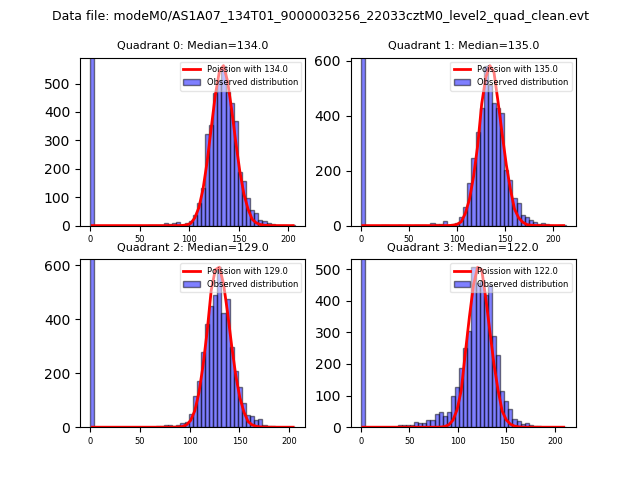 |
 |
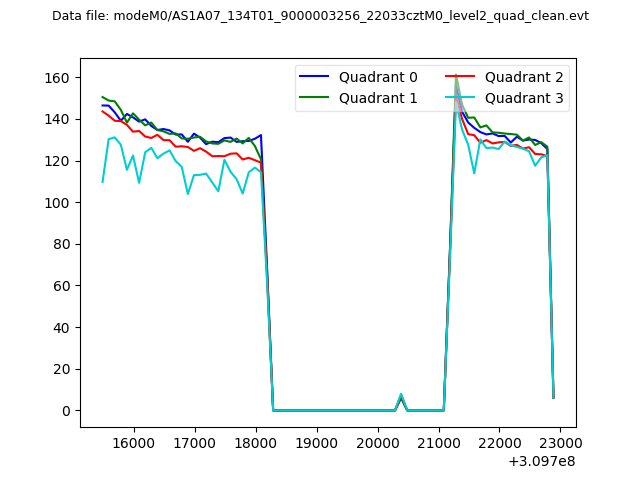
| Quadrant-wise count rates Data is divided into 100 sec bins |
 |
|
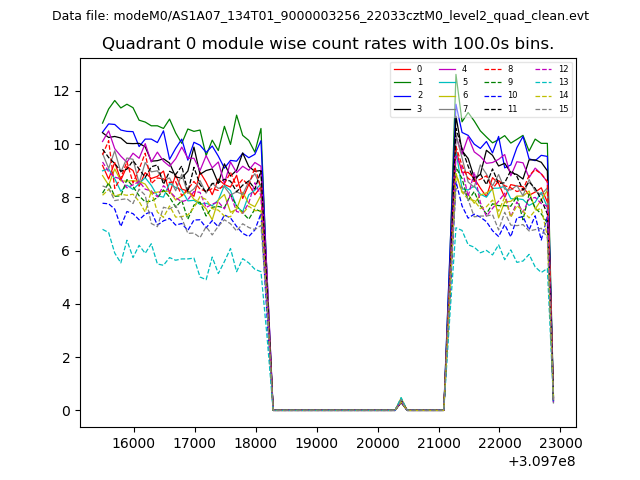
| Module-wise count rates for Quadrant A Data is divided into 100 sec bins |
 |
 |
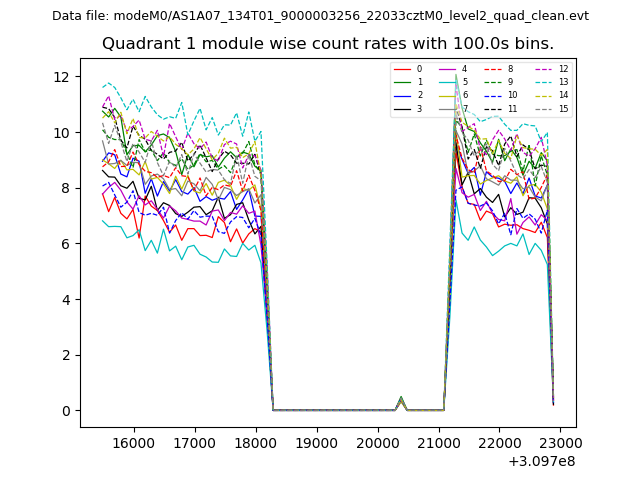
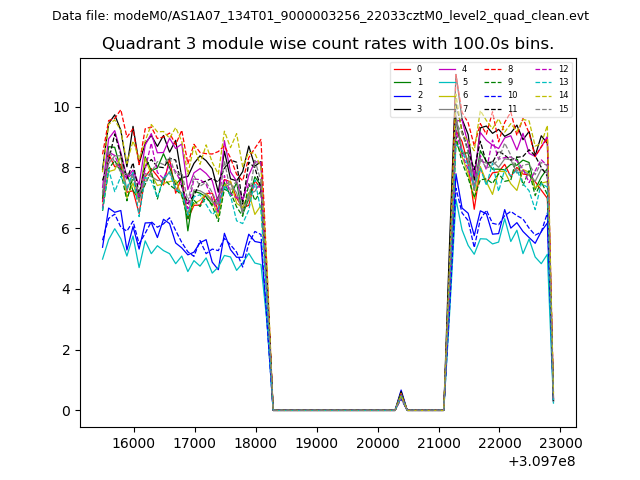
| Module-wise count rates for Quadrant B Data is divided into 100 sec bins |
 |
 |
| Module-wise count rates for Quadrant C Data is divided into 100 sec bins |
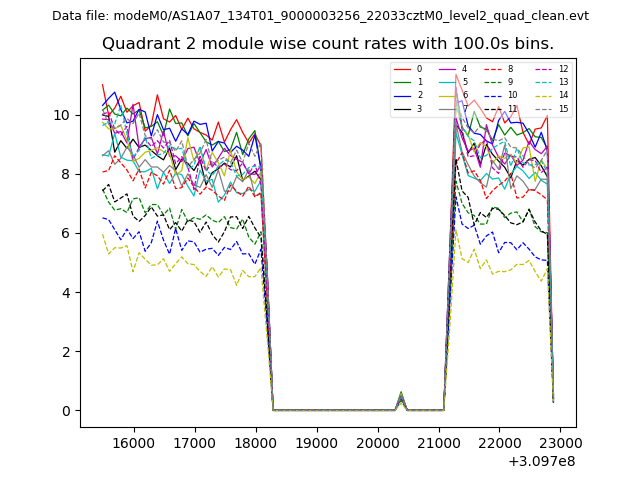 |
 |
| Module-wise count rates for Quadrant D Data is divided into 100 sec bins |
 |
 |
| Parameter | Plot |
|---|---|
| CZT HV Monitor | 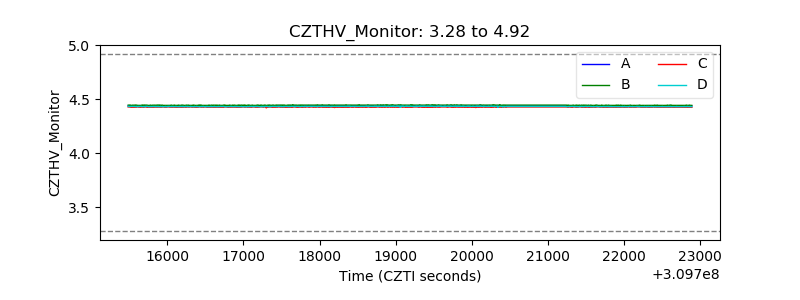 |
| D_VDD | 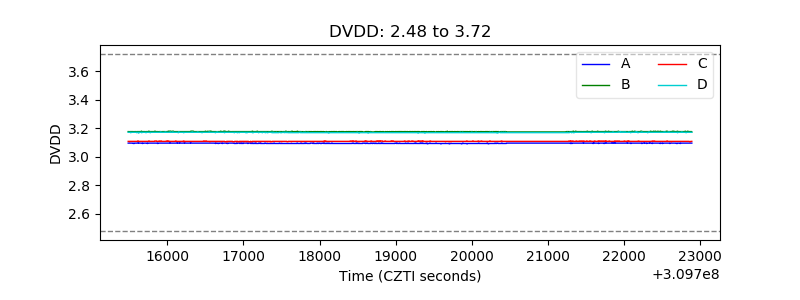 |
| Temperature 1 | 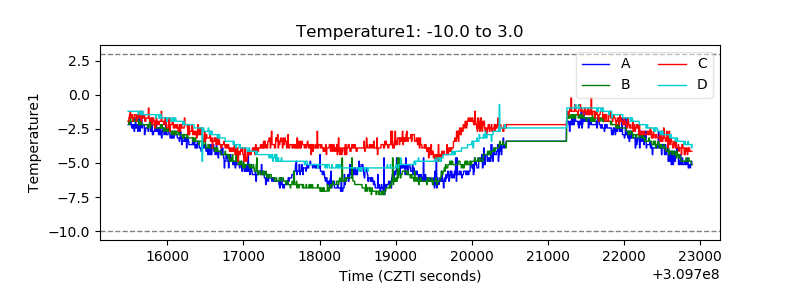 |
| Veto HV Monitor | 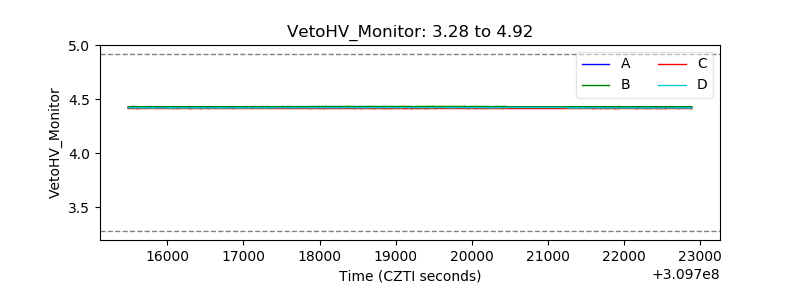 |
| Veto LLD | 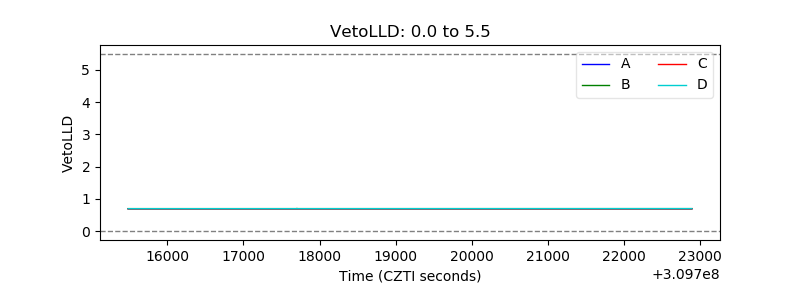 |
| Alpha Counter | 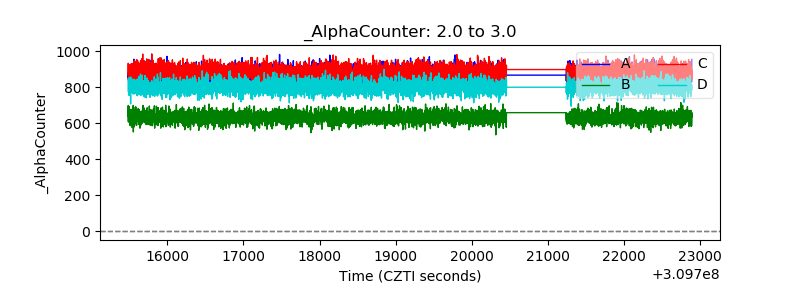 |
| _CPM_Rate | 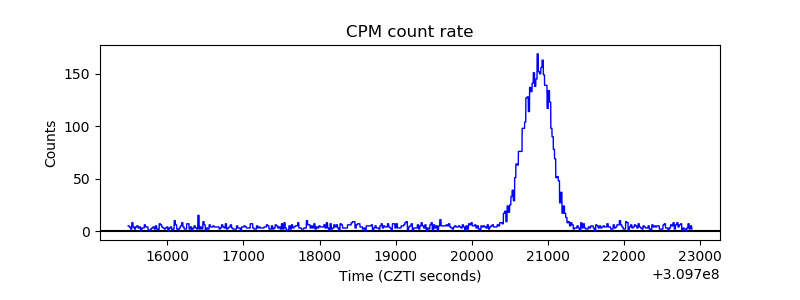 |
| CZT Counter | 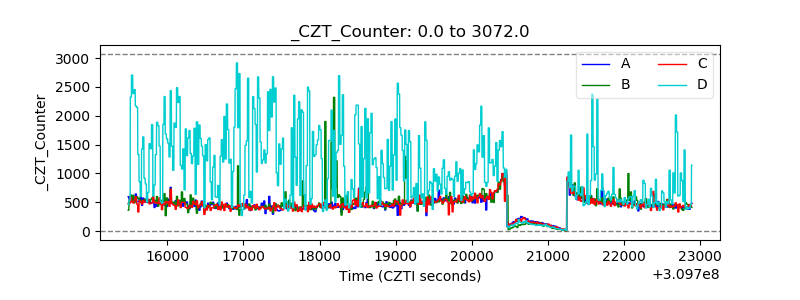 |
| +2.5 Volts monitor |  |
| +5 Volts monitor |  |
| _ROLL_ROT | 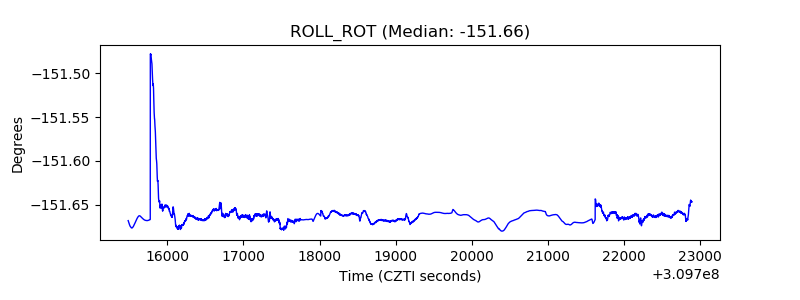 |
| _Roll_DEC | 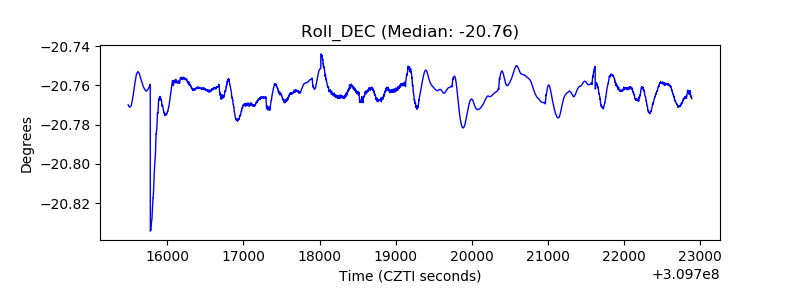 |
| _Roll_RA | 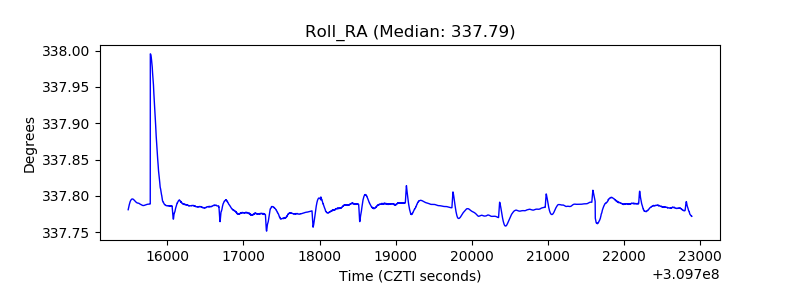 |
| Veto Counter | 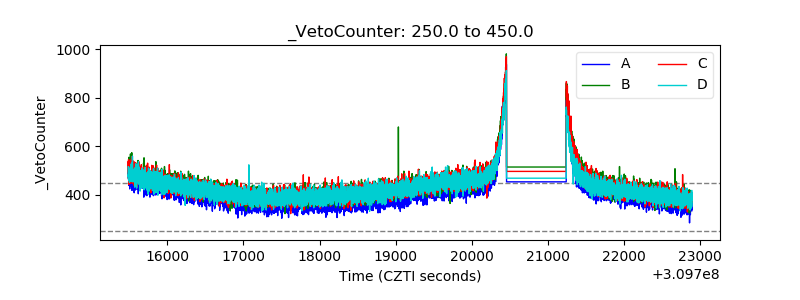 |