| Param | Original file | Final file |
|---|---|---|
| Filename | modeM0/AS1A07_134T01_9000003256_22034cztM0_level2.evt | modeM0/AS1A07_134T01_9000003256_22034cztM0_level2_quad_clean.evt |
| Size (bytes) | 509,310,720 | 105,117,120 |
| Size | 485.7 MB | 100.2 MB |
| Events in quadrant A | 3,546,007 | 678,966 |
| Events in quadrant B | 3,679,386 | 687,568 |
| Events in quadrant C | 3,532,483 | 657,568 |
| Events in quadrant D | 4,165,640 | 645,869 |
| Mode M9 | |||
|---|---|---|---|
| Quadrant | BADHDUFLAG | Total packets | Discarded packets |
| A | 0 | 8 | 0 |
| B | 0 | 9 | 0 |
| C | 0 | 9 | 0 |
| D | 0 | 9 | 0 |
| Mode SS | |||
|---|---|---|---|
| Quadrant | BADHDUFLAG | Total packets | Discarded packets |
| A | 0 | 150 | 0 |
| B | 0 | 150 | 0 |
| C | 0 | 150 | 0 |
| D | 0 | 150 | 0 |
| Mode M0 | |||
|---|---|---|---|
| Quadrant | BADHDUFLAG | Total packets | Discarded packets |
| A | 0 | 15333 | 2 |
| B | 0 | 15674 | 2 |
| C | 0 | 15316 | 2 |
| D | 0 | 17388 | 2 |
| Quadrant | Total seconds | Saturated seconds | Saturation percentage |
|---|---|---|---|
| A | 7376 | 41 | 0.555857% |
| B | 7376 | 63 | 0.854121% |
| C | 7376 | 72 | 0.976139% |
| D | 7376 | 134 | 1.816703% |
Noise dominated data is calculated using 1-second bins in cleaned event files. If a bin has >2000 counts, and if more than 50% of those come from <1% of pixels, then it is considered to be noise-dominated and hence unusable.
| Quadrant | # 1 sec bins | Bins with >0 counts | Bins with >2000 counts | High rate bins dominated by noise | Noise dominated (total time) | Noise dominated (detector-on time) | Marked lightcurve |
|---|---|---|---|---|---|---|---|
| A | 7811 | 7377 | 0 | 0 | 0.00% | 0.00% | 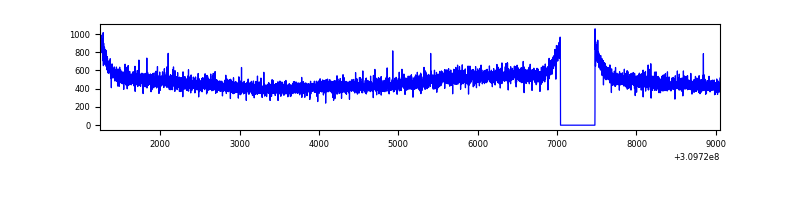 |
| B | 7811 | 7377 | 1 | 1 | 0.01% | 0.01% | 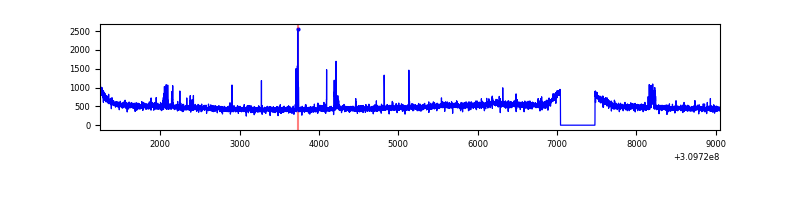 |
| C | 7811 | 7377 | 0 | 0 | 0.00% | 0.00% | 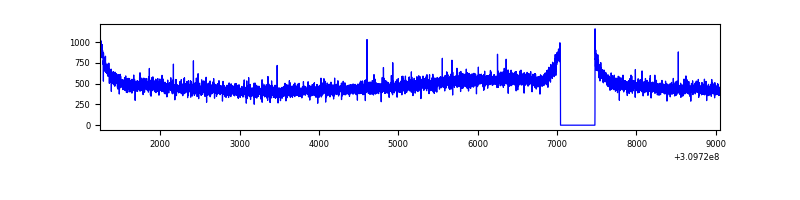 |
| D | 7811 | 7377 | 89 | 89 | 1.14% | 1.21% | 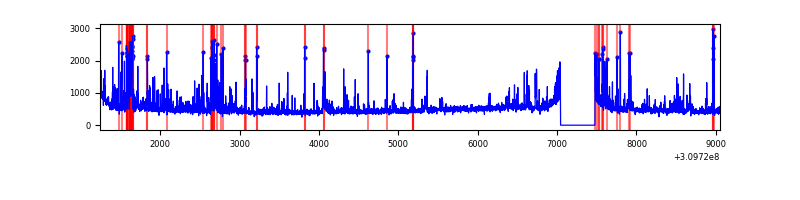 |
Top three noisy pixels from each quadrant. If the there are fewer than three noisy pixels in the level2.evt file, extra rows are filled as -1
| Pixel properties | Quadrant properties | ||||||
|---|---|---|---|---|---|---|---|
| Quadrant | DetID | PixID | Counts | Sigma | Mean | Median | Sigma |
| A | 13 | 254 | 12243 | 61.57 | 917 | 898 | 184.3 |
| A | 3 | 137 | 7835 | 37.65 | 917 | 898 | 184.3 |
| A | 0 | 226 | 7811 | 37.52 | 917 | 898 | 184.3 |
| B | 0 | 190 | 44651 | 250.14 | 911 | 887 | 175.0 |
| B | 3 | 64 | 25756 | 142.14 | 911 | 887 | 175.0 |
| B | 0 | 230 | 25499 | 140.67 | 911 | 887 | 175.0 |
| C | 14 | 238 | 136948 | 660.56 | 871 | 873 | 206.0 |
| C | 13 | 61 | 6035 | 25.06 | 871 | 873 | 206.0 |
| C | 0 | 10 | 2840 | 9.55 | 871 | 873 | 206.0 |
| D | 1 | 52 | 395381 | 1838.71 | 882 | 857 | 214.6 |
| D | 11 | 176 | 167887 | 778.46 | 882 | 857 | 214.6 |
| D | 12 | 233 | 164387 | 762.15 | 882 | 857 | 214.6 |
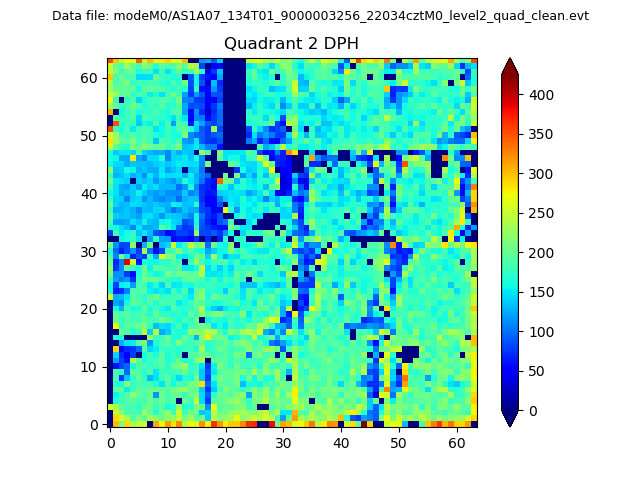
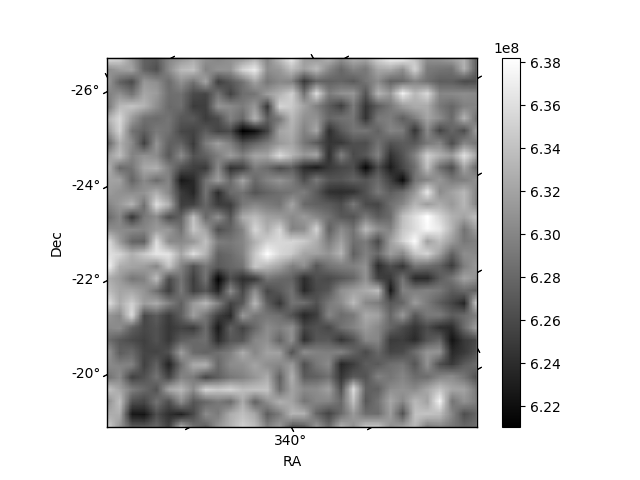
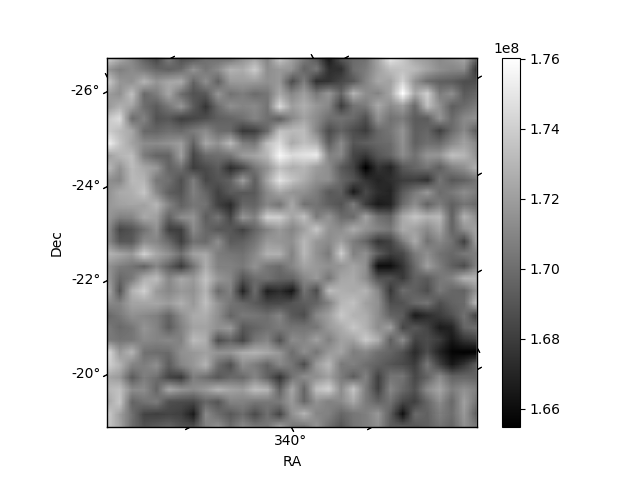
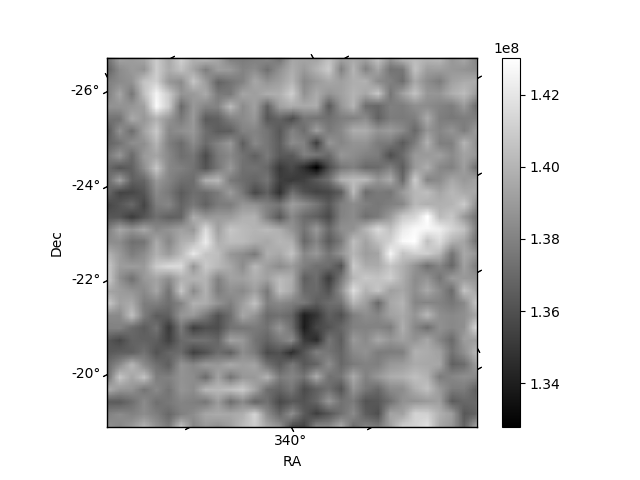
Histogram calculated using DETX and DETY for each event in the final _common_clean file
| Quadrant A | 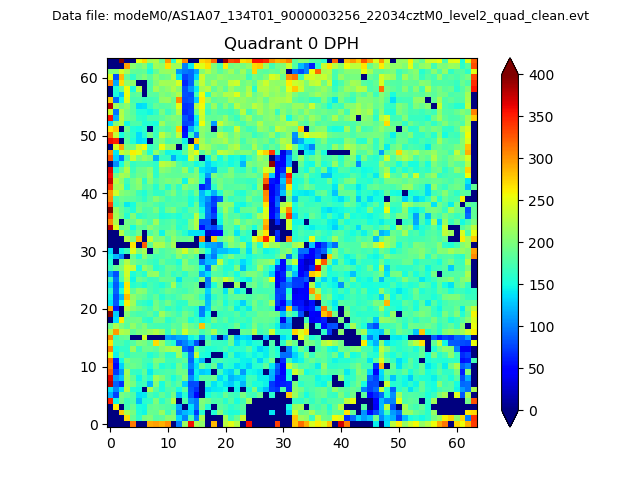 |
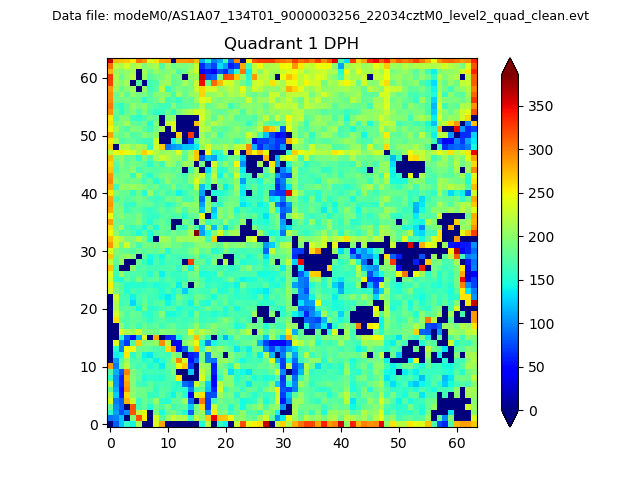 |
Quadrant B |
|---|---|---|---|
| Quadrant D | 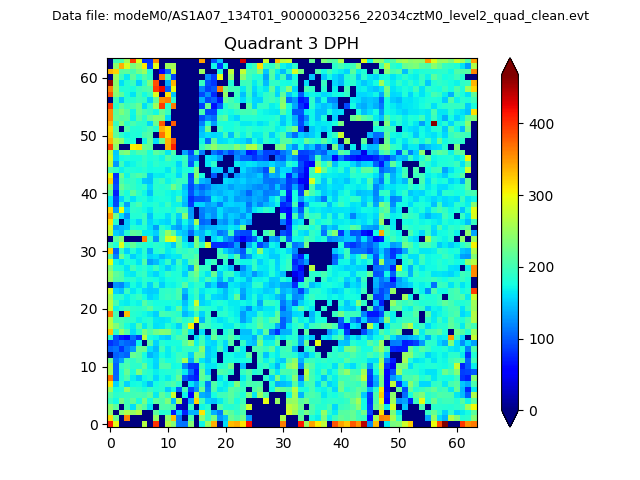 |
 |
Quadrant C |
| Plot type | Count rate plots | Images |
|---|---|---|
| Comparison with Poisson distribution Blue bars denote a histogram of data divided into 1 sec bins. Red curve is a Poisson curve with rate = median count rate of data. |
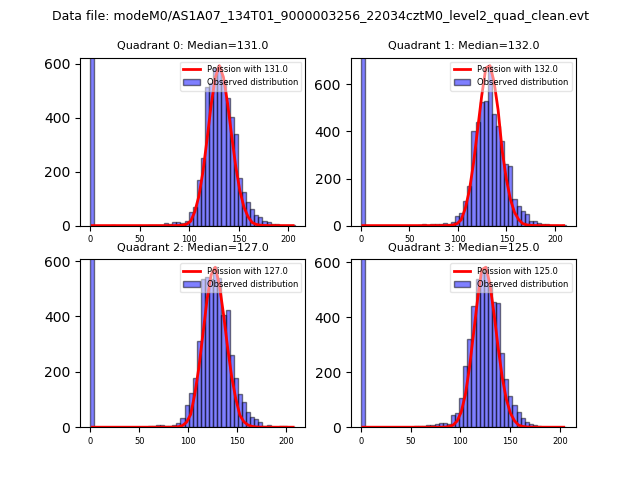 |
 |
| Quadrant-wise count rates Data is divided into 100 sec bins |
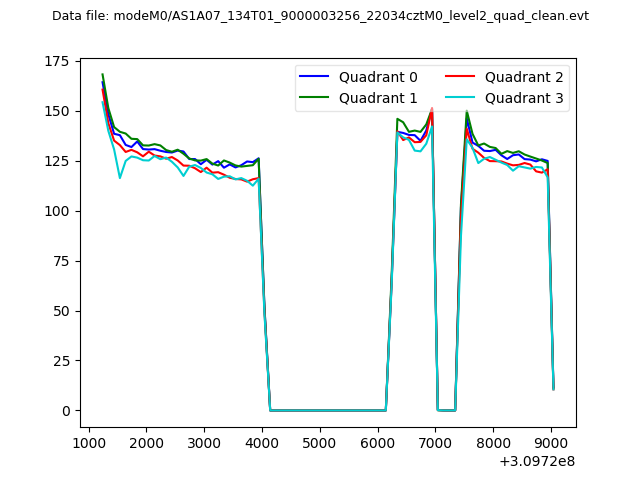 |
|
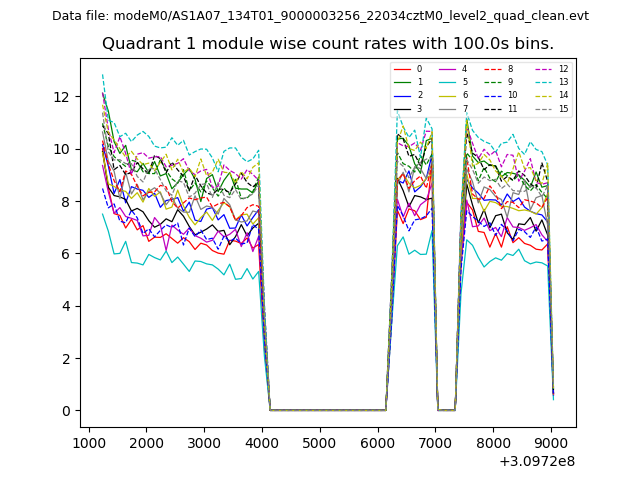
| Module-wise count rates for Quadrant A Data is divided into 100 sec bins |
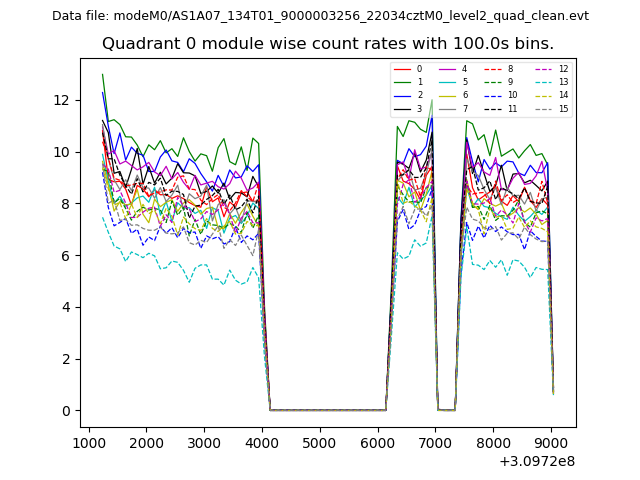 |
 |
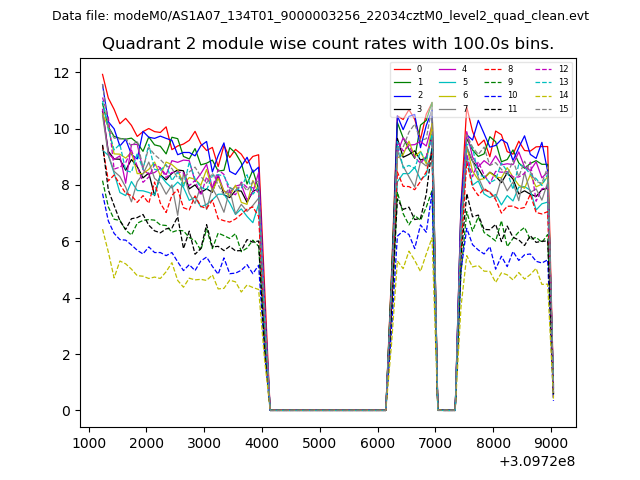
| Module-wise count rates for Quadrant B Data is divided into 100 sec bins |
 |
 |
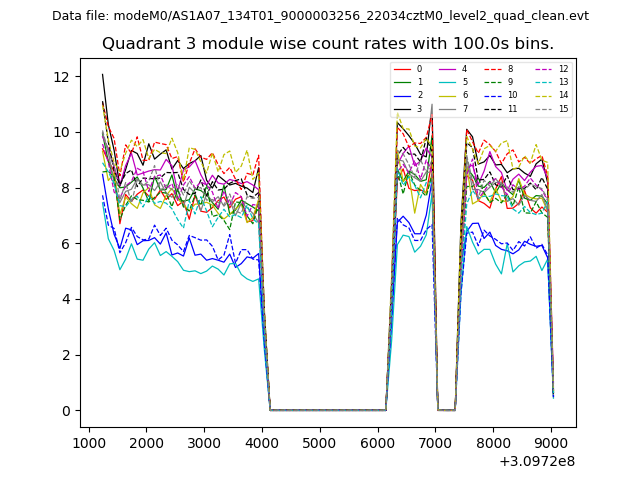
| Module-wise count rates for Quadrant C Data is divided into 100 sec bins |
 |
 |
| Module-wise count rates for Quadrant D Data is divided into 100 sec bins |
 |
 |
| Parameter | Plot |
|---|---|
| CZT HV Monitor | 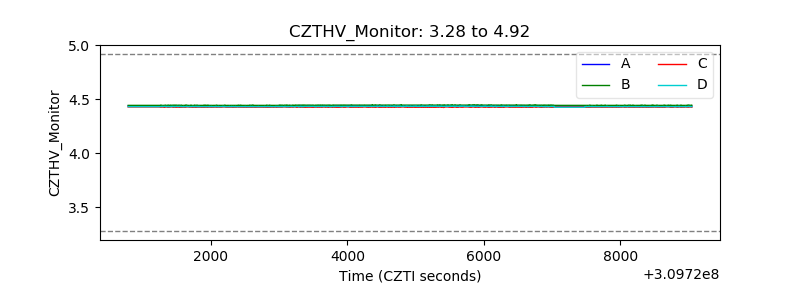 |
| D_VDD |  |
| Temperature 1 | 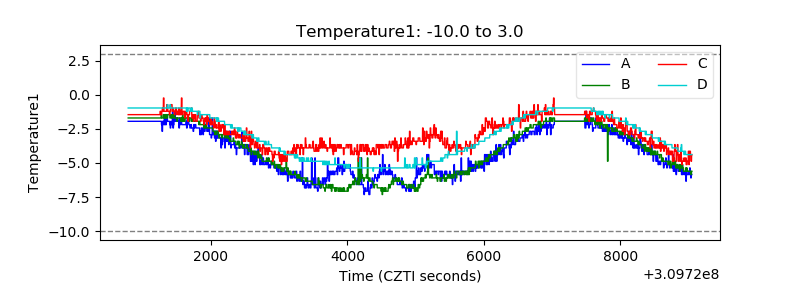 |
| Veto HV Monitor |  |
| Veto LLD | 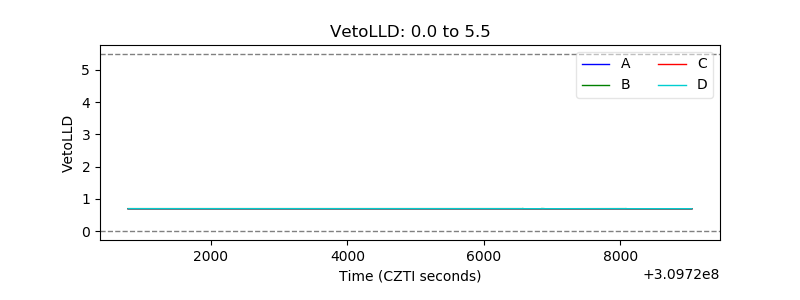 |
| Alpha Counter | 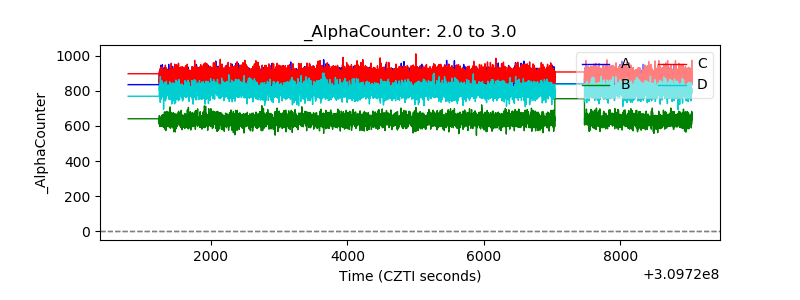 |
| _CPM_Rate | 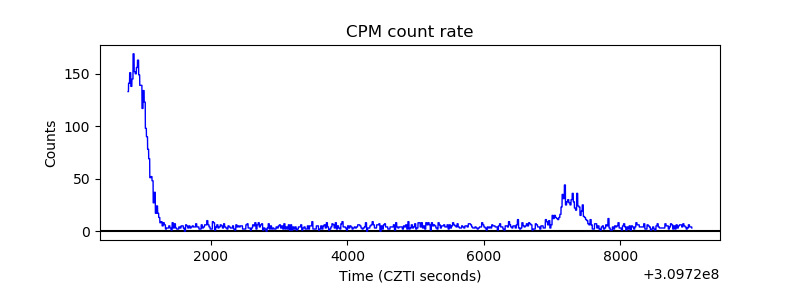 |
| CZT Counter | 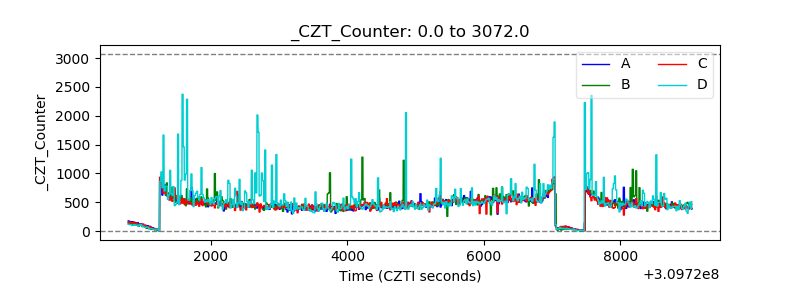 |
| +2.5 Volts monitor |  |
| +5 Volts monitor |  |
| _ROLL_ROT | 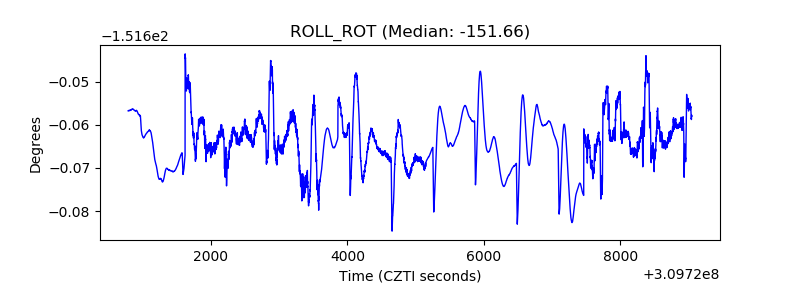 |
| _Roll_DEC | 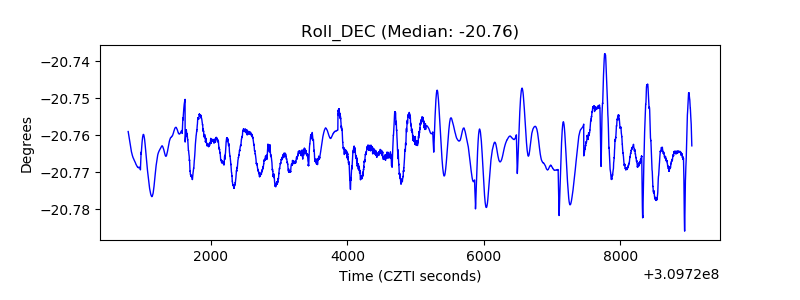 |
| _Roll_RA |  |
| Veto Counter | 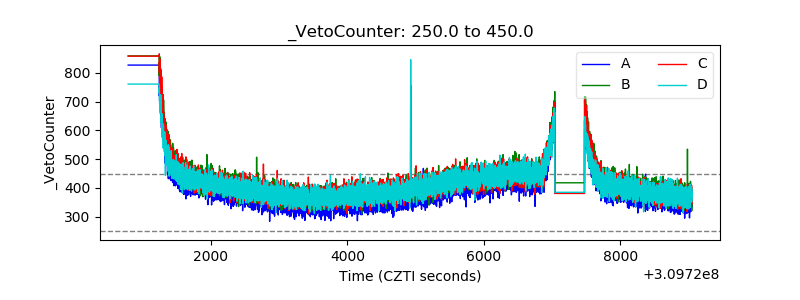 |