| Param | Original file | Final file |
|---|---|---|
| Filename | modeM0/AS1A07_134T01_9000003256_22035cztM0_level2.evt | modeM0/AS1A07_134T01_9000003256_22035cztM0_level2_quad_clean.evt |
| Size (bytes) | 546,016,320 | 108,103,680 |
| Size | 520.7 MB | 103.1 MB |
| Events in quadrant A | 3,646,906 | 704,475 |
| Events in quadrant B | 3,859,765 | 711,259 |
| Events in quadrant C | 3,609,994 | 678,690 |
| Events in quadrant D | 4,900,652 | 647,617 |
| Mode M9 | |||
|---|---|---|---|
| Quadrant | BADHDUFLAG | Total packets | Discarded packets |
| A | 0 | 4 | 0 |
| B | 0 | 5 | 0 |
| C | 0 | 5 | 0 |
| D | 0 | 5 | 0 |
| Mode SS | |||
|---|---|---|---|
| Quadrant | BADHDUFLAG | Total packets | Discarded packets |
| A | 0 | 156 | 0 |
| B | 0 | 156 | 0 |
| C | 0 | 156 | 0 |
| D | 0 | 156 | 0 |
| Mode M0 | |||
|---|---|---|---|
| Quadrant | BADHDUFLAG | Total packets | Discarded packets |
| A | 0 | 15943 | 2 |
| B | 0 | 16434 | 2 |
| C | 0 | 15731 | 2 |
| D | 0 | 19783 | 2 |
| Quadrant | Total seconds | Saturated seconds | Saturation percentage |
|---|---|---|---|
| A | 7641 | 46 | 0.602015% |
| B | 7641 | 94 | 1.230205% |
| C | 7641 | 78 | 1.020809% |
| D | 7641 | 369 | 4.829211% |
Noise dominated data is calculated using 1-second bins in cleaned event files. If a bin has >2000 counts, and if more than 50% of those come from <1% of pixels, then it is considered to be noise-dominated and hence unusable.
| Quadrant | # 1 sec bins | Bins with >0 counts | Bins with >2000 counts | High rate bins dominated by noise | Noise dominated (total time) | Noise dominated (detector-on time) | Marked lightcurve |
|---|---|---|---|---|---|---|---|
| A | 7856 | 7642 | 0 | 0 | 0.00% | 0.00% | 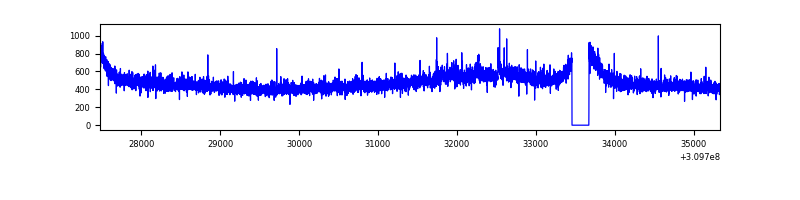 |
| B | 7856 | 7642 | 22 | 22 | 0.28% | 0.29% | 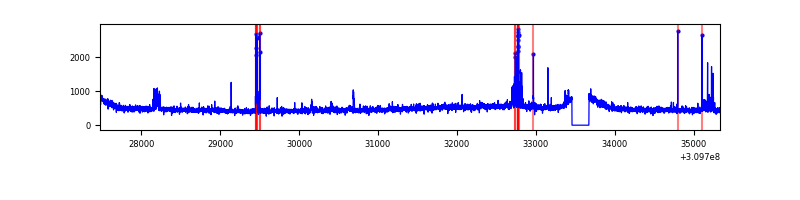 |
| C | 7856 | 7642 | 0 | 0 | 0.00% | 0.00% | 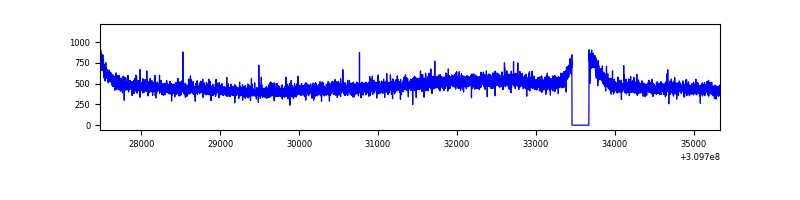 |
| D | 7856 | 7641 | 293 | 293 | 3.73% | 3.83% | 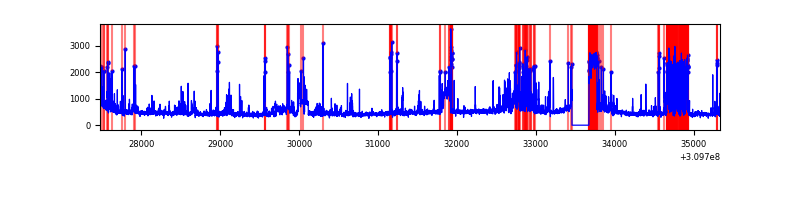 |
Top three noisy pixels from each quadrant. If the there are fewer than three noisy pixels in the level2.evt file, extra rows are filled as -1
| Pixel properties | Quadrant properties | ||||||
|---|---|---|---|---|---|---|---|
| Quadrant | DetID | PixID | Counts | Sigma | Mean | Median | Sigma |
| A | 5 | 16 | 40497 | 209.86 | 934 | 916 | 188.6 |
| A | 13 | 254 | 12873 | 63.4 | 934 | 916 | 188.6 |
| A | 0 | 226 | 8121 | 38.2 | 934 | 916 | 188.6 |
| B | 3 | 64 | 110484 | 608.09 | 929 | 904 | 180.2 |
| B | 0 | 197 | 42919 | 233.15 | 929 | 904 | 180.2 |
| B | 0 | 190 | 31131 | 167.74 | 929 | 904 | 180.2 |
| C | 14 | 238 | 140216 | 666.78 | 887 | 893 | 209.0 |
| C | 13 | 61 | 6198 | 25.39 | 887 | 893 | 209.0 |
| C | 8 | 128 | 4902 | 19.19 | 887 | 893 | 209.0 |
| D | 1 | 52 | 787853 | 3683.03 | 877 | 850 | 213.7 |
| D | 11 | 176 | 529332 | 2473.2 | 877 | 850 | 213.7 |
| D | 5 | 222 | 170673 | 794.74 | 877 | 850 | 213.7 |
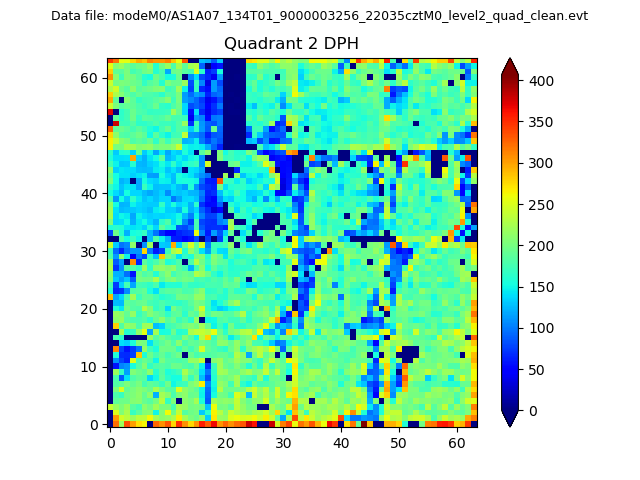
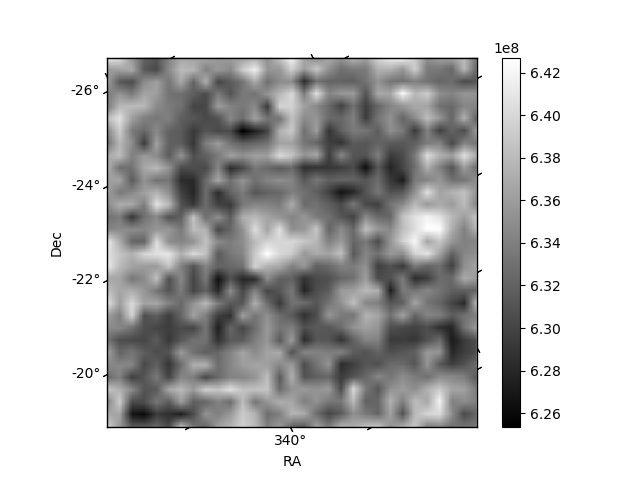
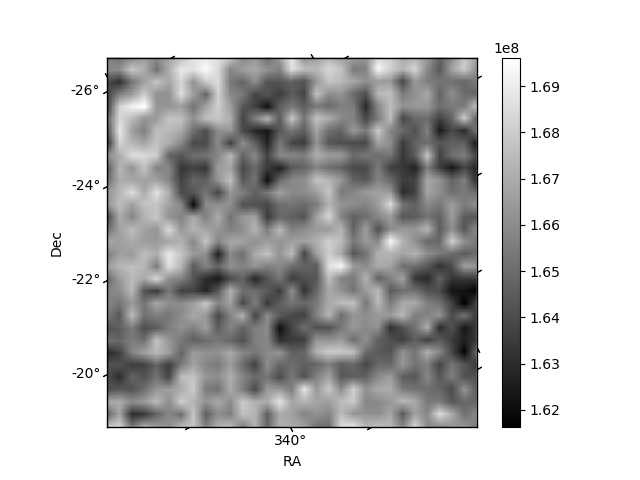
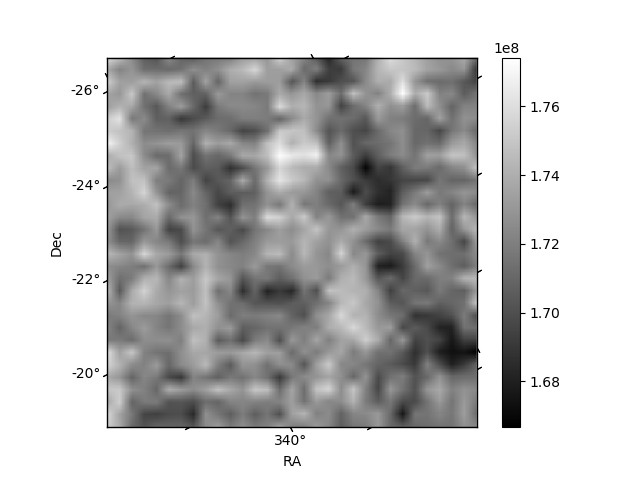
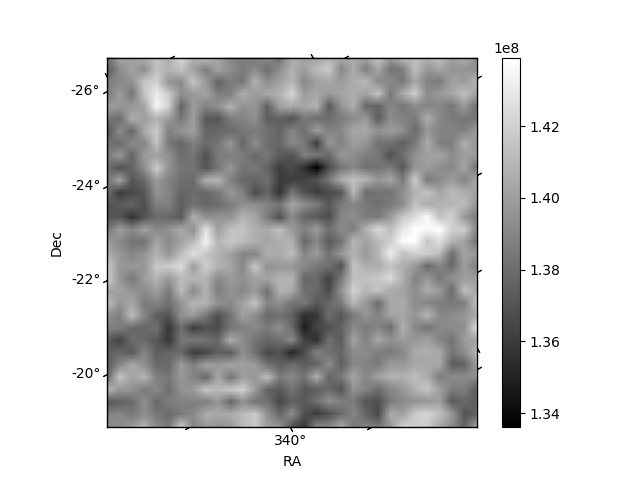
Histogram calculated using DETX and DETY for each event in the final _common_clean file
| Quadrant A | 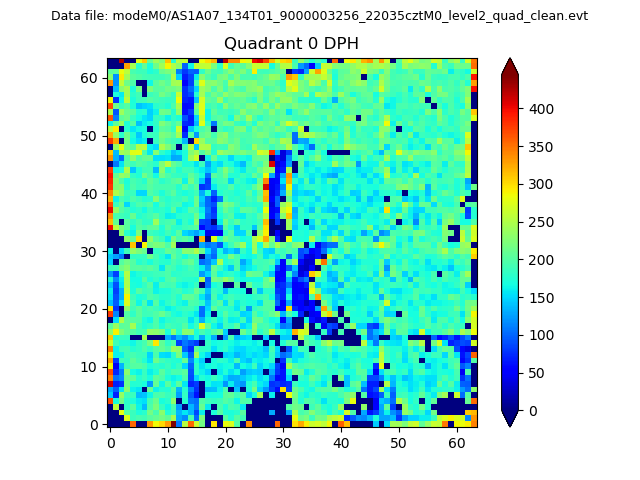 |
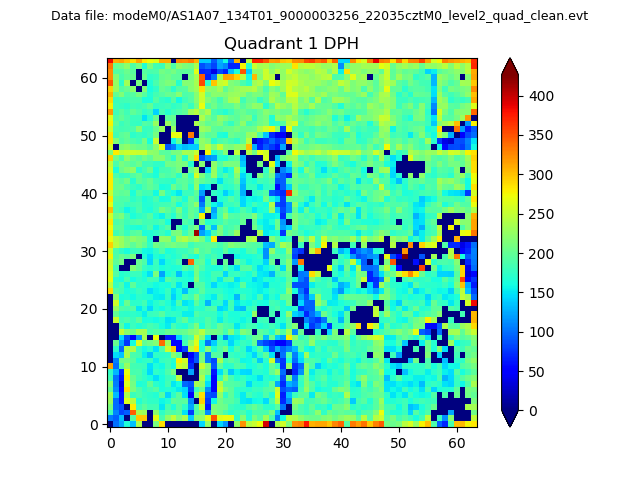 |
Quadrant B |
|---|---|---|---|
| Quadrant D | 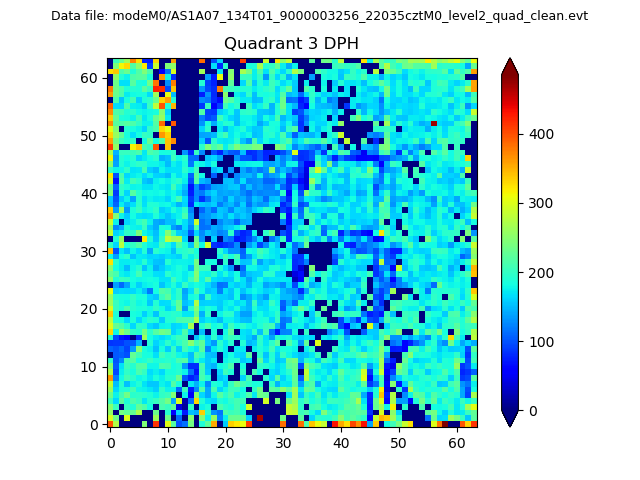 |
 |
Quadrant C |
| Plot type | Count rate plots | Images |
|---|---|---|
| Comparison with Poisson distribution Blue bars denote a histogram of data divided into 1 sec bins. Red curve is a Poisson curve with rate = median count rate of data. |
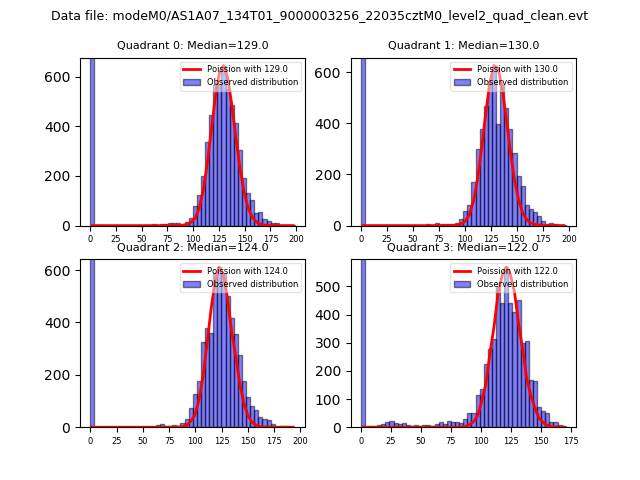 |
 |
| Quadrant-wise count rates Data is divided into 100 sec bins |
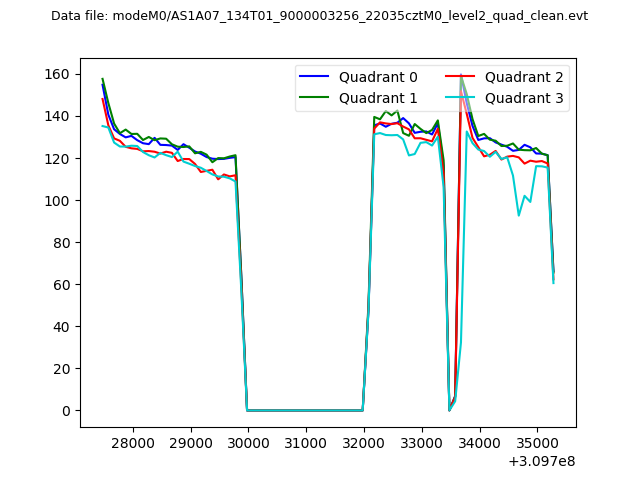 |
|
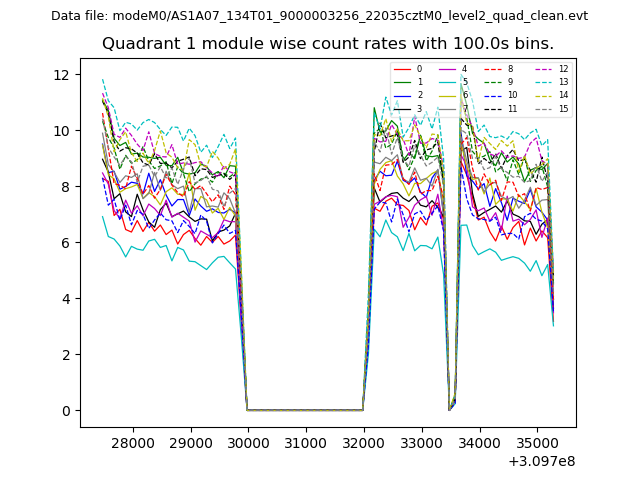
| Module-wise count rates for Quadrant A Data is divided into 100 sec bins |
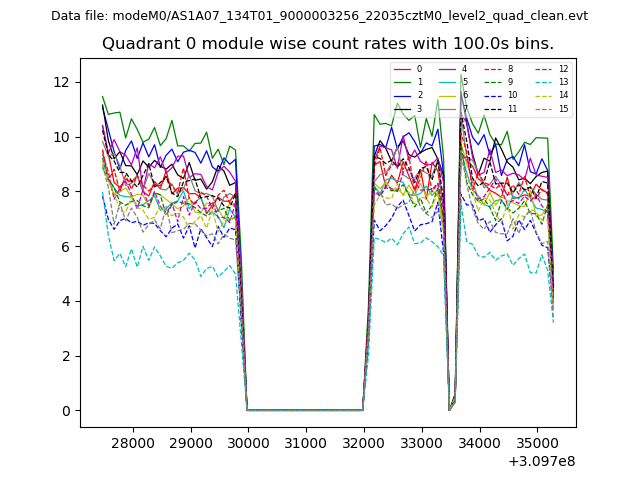 |
 |
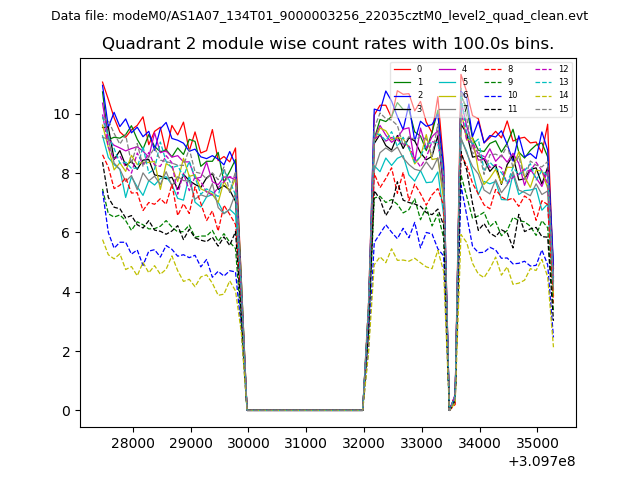
| Module-wise count rates for Quadrant B Data is divided into 100 sec bins |
 |
 |
| Module-wise count rates for Quadrant C Data is divided into 100 sec bins |
 |
 |
| Module-wise count rates for Quadrant D Data is divided into 100 sec bins |
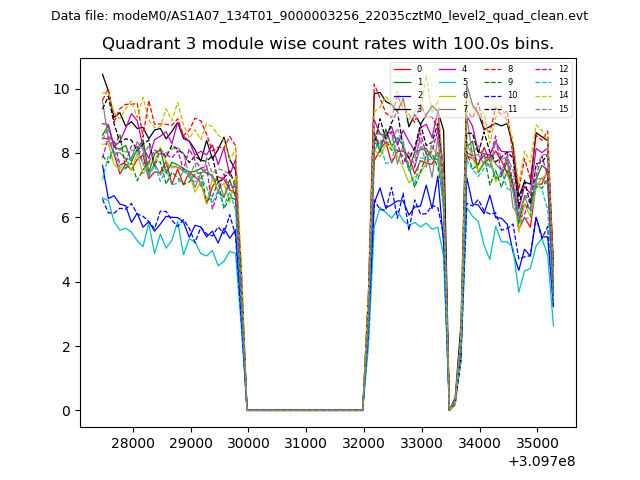 |
 |
| Parameter | Plot |
|---|---|
| CZT HV Monitor | 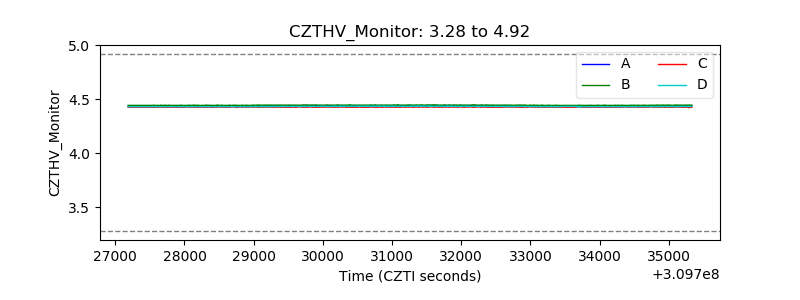 |
| D_VDD | 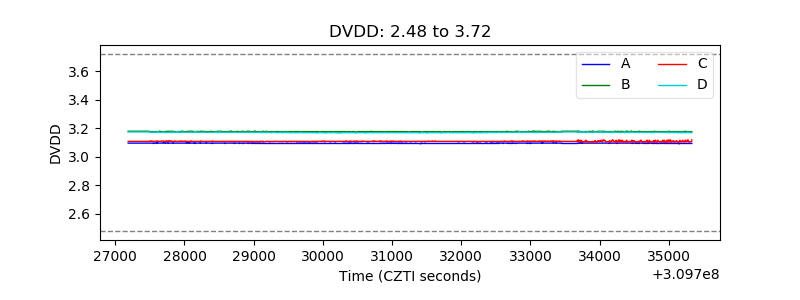 |
| Temperature 1 | 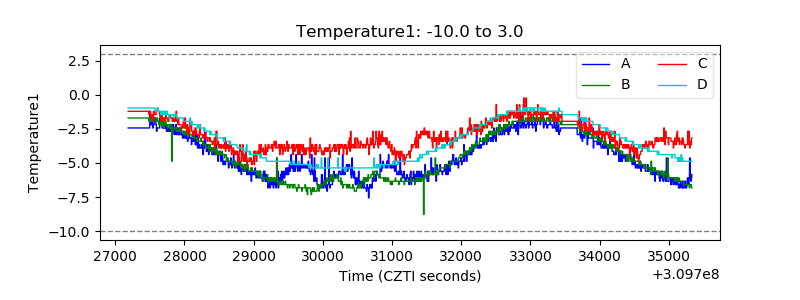 |
| Veto HV Monitor | 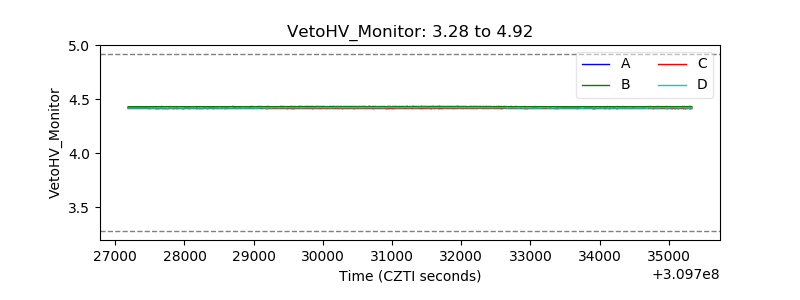 |
| Veto LLD | 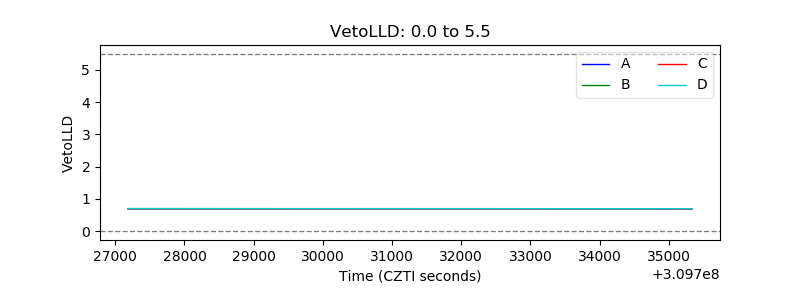 |
| Alpha Counter | 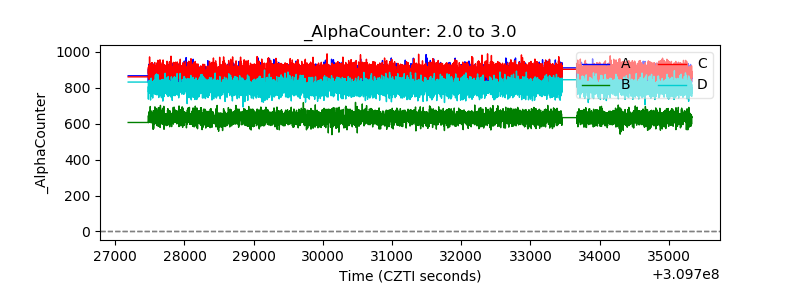 |
| _CPM_Rate | 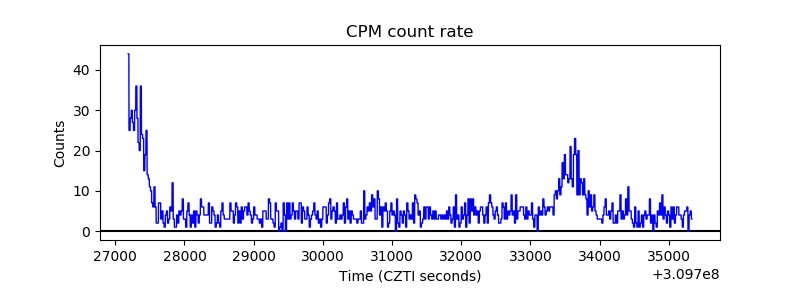 |
| CZT Counter | 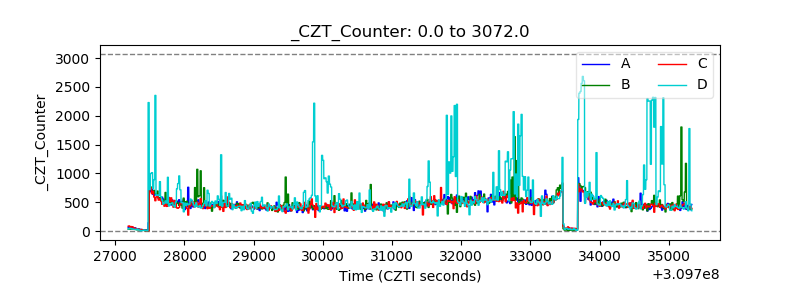 |
| +2.5 Volts monitor |  |
| +5 Volts monitor |  |
| _ROLL_ROT | 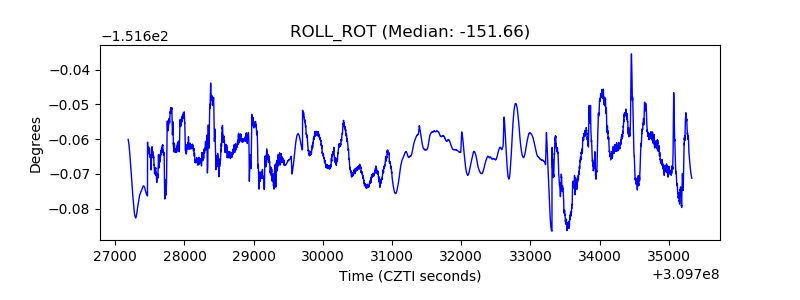 |
| _Roll_DEC | 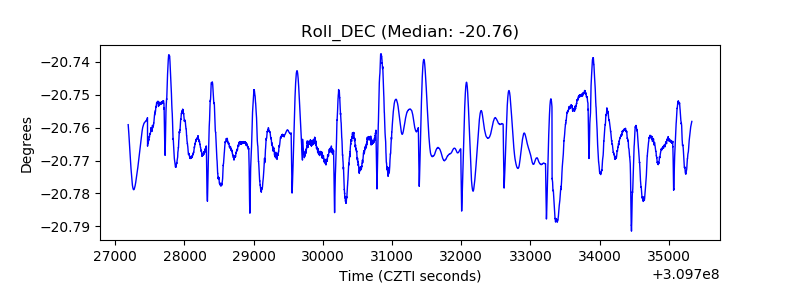 |
| _Roll_RA | 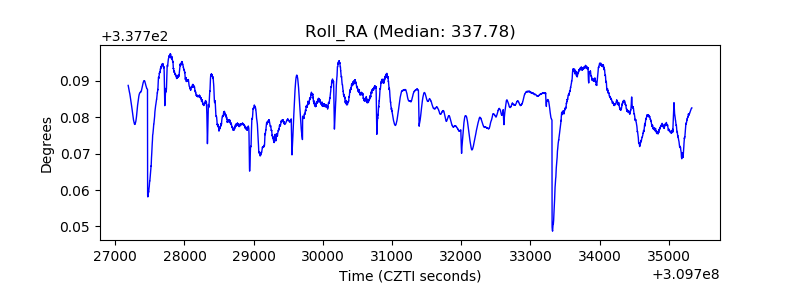 |
| Veto Counter | 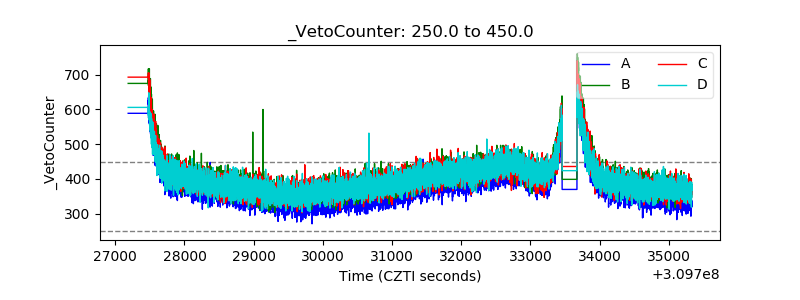 |