| Param | Original file | Final file |
|---|---|---|
| Filename | modeM0/AS1A07_134T01_9000003256_22039cztM0_level2.evt | modeM0/AS1A07_134T01_9000003256_22039cztM0_level2_quad_clean.evt |
| Size (bytes) | 612,000,000 | 77,011,200 |
| Size | 583.6 MB | 73.4 MB |
| Events in quadrant A | 3,473,337 | 472,887 |
| Events in quadrant B | 3,600,732 | 478,662 |
| Events in quadrant C | 3,469,966 | 460,051 |
| Events in quadrant D | 7,504,114 | 420,071 |
| Mode M9 | |||
|---|---|---|---|
| Quadrant | BADHDUFLAG | Total packets | Discarded packets |
| A | 0 | 15 | 0 |
| B | 0 | 15 | 0 |
| C | 0 | 15 | 0 |
| D | 0 | 15 | 0 |
| Mode SS | |||
|---|---|---|---|
| Quadrant | BADHDUFLAG | Total packets | Discarded packets |
| A | 0 | 148 | 0 |
| B | 0 | 148 | 0 |
| C | 0 | 148 | 0 |
| D | 0 | 148 | 0 |
| Mode M0 | |||
|---|---|---|---|
| Quadrant | BADHDUFLAG | Total packets | Discarded packets |
| A | 0 | 14878 | 2 |
| B | 0 | 15147 | 2 |
| C | 0 | 14768 | 2 |
| D | 0 | 27178 | 4 |
| Quadrant | Total seconds | Saturated seconds | Saturation percentage |
|---|---|---|---|
| A | 7177 | 20 | 0.278668% |
| B | 7178 | 53 | 0.738367% |
| C | 7178 | 67 | 0.933408% |
| D | 7177 | 979 | 13.640797% |
Noise dominated data is calculated using 1-second bins in cleaned event files. If a bin has >2000 counts, and if more than 50% of those come from <1% of pixels, then it is considered to be noise-dominated and hence unusable.
| Quadrant | # 1 sec bins | Bins with >0 counts | Bins with >2000 counts | High rate bins dominated by noise | Noise dominated (total time) | Noise dominated (detector-on time) | Marked lightcurve |
|---|---|---|---|---|---|---|---|
| A | 8737 | 7177 | 0 | 0 | 0.00% | 0.00% | 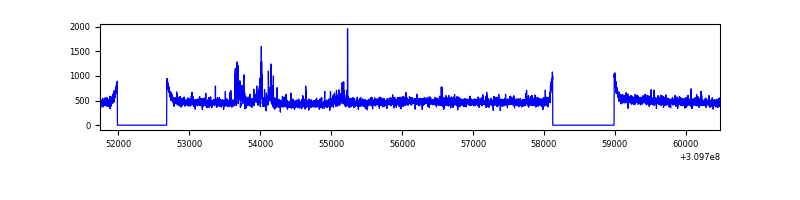 |
| B | 8738 | 7179 | 13 | 13 | 0.15% | 0.18% | 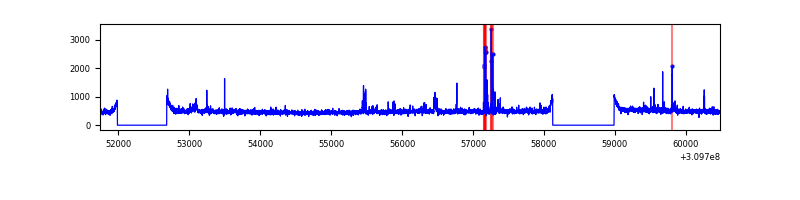 |
| C | 8738 | 7179 | 0 | 0 | 0.00% | 0.00% | 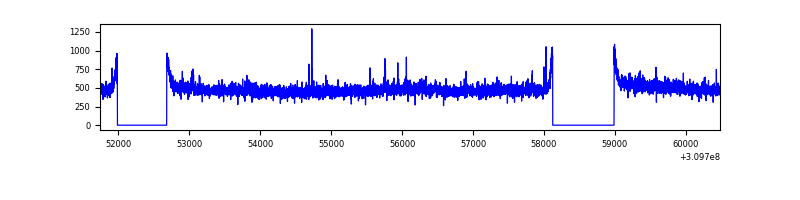 |
| D | 8737 | 7177 | 924 | 924 | 10.58% | 12.87% | 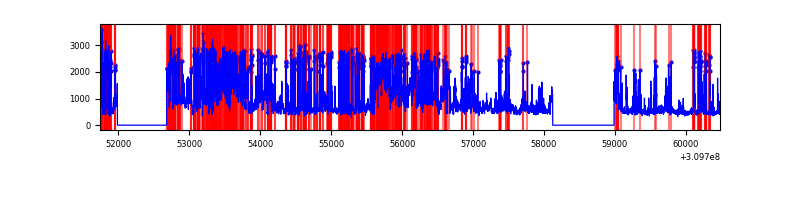 |
Top three noisy pixels from each quadrant. If the there are fewer than three noisy pixels in the level2.evt file, extra rows are filled as -1
| Pixel properties | Quadrant properties | ||||||
|---|---|---|---|---|---|---|---|
| Quadrant | DetID | PixID | Counts | Sigma | Mean | Median | Sigma |
| A | 5 | 16 | 100860 | 566.75 | 875 | 856 | 176.5 |
| A | 13 | 254 | 10856 | 56.67 | 875 | 856 | 176.5 |
| A | 3 | 137 | 7595 | 38.19 | 875 | 856 | 176.5 |
| B | 3 | 64 | 83707 | 492.8 | 875 | 853 | 168.1 |
| B | 0 | 230 | 52301 | 306.01 | 875 | 853 | 168.1 |
| B | 0 | 197 | 22845 | 130.81 | 875 | 853 | 168.1 |
| C | 14 | 238 | 133943 | 672.41 | 845 | 850 | 197.9 |
| C | 10 | 22 | 39893 | 197.25 | 845 | 850 | 197.9 |
| C | 13 | 61 | 6034 | 26.19 | 845 | 850 | 197.9 |
| D | 1 | 52 | 3710538 | 18729.22 | 810 | 785 | 198.1 |
| D | 11 | 176 | 615147 | 3101.69 | 810 | 785 | 198.1 |
| D | 2 | 136 | 40223 | 199.11 | 810 | 785 | 198.1 |
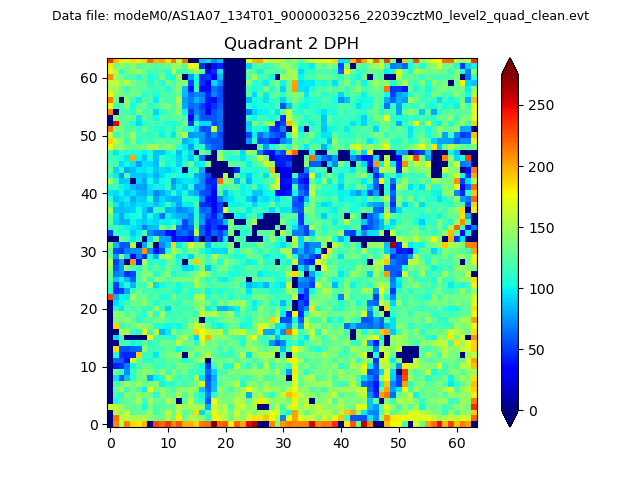
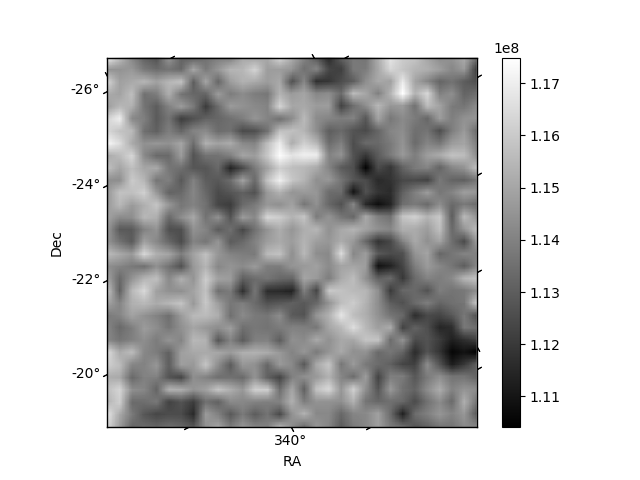
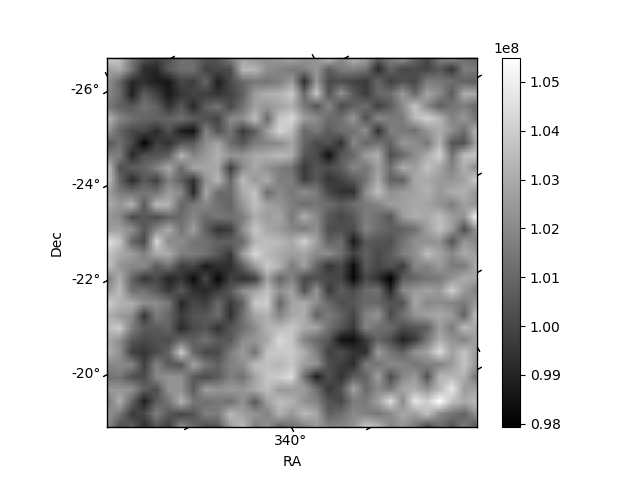
Histogram calculated using DETX and DETY for each event in the final _common_clean file
| Quadrant A | 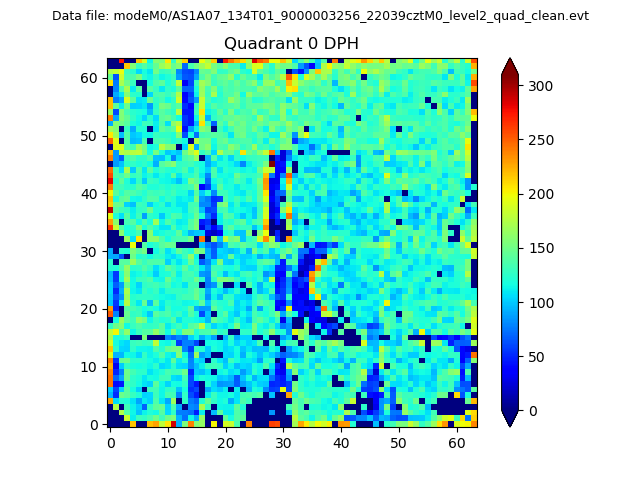 |
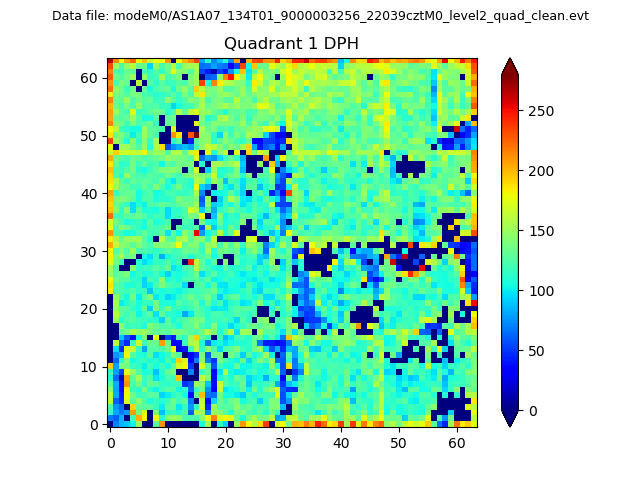 |
Quadrant B |
|---|---|---|---|
| Quadrant D | 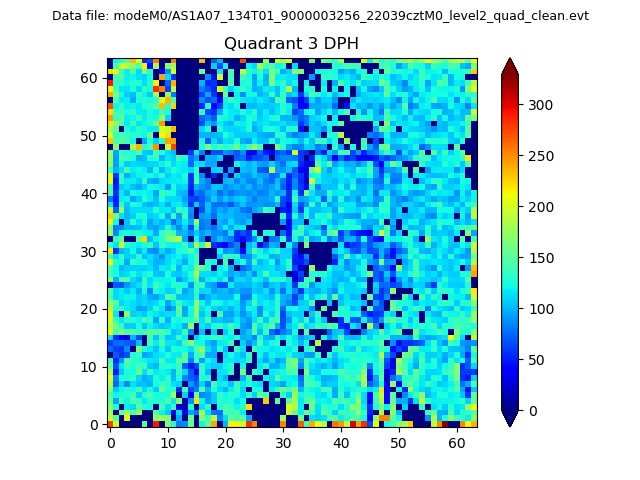 |
 |
Quadrant C |
| Plot type | Count rate plots | Images |
|---|---|---|
| Comparison with Poisson distribution Blue bars denote a histogram of data divided into 1 sec bins. Red curve is a Poisson curve with rate = median count rate of data. |
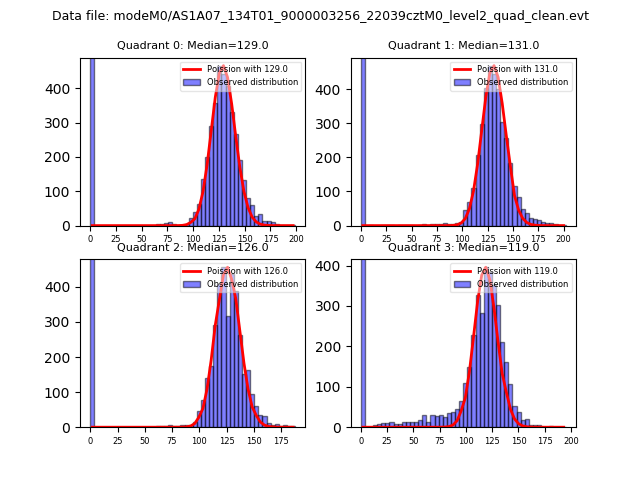 |
 |
| Quadrant-wise count rates Data is divided into 100 sec bins |
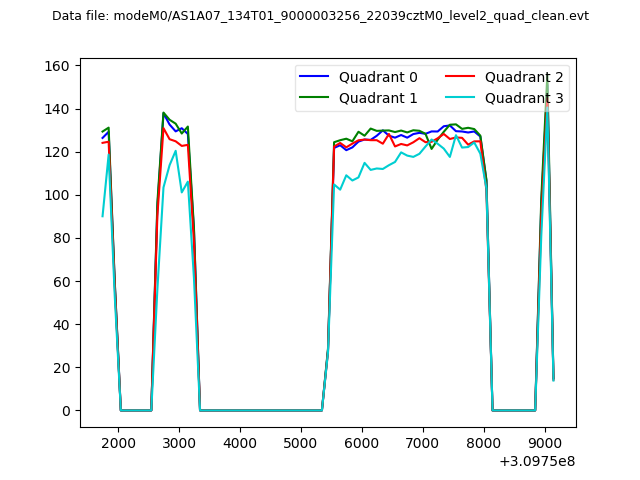 |
|
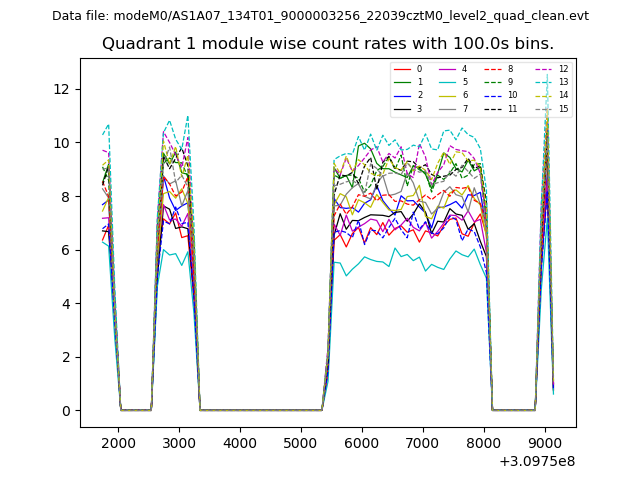
| Module-wise count rates for Quadrant A Data is divided into 100 sec bins |
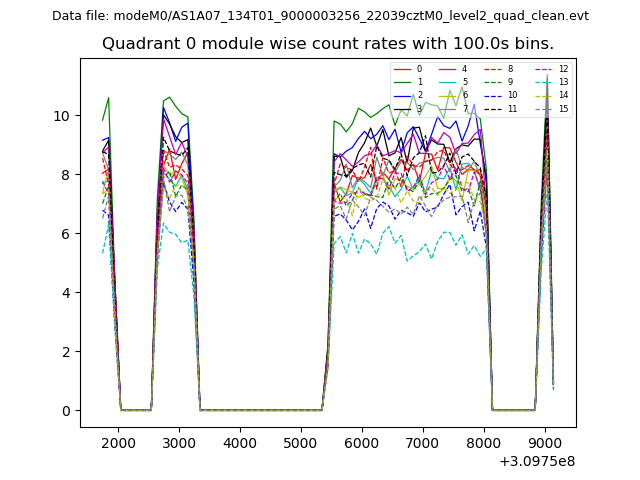 |
 |
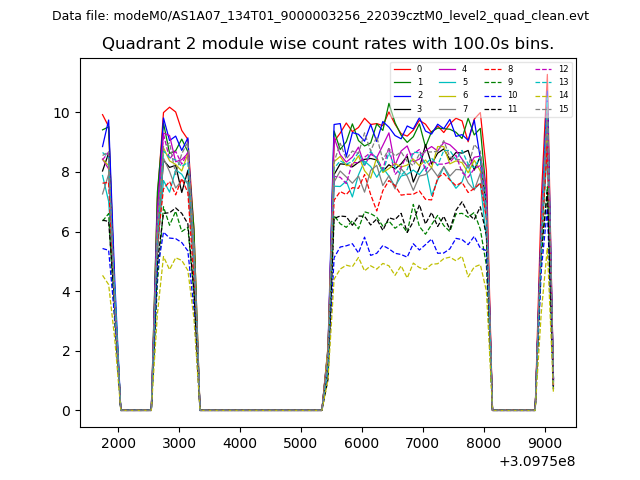
| Module-wise count rates for Quadrant B Data is divided into 100 sec bins |
 |
 |
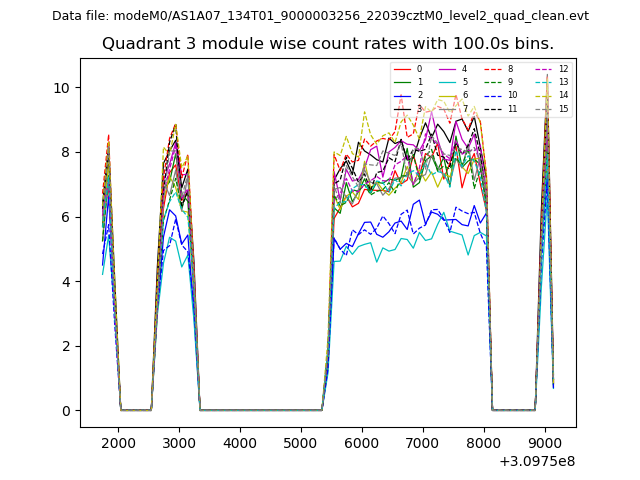
| Module-wise count rates for Quadrant C Data is divided into 100 sec bins |
 |
 |
| Module-wise count rates for Quadrant D Data is divided into 100 sec bins |
 |
 |
| Parameter | Plot |
|---|---|
| CZT HV Monitor | 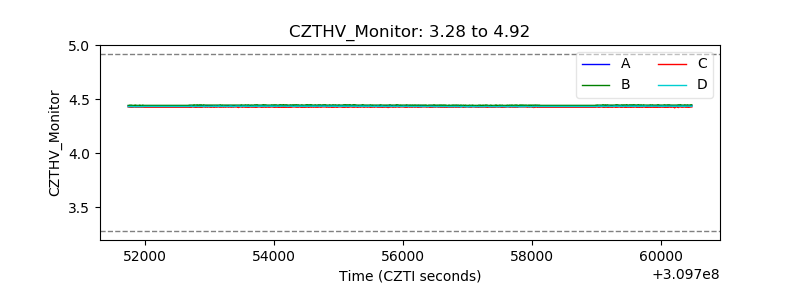 |
| D_VDD |  |
| Temperature 1 | 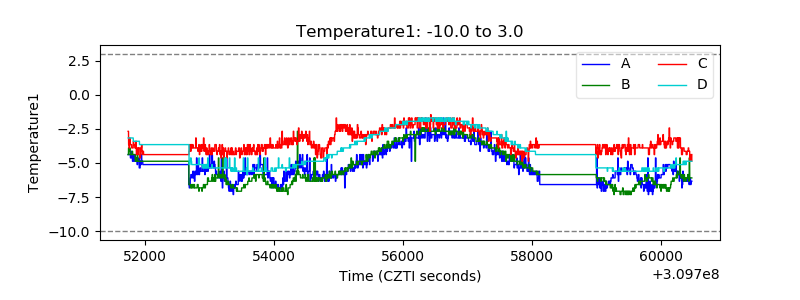 |
| Veto HV Monitor | 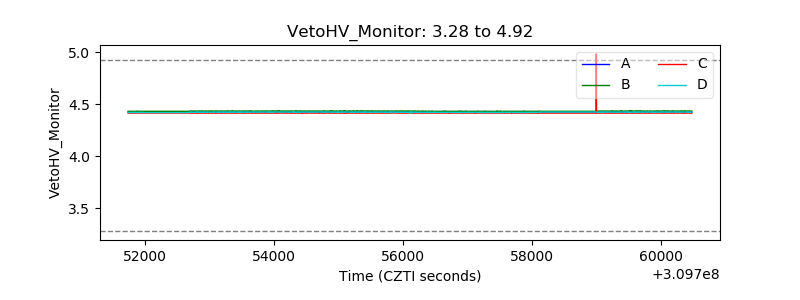 |
| Veto LLD | 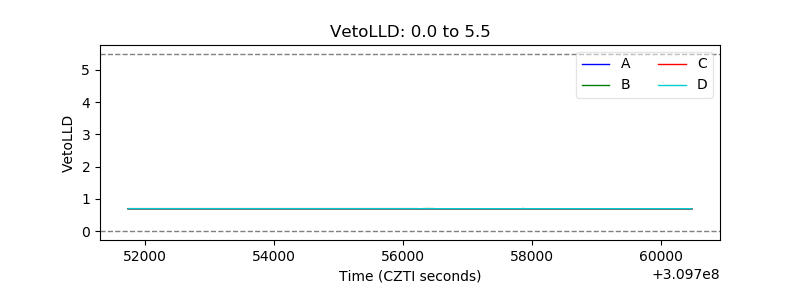 |
| Alpha Counter | 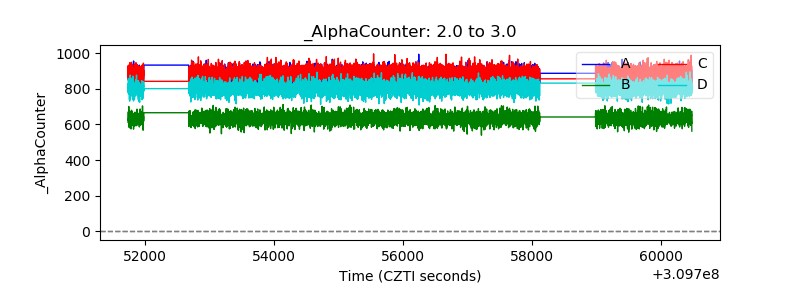 |
| _CPM_Rate | 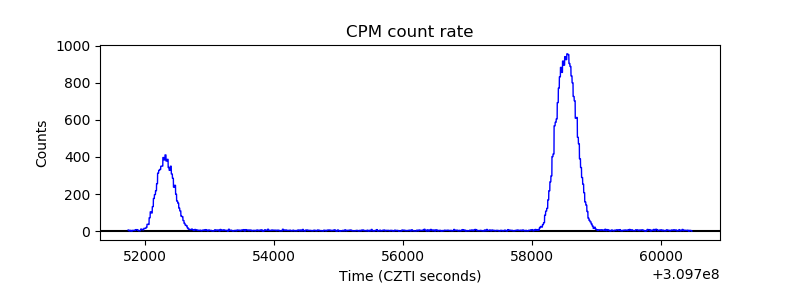 |
| CZT Counter | 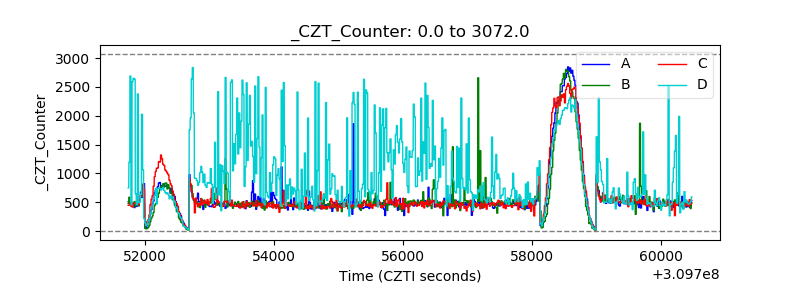 |
| +2.5 Volts monitor |  |
| +5 Volts monitor |  |
| _ROLL_ROT | 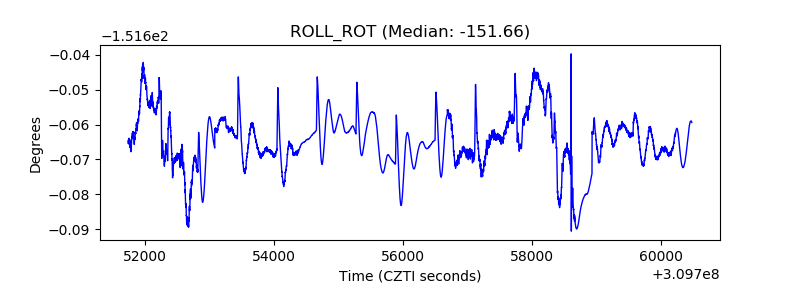 |
| _Roll_DEC | 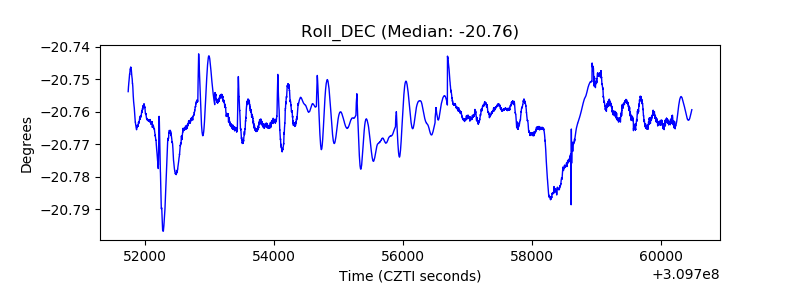 |
| _Roll_RA | 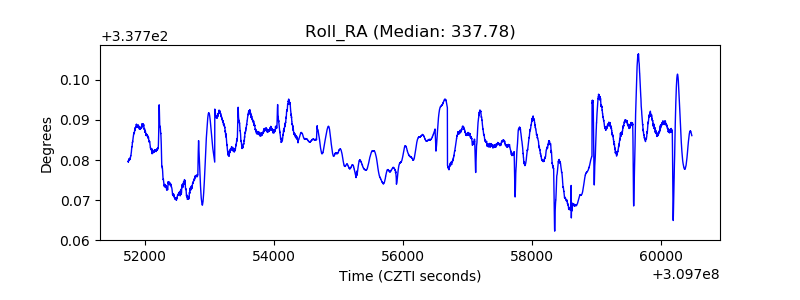 |
| Veto Counter | 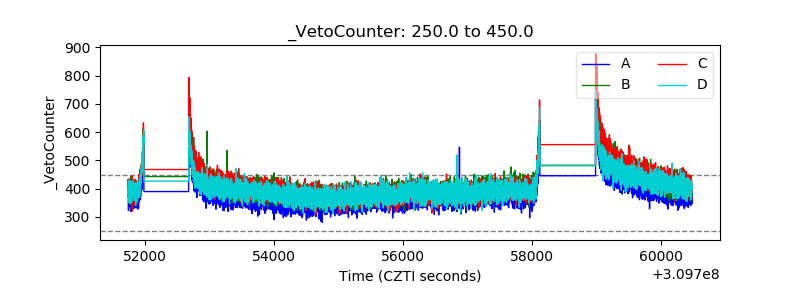 |