| Param | Original file | Final file |
|---|---|---|
| Filename | modeM0/AS1A07_134T01_9000003256_22040cztM0_level2.evt | modeM0/AS1A07_134T01_9000003256_22040cztM0_level2_quad_clean.evt |
| Size (bytes) | 515,672,640 | 66,479,040 |
| Size | 491.8 MB | 63.4 MB |
| Events in quadrant A | 3,214,671 | 396,791 |
| Events in quadrant B | 3,810,430 | 394,706 |
| Events in quadrant C | 3,446,365 | 386,710 |
| Events in quadrant D | 4,695,176 | 371,401 |
| Mode M9 | |||
|---|---|---|---|
| Quadrant | BADHDUFLAG | Total packets | Discarded packets |
| A | 0 | 18 | 0 |
| B | 0 | 19 | 0 |
| C | 0 | 19 | 0 |
| D | 0 | 19 | 0 |
| Mode SS | |||
|---|---|---|---|
| Quadrant | BADHDUFLAG | Total packets | Discarded packets |
| A | 0 | 132 | 0 |
| B | 0 | 132 | 0 |
| C | 0 | 132 | 0 |
| D | 0 | 132 | 0 |
| Mode M0 | |||
|---|---|---|---|
| Quadrant | BADHDUFLAG | Total packets | Discarded packets |
| A | 0 | 13679 | 2 |
| B | 0 | 15401 | 2 |
| C | 0 | 14355 | 2 |
| D | 0 | 18214 | 2 |
| Quadrant | Total seconds | Saturated seconds | Saturation percentage |
|---|---|---|---|
| A | 6649 | 26 | 0.391036% |
| B | 6649 | 206 | 3.098210% |
| C | 6649 | 97 | 1.458866% |
| D | 6649 | 301 | 4.526997% |
Noise dominated data is calculated using 1-second bins in cleaned event files. If a bin has >2000 counts, and if more than 50% of those come from <1% of pixels, then it is considered to be noise-dominated and hence unusable.
| Quadrant | # 1 sec bins | Bins with >0 counts | Bins with >2000 counts | High rate bins dominated by noise | Noise dominated (total time) | Noise dominated (detector-on time) | Marked lightcurve |
|---|---|---|---|---|---|---|---|
| A | 7679 | 6649 | 0 | 0 | 0.00% | 0.00% | 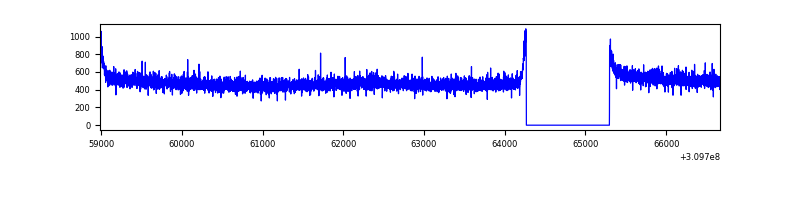 |
| B | 7679 | 6649 | 154 | 154 | 2.01% | 2.32% | 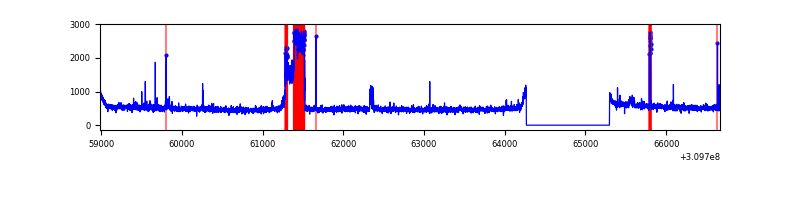 |
| C | 7679 | 6649 | 18 | 18 | 0.23% | 0.27% | 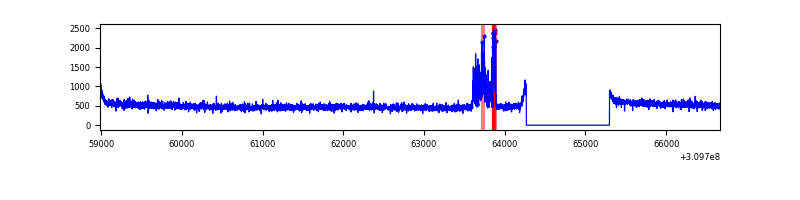 |
| D | 7679 | 6649 | 254 | 254 | 3.31% | 3.82% | 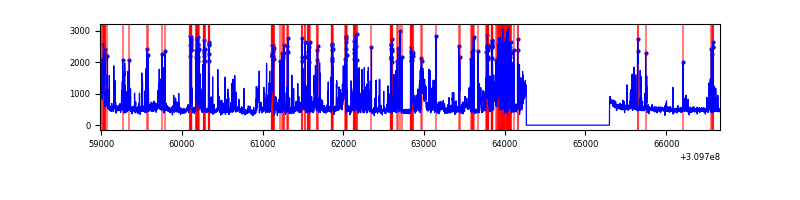 |
Top three noisy pixels from each quadrant. If the there are fewer than three noisy pixels in the level2.evt file, extra rows are filled as -1
| Pixel properties | Quadrant properties | ||||||
|---|---|---|---|---|---|---|---|
| Quadrant | DetID | PixID | Counts | Sigma | Mean | Median | Sigma |
| A | 13 | 254 | 9831 | 53.85 | 833 | 816 | 167.4 |
| A | 3 | 137 | 7191 | 38.08 | 833 | 816 | 167.4 |
| A | 0 | 226 | 6946 | 36.62 | 833 | 816 | 167.4 |
| B | 3 | 64 | 504063 | 3198.43 | 826 | 803 | 157.3 |
| B | 0 | 230 | 32203 | 199.56 | 826 | 803 | 157.3 |
| B | 0 | 197 | 24817 | 152.62 | 826 | 803 | 157.3 |
| C | 10 | 22 | 178980 | 943.82 | 804 | 811 | 188.8 |
| C | 14 | 238 | 128874 | 678.39 | 804 | 811 | 188.8 |
| C | 13 | 61 | 5611 | 25.43 | 804 | 811 | 188.8 |
| D | 11 | 176 | 1316535 | 6783.47 | 800 | 778 | 194.0 |
| D | 1 | 52 | 275804 | 1417.91 | 800 | 778 | 194.0 |
| D | 2 | 136 | 44823 | 227.08 | 800 | 778 | 194.0 |
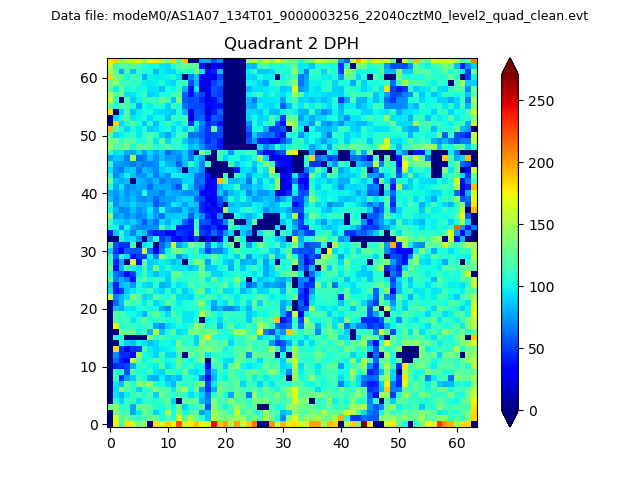
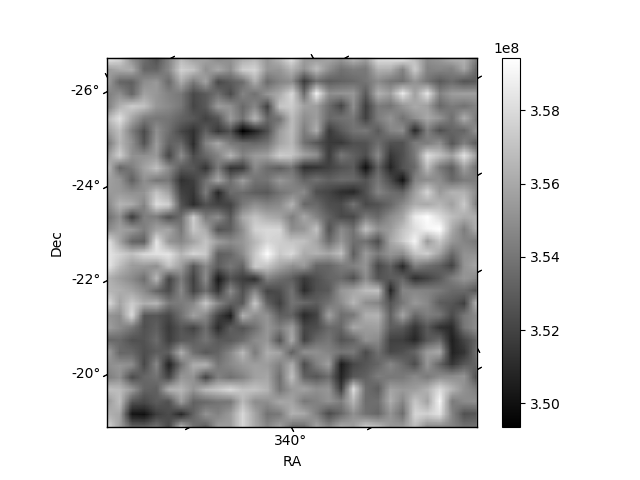
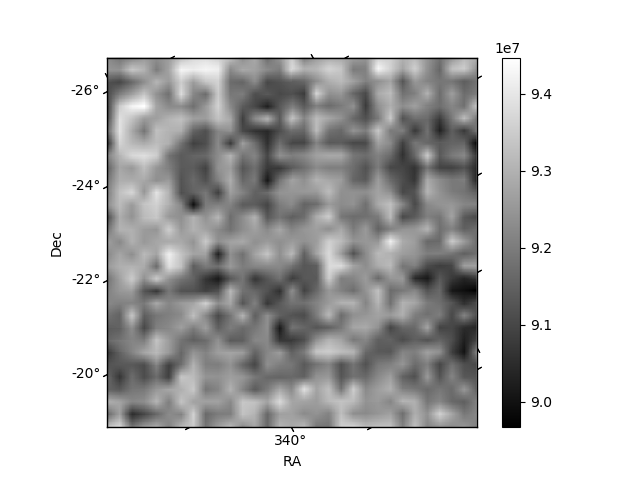
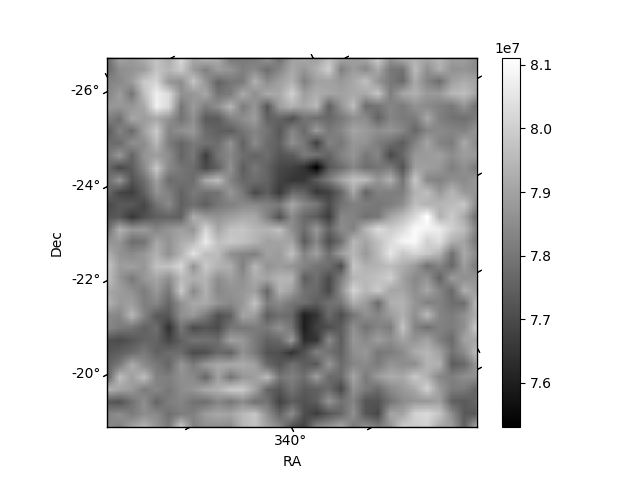
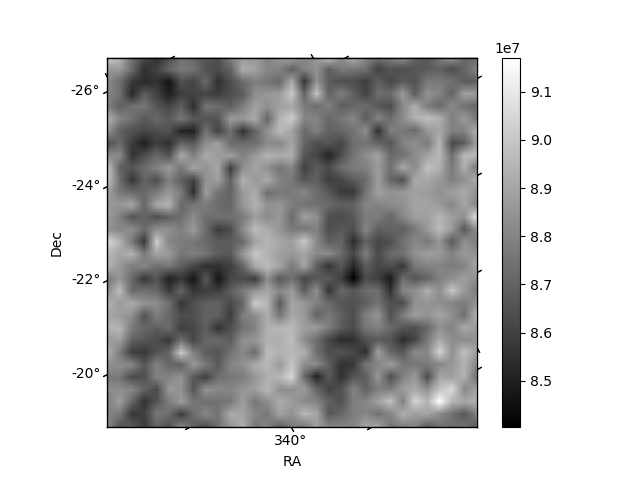
Histogram calculated using DETX and DETY for each event in the final _common_clean file
| Quadrant A | 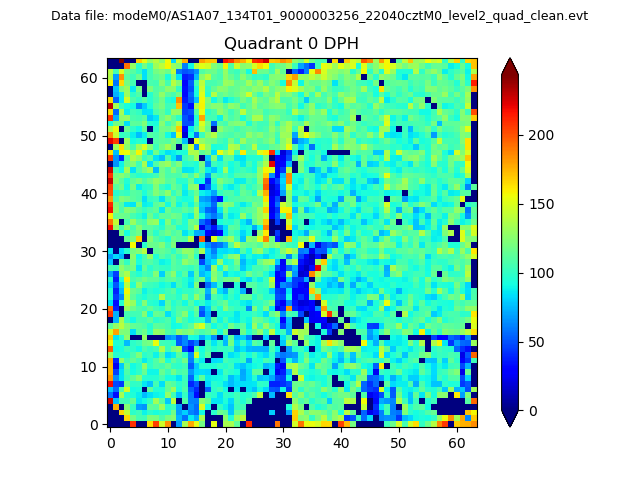 |
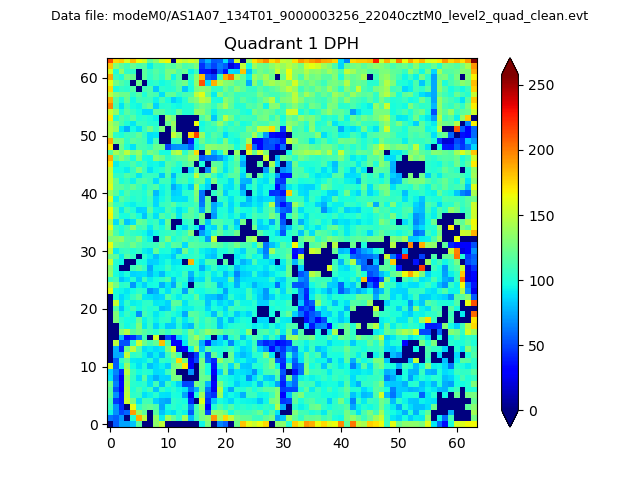 |
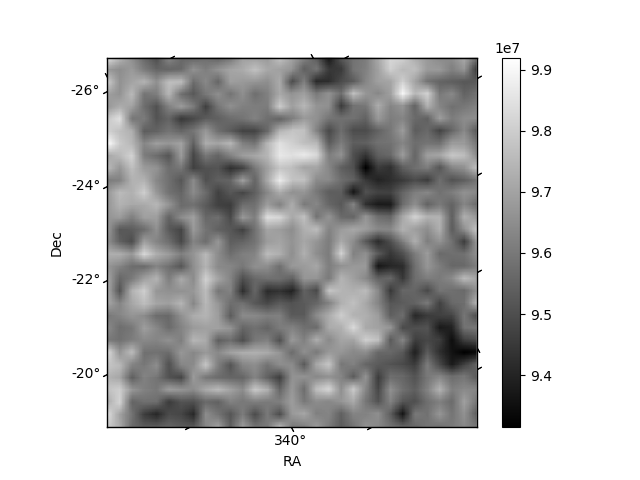
Quadrant B |
|---|---|---|---|
| Quadrant D | 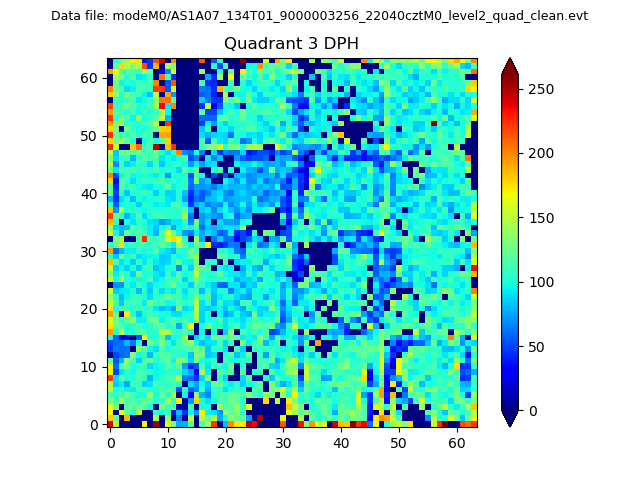 |
 |
Quadrant C |
| Plot type | Count rate plots | Images |
|---|---|---|
| Comparison with Poisson distribution Blue bars denote a histogram of data divided into 1 sec bins. Red curve is a Poisson curve with rate = median count rate of data. |
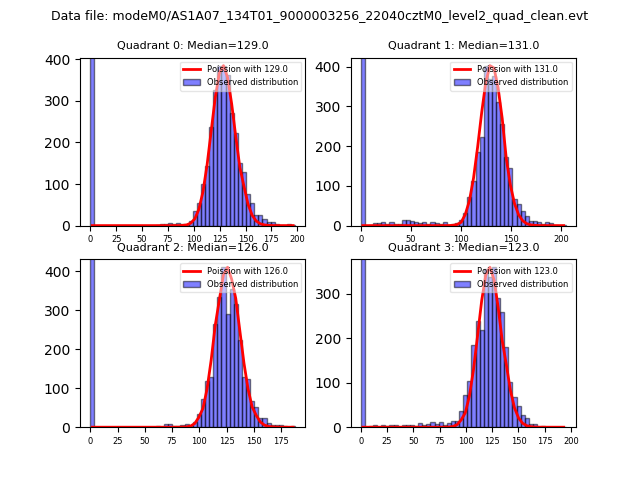 |
 |
| Quadrant-wise count rates Data is divided into 100 sec bins |
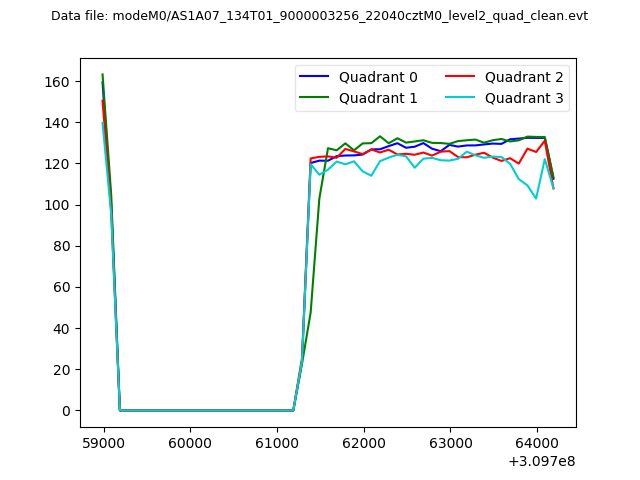 |
|
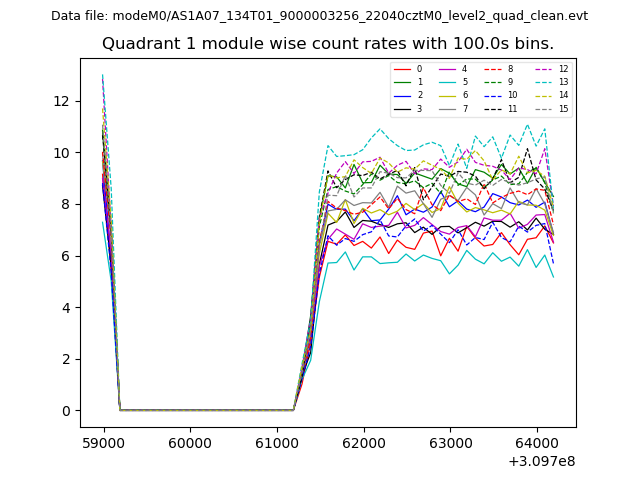
| Module-wise count rates for Quadrant A Data is divided into 100 sec bins |
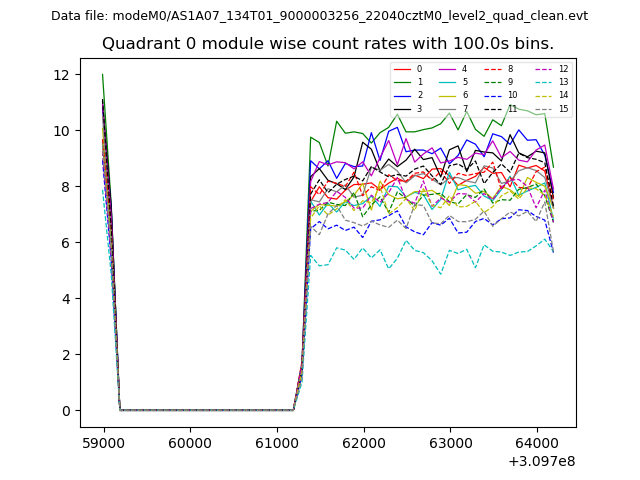 |
 |
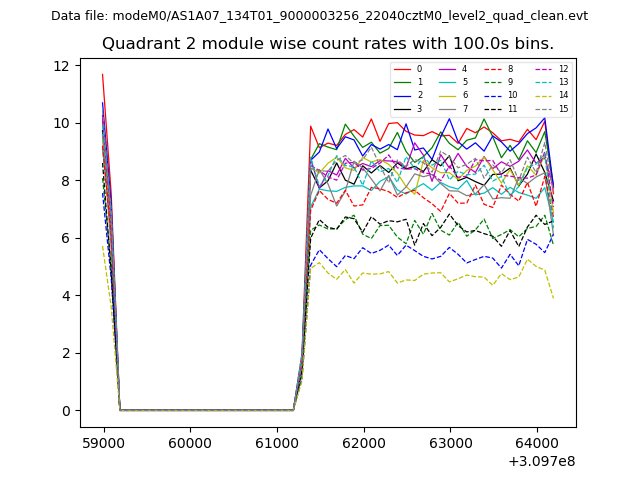
| Module-wise count rates for Quadrant B Data is divided into 100 sec bins |
 |
 |
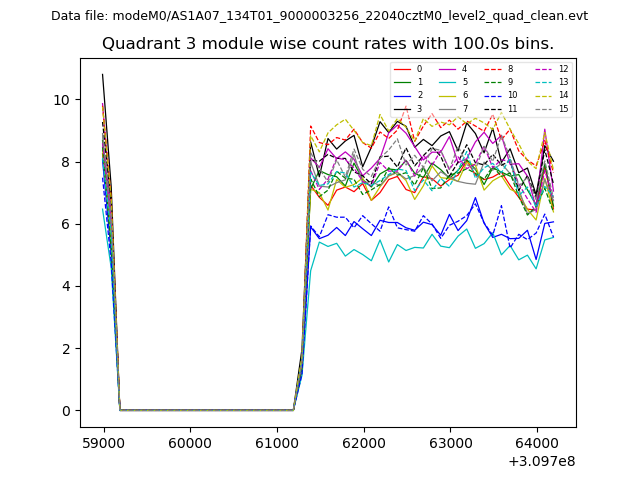
| Module-wise count rates for Quadrant C Data is divided into 100 sec bins |
 |
 |
| Module-wise count rates for Quadrant D Data is divided into 100 sec bins |
 |
 |
| Parameter | Plot |
|---|---|
| CZT HV Monitor | 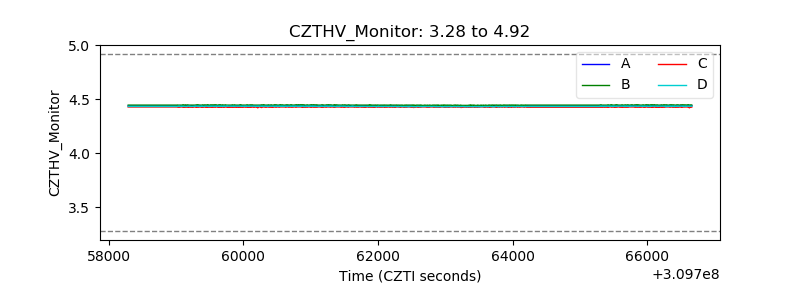 |
| D_VDD | 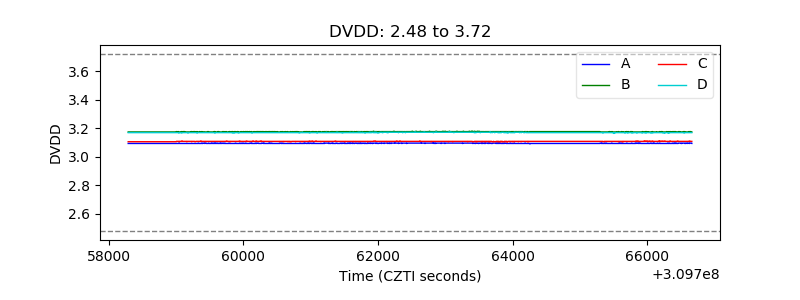 |
| Temperature 1 | 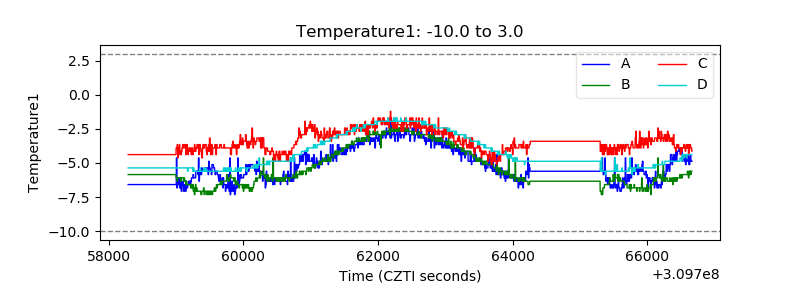 |
| Veto HV Monitor | 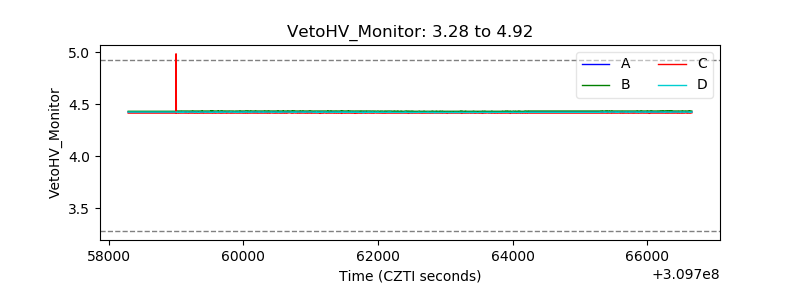 |
| Veto LLD | 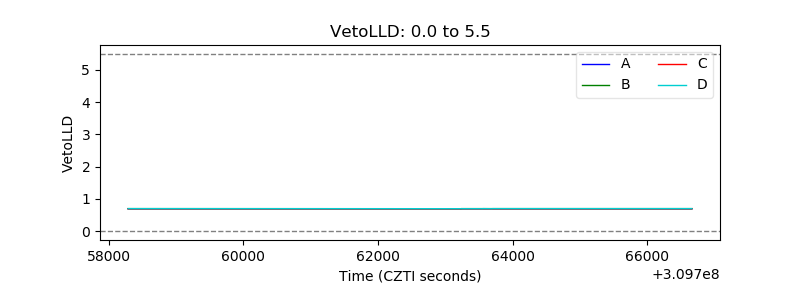 |
| Alpha Counter | 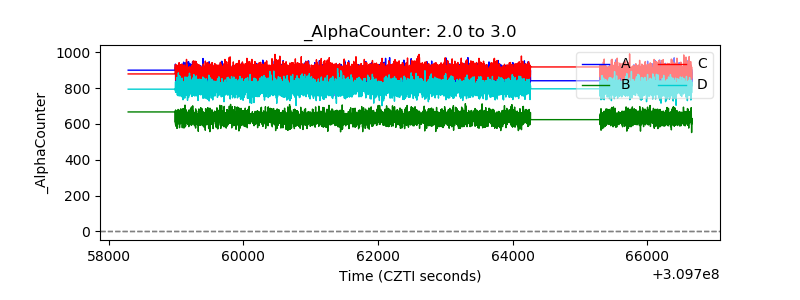 |
| _CPM_Rate | 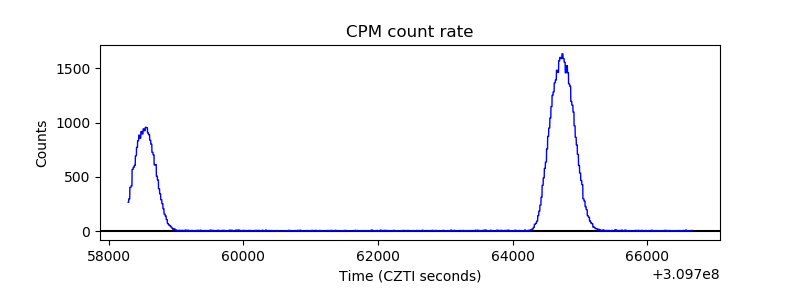 |
| CZT Counter | 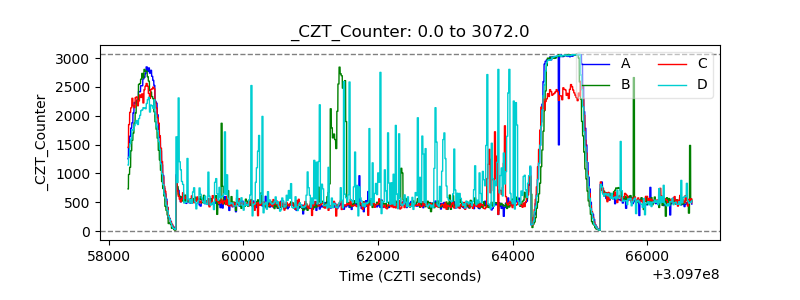 |
| +2.5 Volts monitor |  |
| +5 Volts monitor | 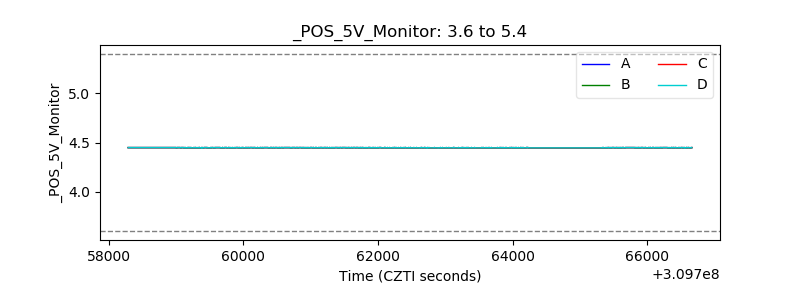 |
| _ROLL_ROT | 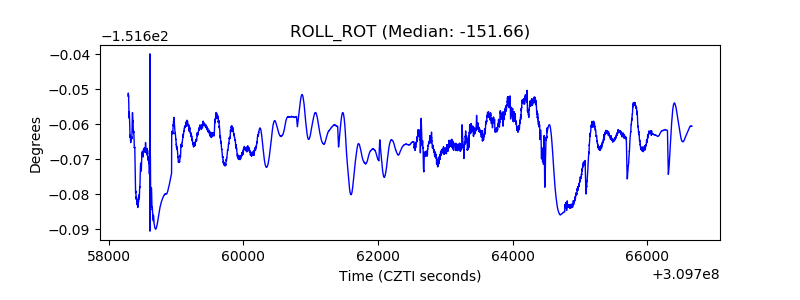 |
| _Roll_DEC | 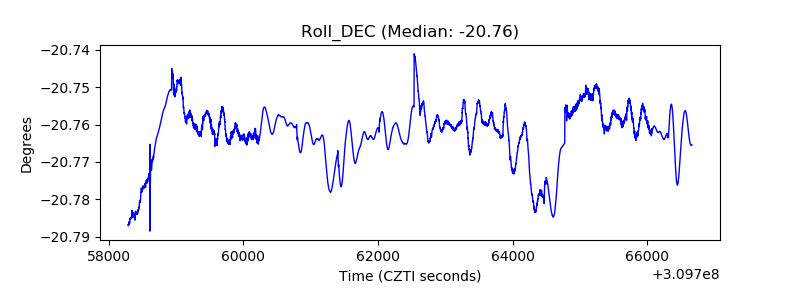 |
| _Roll_RA | 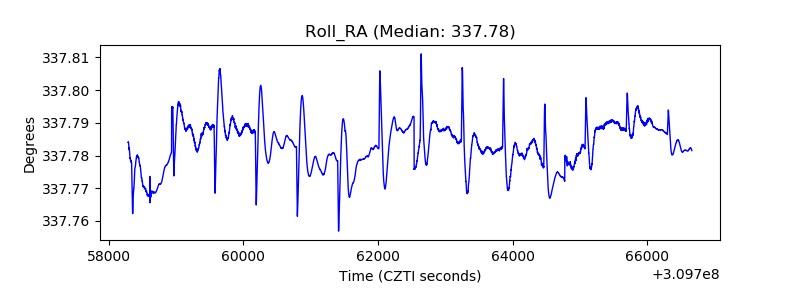 |
| Veto Counter | 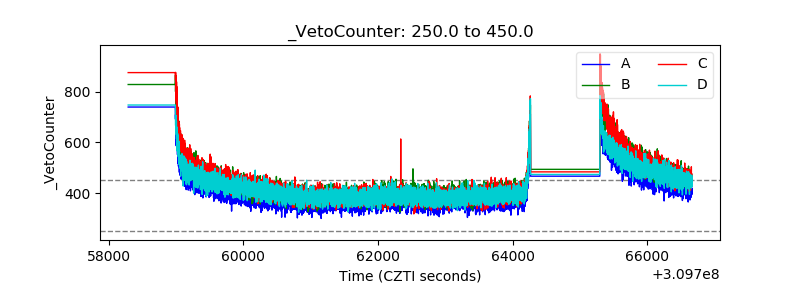 |