| Param | Original file | Final file |
|---|---|---|
| Filename | modeM0/AS1A07_027T02_9000003258_22043cztM0_level2.evt | modeM0/AS1A07_027T02_9000003258_22043cztM0_level2_quad_clean.evt |
| Size (bytes) | 185,097,600 | 22,567,680 |
| Size | 176.5 MB | 21.5 MB |
| Events in quadrant A | 1,285,089 | 132,731 |
| Events in quadrant B | 1,328,463 | 135,100 |
| Events in quadrant C | 1,306,541 | 127,152 |
| Events in quadrant D | 1,529,943 | 124,510 |
| Mode SS | |||
|---|---|---|---|
| Quadrant | BADHDUFLAG | Total packets | Discarded packets |
| A | 0 | 48 | 0 |
| B | 0 | 48 | 0 |
| C | 0 | 48 | 0 |
| D | 0 | 48 | 0 |
| Mode M9 | |||
|---|---|---|---|
| Quadrant | BADHDUFLAG | Total packets | Discarded packets |
| A | 0 | 12 | 0 |
| B | 0 | 12 | 0 |
| C | 0 | 12 | 0 |
| D | 0 | 12 | 0 |
| Mode M0 | |||
|---|---|---|---|
| Quadrant | BADHDUFLAG | Total packets | Discarded packets |
| A | 0 | 5392 | 1 |
| B | 0 | 5489 | 1 |
| C | 0 | 5474 | 1 |
| D | 0 | 6121 | 1 |
| Quadrant | Total seconds | Saturated seconds | Saturation percentage |
|---|---|---|---|
| A | 2258 | 55 | 2.435784% |
| B | 2258 | 68 | 3.011515% |
| C | 2258 | 97 | 4.295837% |
| D | 2258 | 109 | 4.827281% |
Noise dominated data is calculated using 1-second bins in cleaned event files. If a bin has >2000 counts, and if more than 50% of those come from <1% of pixels, then it is considered to be noise-dominated and hence unusable.
| Quadrant | # 1 sec bins | Bins with >0 counts | Bins with >2000 counts | High rate bins dominated by noise | Noise dominated (total time) | Noise dominated (detector-on time) | Marked lightcurve |
|---|---|---|---|---|---|---|---|
| A | 3498 | 2258 | 0 | 0 | 0.00% | 0.00% | 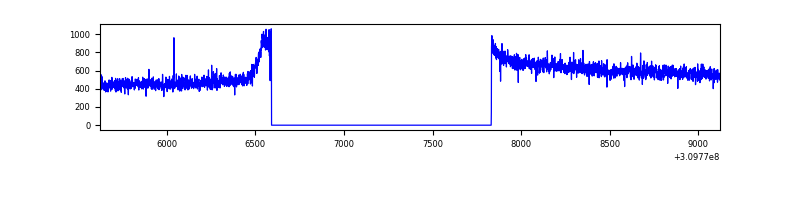 |
| B | 3498 | 2258 | 2 | 2 | 0.06% | 0.09% | 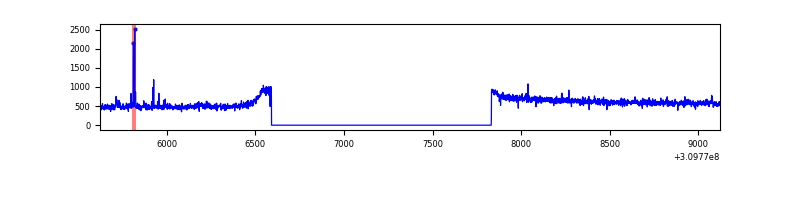 |
| C | 3498 | 2258 | 0 | 0 | 0.00% | 0.00% | 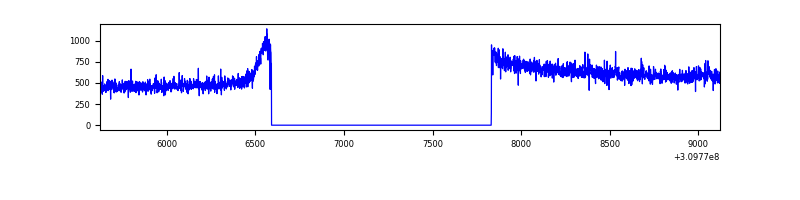 |
| D | 3498 | 2258 | 58 | 58 | 1.66% | 2.57% | 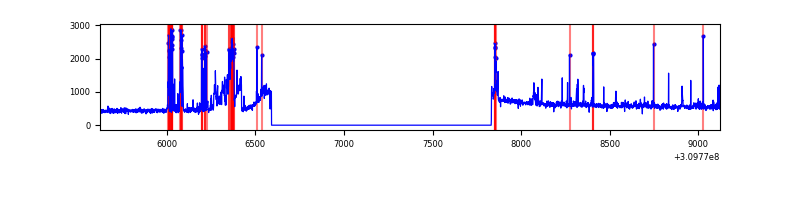 |
Top three noisy pixels from each quadrant. If the there are fewer than three noisy pixels in the level2.evt file, extra rows are filled as -1
| Pixel properties | Quadrant properties | ||||||
|---|---|---|---|---|---|---|---|
| Quadrant | DetID | PixID | Counts | Sigma | Mean | Median | Sigma |
| A | 13 | 254 | 3472 | 46.52 | 333 | 327 | 67.6 |
| A | 0 | 226 | 2848 | 37.29 | 333 | 327 | 67.6 |
| A | 3 | 137 | 2612 | 33.8 | 333 | 327 | 67.6 |
| B | 3 | 64 | 15534 | 241.38 | 331 | 324 | 63.0 |
| B | 0 | 230 | 8216 | 125.24 | 331 | 324 | 63.0 |
| B | 12 | 111 | 7376 | 111.91 | 331 | 324 | 63.0 |
| C | 14 | 238 | 50566 | 676.1 | 319 | 321 | 74.3 |
| C | 10 | 22 | 6525 | 83.48 | 319 | 321 | 74.3 |
| C | 13 | 61 | 2293 | 26.54 | 319 | 321 | 74.3 |
| D | 11 | 176 | 291900 | 3754.48 | 323 | 313 | 77.7 |
| D | 2 | 136 | 10918 | 136.55 | 323 | 313 | 77.7 |
| D | 2 | 234 | 7942 | 98.23 | 323 | 313 | 77.7 |
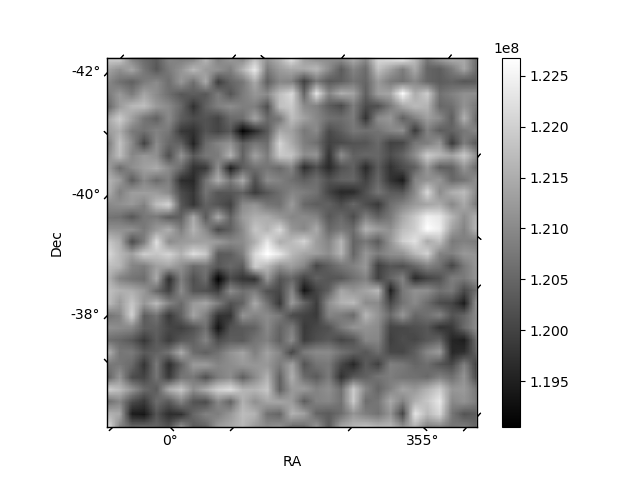
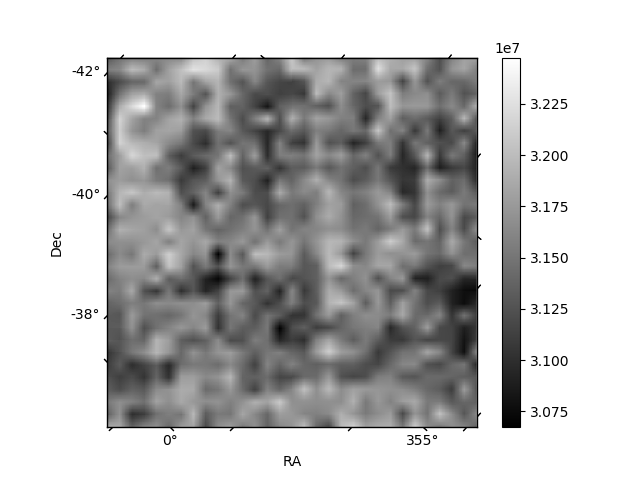
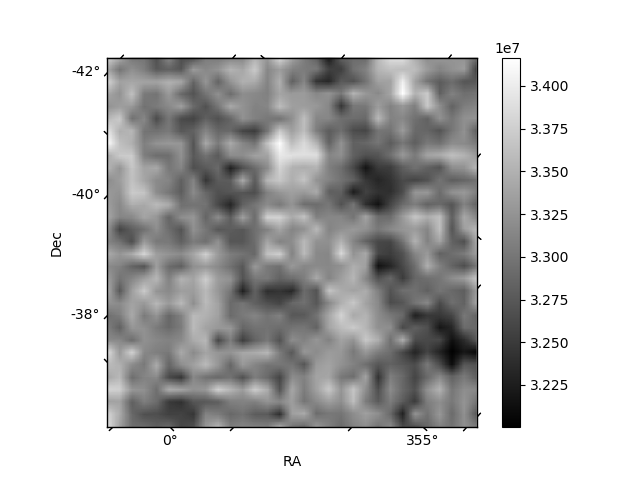
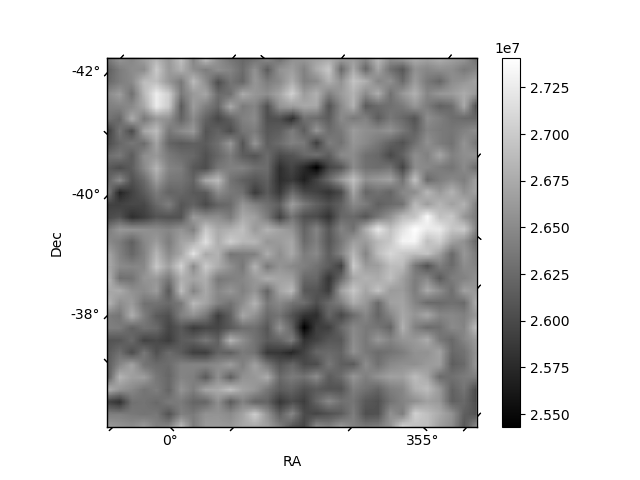
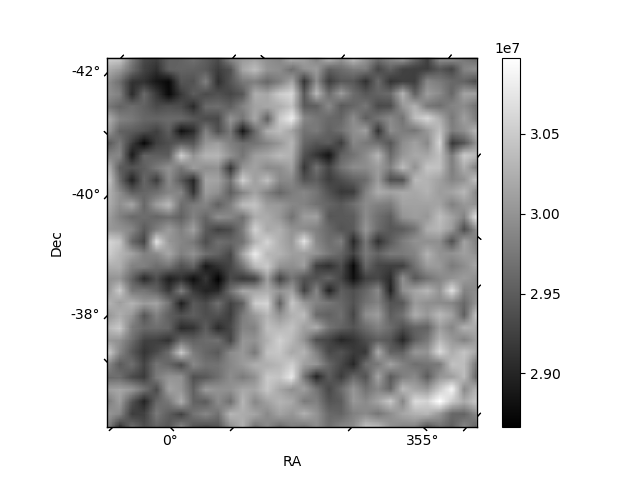
Histogram calculated using DETX and DETY for each event in the final _common_clean file
| Quadrant A | 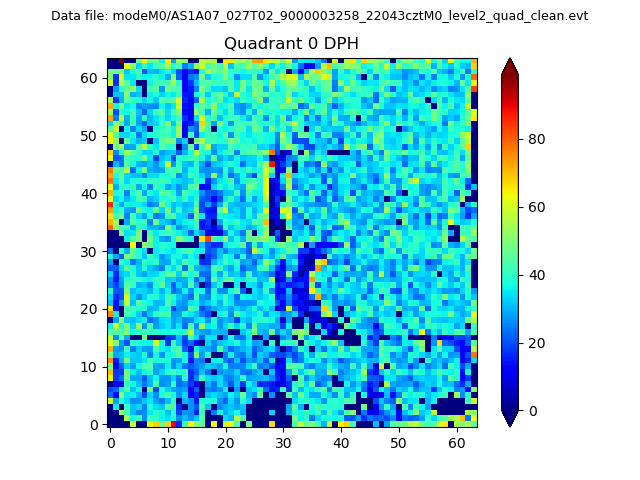 |
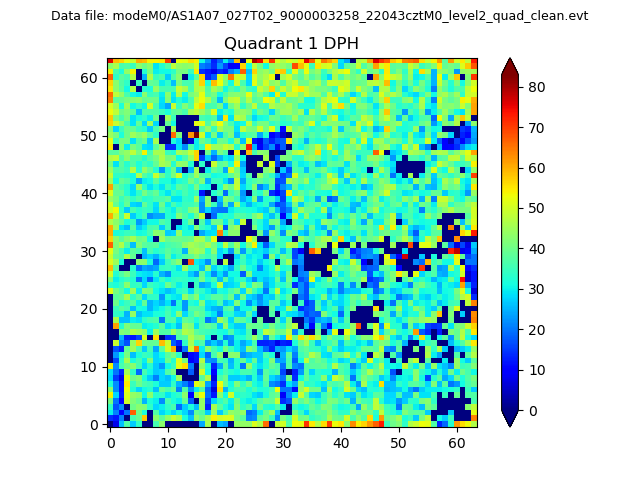 |
Quadrant B |
|---|---|---|---|
| Quadrant D | 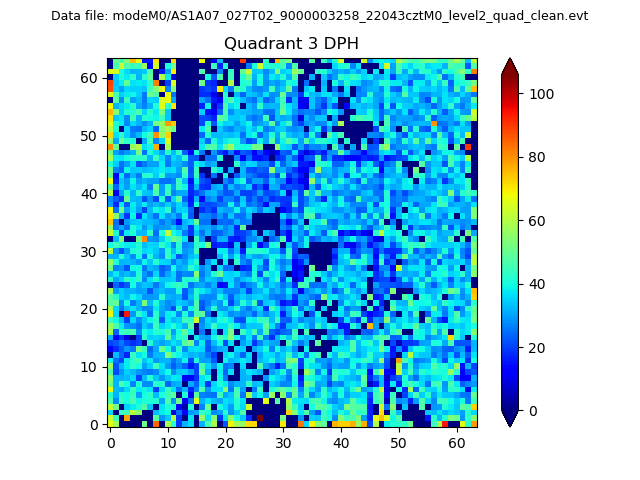 |
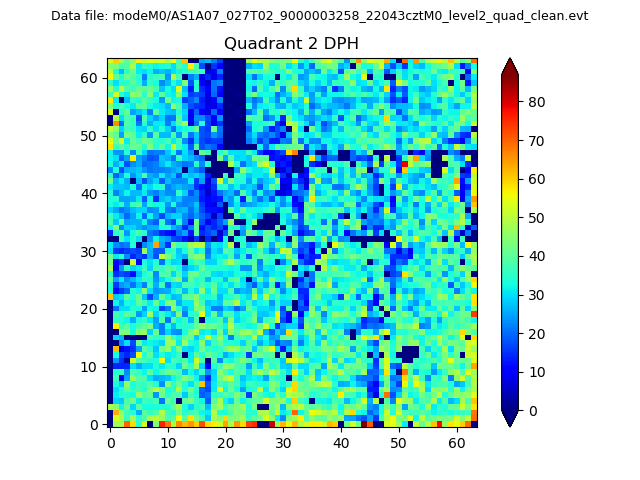 |
Quadrant C |
| Plot type | Count rate plots | Images |
|---|---|---|
| Comparison with Poisson distribution Blue bars denote a histogram of data divided into 1 sec bins. Red curve is a Poisson curve with rate = median count rate of data. |
 |
 |
| Quadrant-wise count rates Data is divided into 100 sec bins |
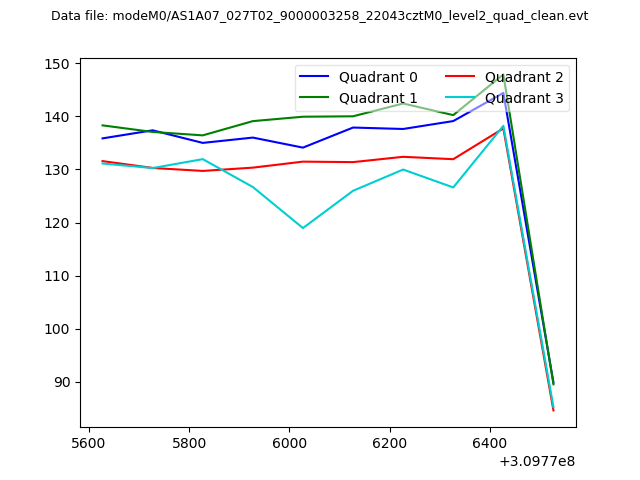 |
|
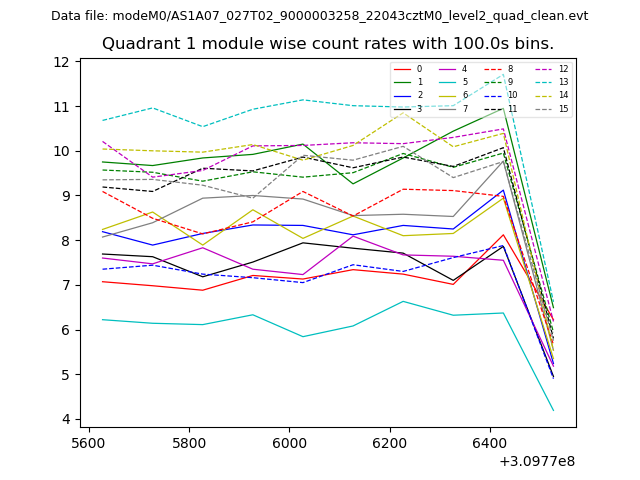
| Module-wise count rates for Quadrant A Data is divided into 100 sec bins |
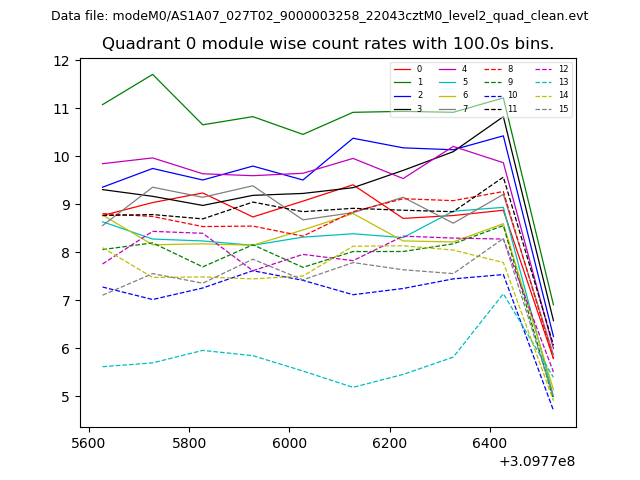 |
 |
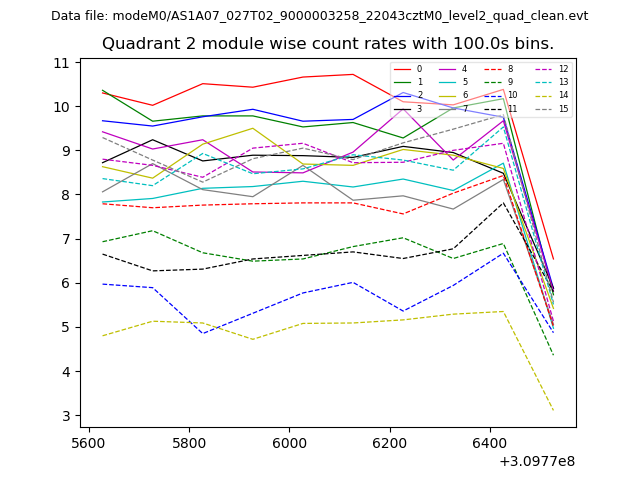
| Module-wise count rates for Quadrant B Data is divided into 100 sec bins |
 |
 |
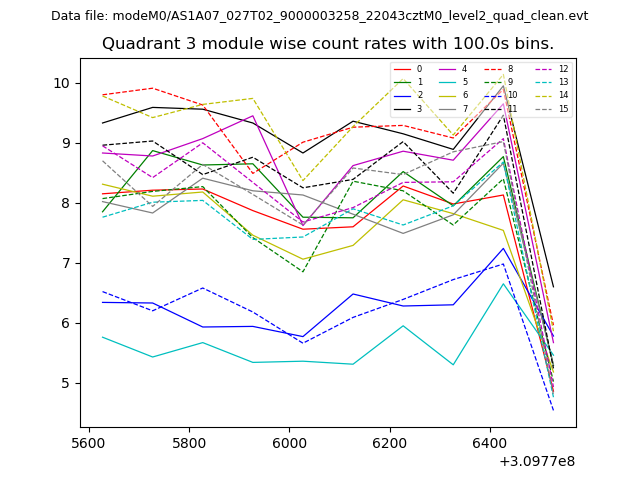
| Module-wise count rates for Quadrant C Data is divided into 100 sec bins |
 |
 |
| Module-wise count rates for Quadrant D Data is divided into 100 sec bins |
 |
 |
| Parameter | Plot |
|---|---|
| CZT HV Monitor | 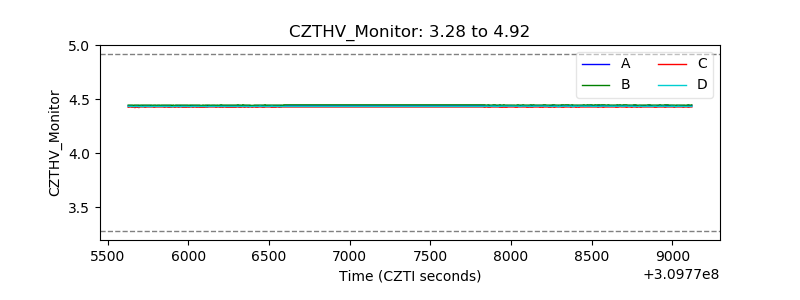 |
| D_VDD | 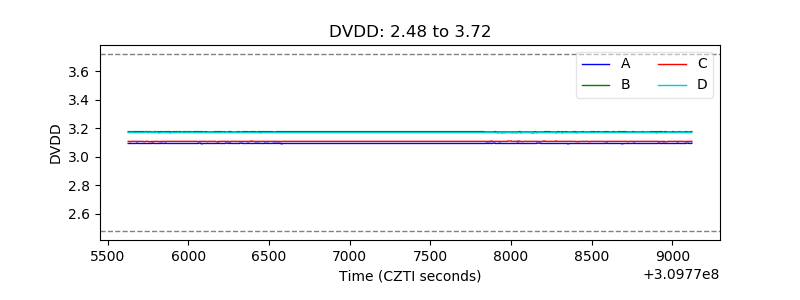 |
| Temperature 1 | 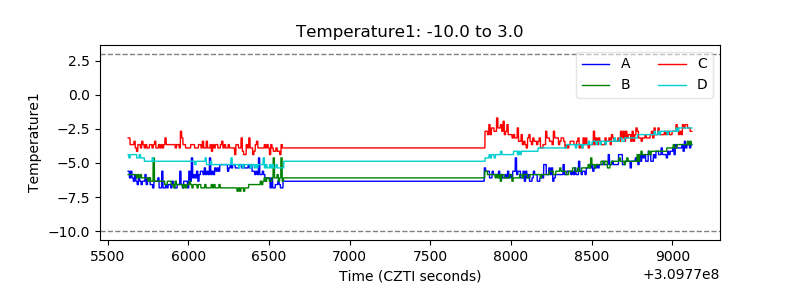 |
| Veto HV Monitor | 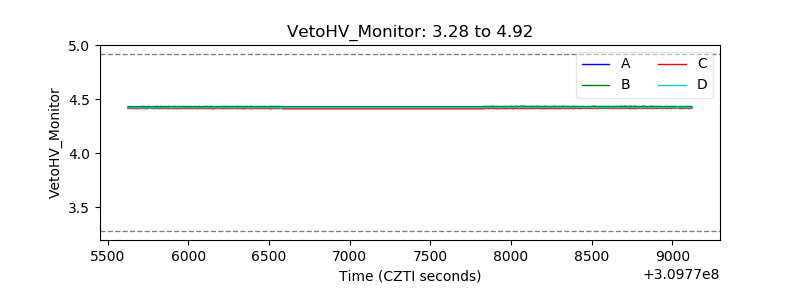 |
| Veto LLD | 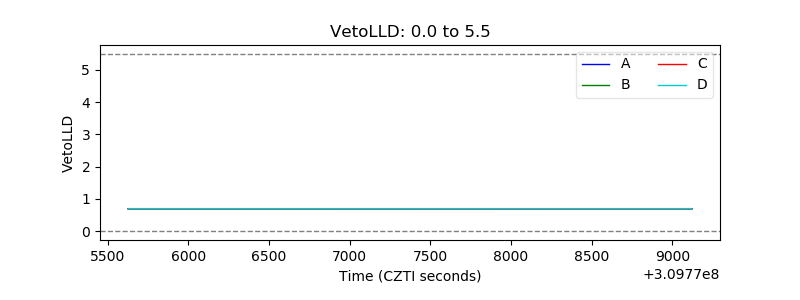 |
| Alpha Counter | 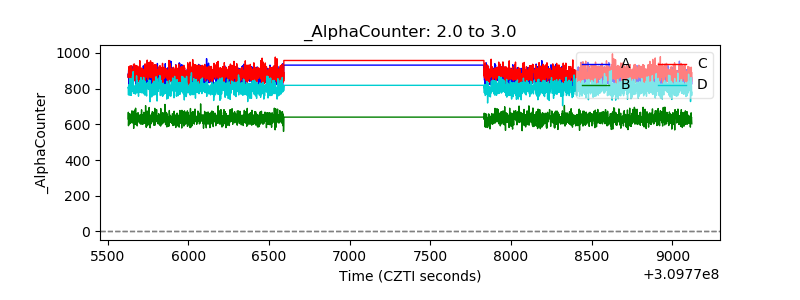 |
| _CPM_Rate | 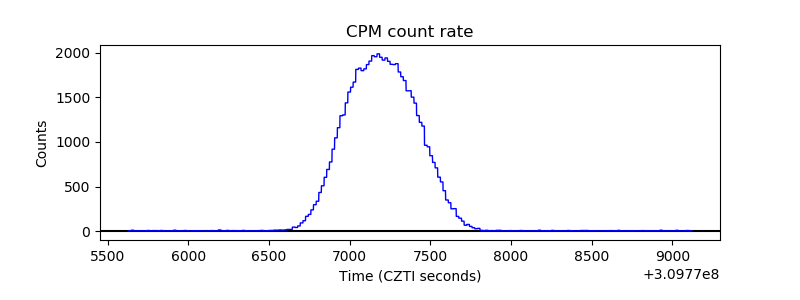 |
| CZT Counter | 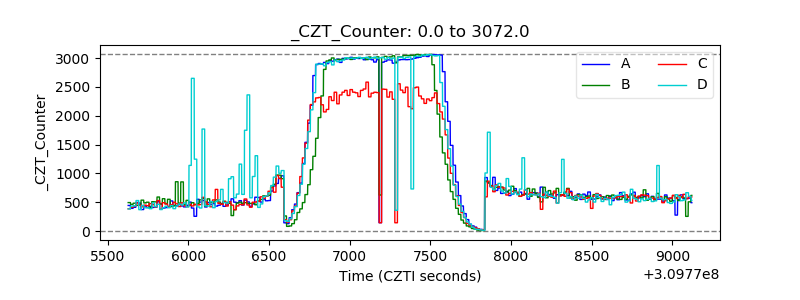 |
| +2.5 Volts monitor |  |
| +5 Volts monitor | 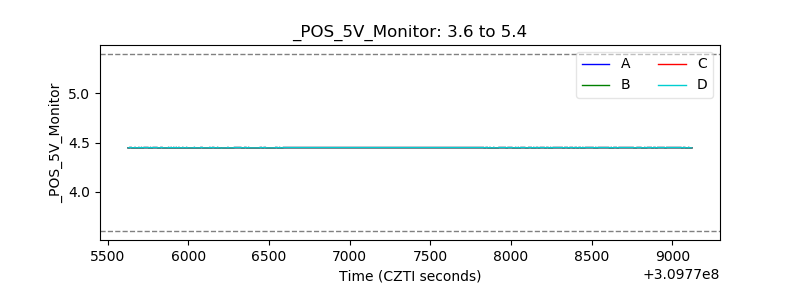 |
| _ROLL_ROT | 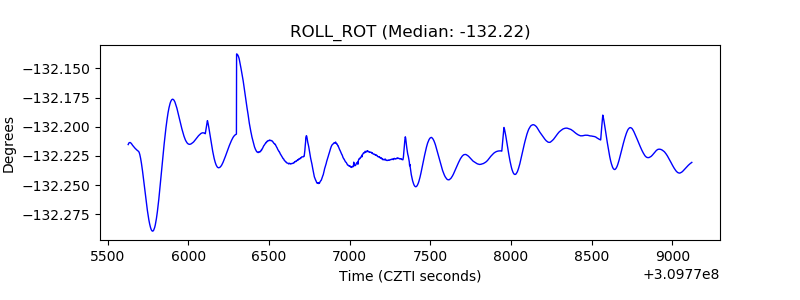 |
| _Roll_DEC | 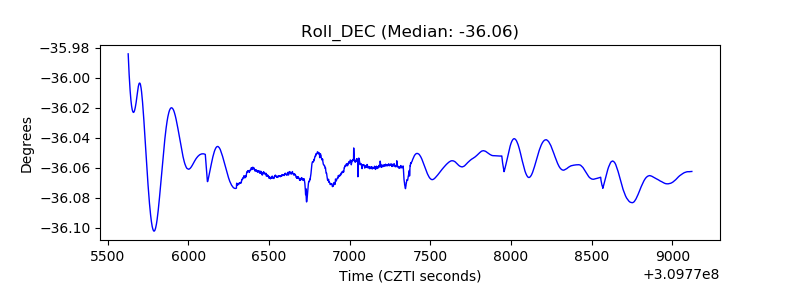 |
| _Roll_RA | 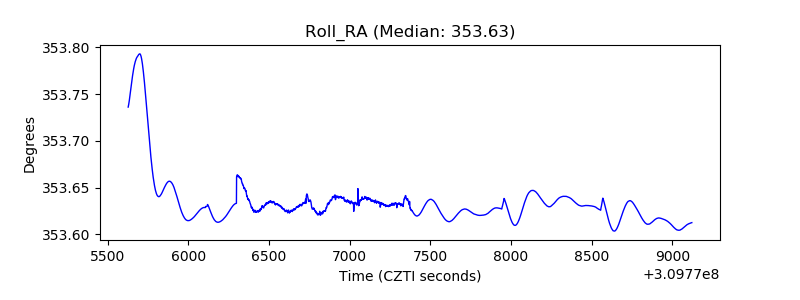 |
| Veto Counter | 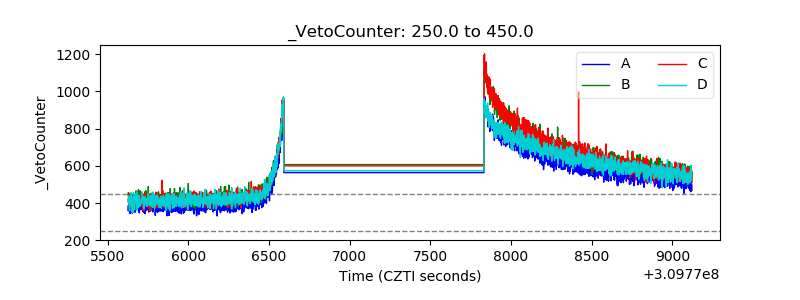 |