| Param | Original file | Final file |
|---|---|---|
| Filename | modeM0/AS1A07_027T02_9000003258_22044cztM0_level2.evt | modeM0/AS1A07_027T02_9000003258_22044cztM0_level2_quad_clean.evt |
| Size (bytes) | 547,833,600 | 103,599,360 |
| Size | 522.5 MB | 98.8 MB |
| Events in quadrant A | 3,732,628 | 681,487 |
| Events in quadrant B | 3,864,476 | 690,826 |
| Events in quadrant C | 4,129,967 | 646,152 |
| Events in quadrant D | 4,402,512 | 644,659 |
| Mode SS | |||
|---|---|---|---|
| Quadrant | BADHDUFLAG | Total packets | Discarded packets |
| A | 0 | 142 | 0 |
| B | 0 | 142 | 0 |
| C | 0 | 142 | 0 |
| D | 0 | 142 | 0 |
| Mode M9 | |||
|---|---|---|---|
| Quadrant | BADHDUFLAG | Total packets | Discarded packets |
| A | 0 | 25 | 0 |
| B | 0 | 25 | 0 |
| C | 0 | 25 | 0 |
| D | 0 | 25 | 0 |
| Mode M0 | |||
|---|---|---|---|
| Quadrant | BADHDUFLAG | Total packets | Discarded packets |
| A | 0 | 15549 | 2 |
| B | 0 | 15862 | 3 |
| C | 0 | 16798 | 2 |
| D | 0 | 17681 | 2 |
| Quadrant | Total seconds | Saturated seconds | Saturation percentage |
|---|---|---|---|
| A | 6801 | 124 | 1.823261% |
| B | 6801 | 150 | 2.205558% |
| C | 6801 | 330 | 4.852228% |
| D | 6801 | 263 | 3.867078% |
Noise dominated data is calculated using 1-second bins in cleaned event files. If a bin has >2000 counts, and if more than 50% of those come from <1% of pixels, then it is considered to be noise-dominated and hence unusable.
| Quadrant | # 1 sec bins | Bins with >0 counts | Bins with >2000 counts | High rate bins dominated by noise | Noise dominated (total time) | Noise dominated (detector-on time) | Marked lightcurve |
|---|---|---|---|---|---|---|---|
| A | 9351 | 6801 | 0 | 0 | 0.00% | 0.00% | 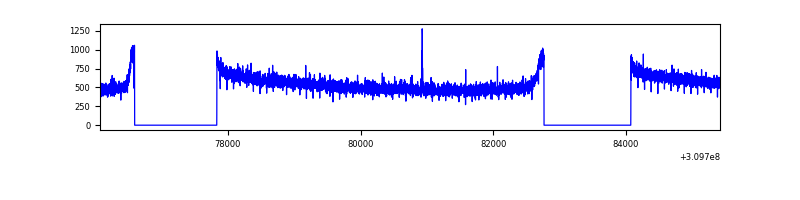 |
| B | 9351 | 6801 | 13 | 13 | 0.14% | 0.19% | 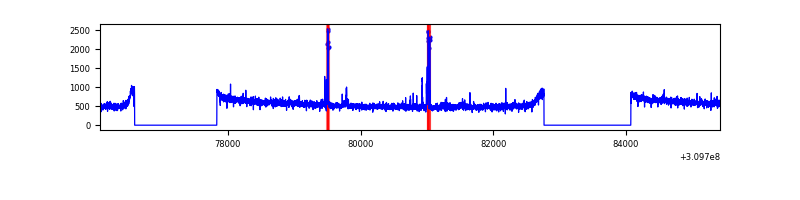 |
| C | 9351 | 6801 | 116 | 116 | 1.24% | 1.71% | 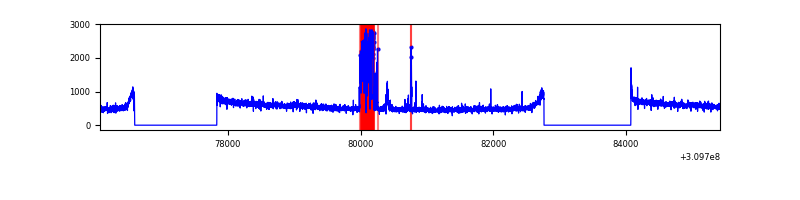 |
| D | 9351 | 6801 | 151 | 151 | 1.61% | 2.22% | 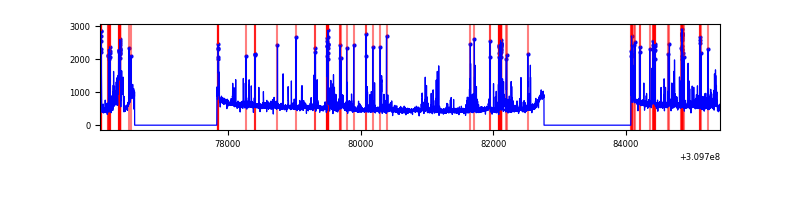 |
Top three noisy pixels from each quadrant. If the there are fewer than three noisy pixels in the level2.evt file, extra rows are filled as -1
| Pixel properties | Quadrant properties | ||||||
|---|---|---|---|---|---|---|---|
| Quadrant | DetID | PixID | Counts | Sigma | Mean | Median | Sigma |
| A | 13 | 254 | 9769 | 46.32 | 969 | 954 | 190.3 |
| A | 0 | 226 | 8519 | 39.75 | 969 | 954 | 190.3 |
| A | 3 | 137 | 7567 | 34.75 | 969 | 954 | 190.3 |
| B | 3 | 64 | 86648 | 482.86 | 959 | 941 | 177.5 |
| B | 12 | 111 | 20955 | 112.76 | 959 | 941 | 177.5 |
| B | 11 | 111 | 18561 | 99.27 | 959 | 941 | 177.5 |
| C | 10 | 22 | 421087 | 2015.9 | 911 | 918 | 208.4 |
| C | 14 | 238 | 146406 | 698.03 | 911 | 918 | 208.4 |
| C | 8 | 208 | 7299 | 30.62 | 911 | 918 | 208.4 |
| D | 11 | 176 | 663903 | 2996.16 | 931 | 907 | 221.3 |
| D | 1 | 52 | 146035 | 655.85 | 931 | 907 | 221.3 |
| D | 2 | 136 | 41239 | 182.26 | 931 | 907 | 221.3 |
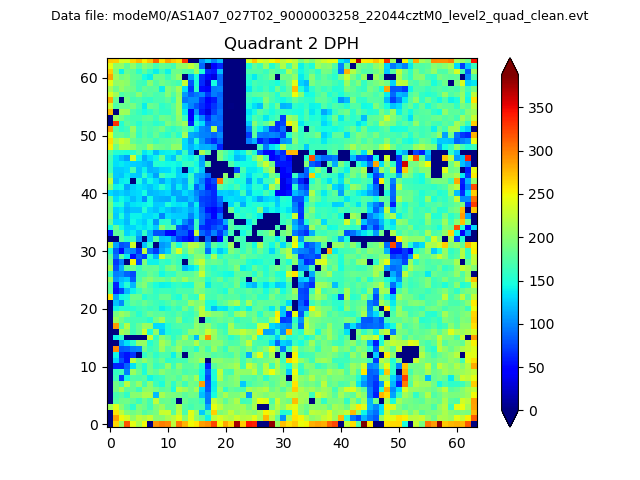
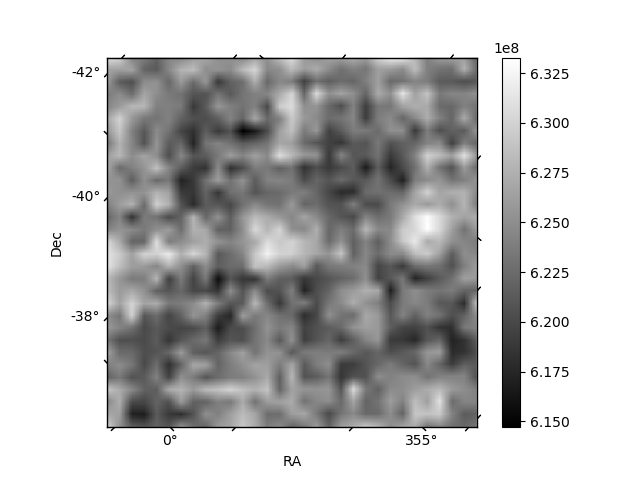
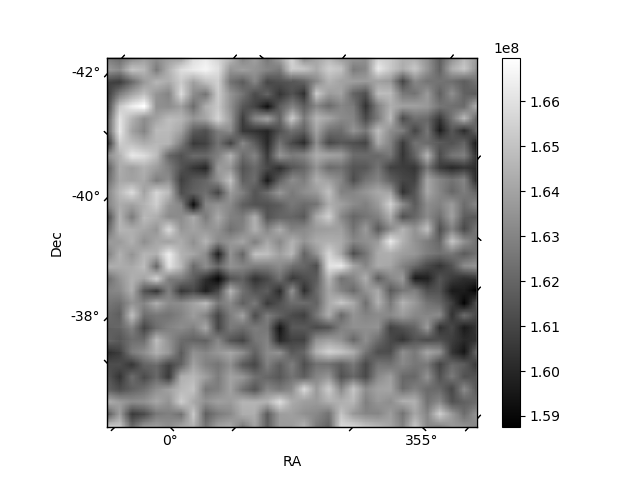
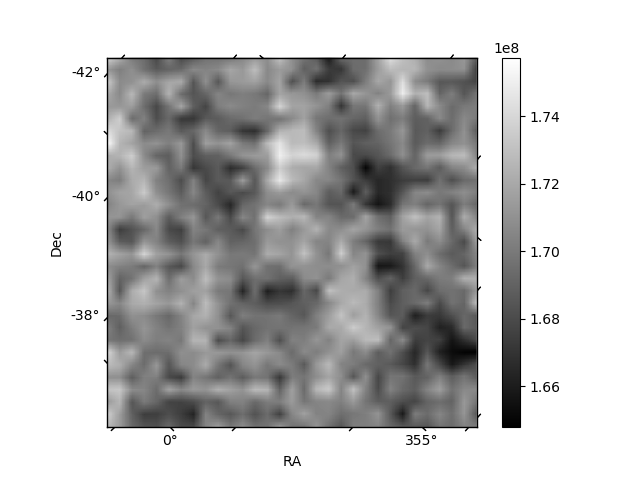
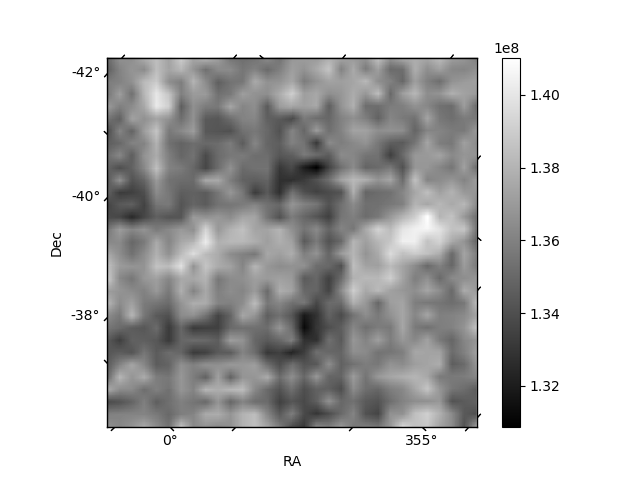
Histogram calculated using DETX and DETY for each event in the final _common_clean file
| Quadrant A | 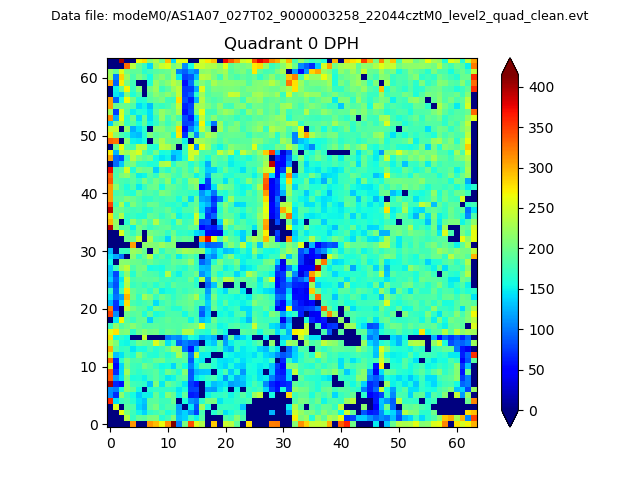 |
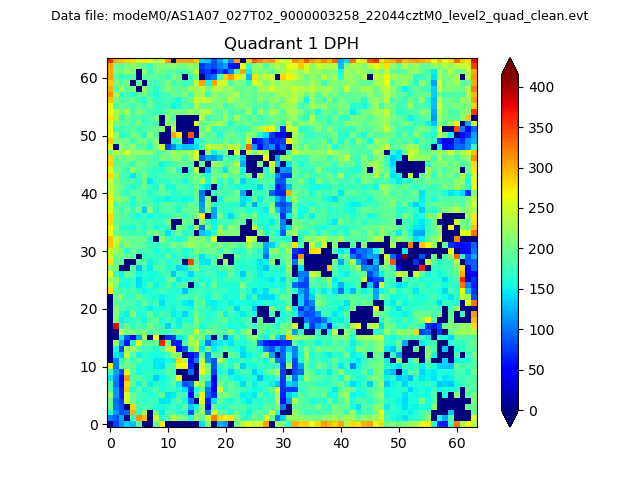 |
Quadrant B |
|---|---|---|---|
| Quadrant D | 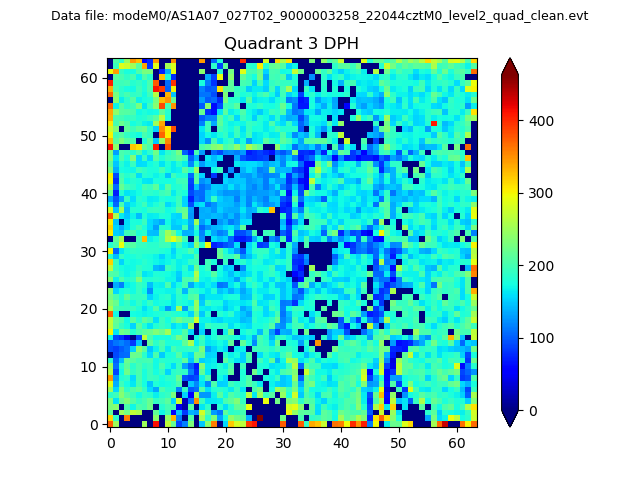 |
 |
Quadrant C |
| Plot type | Count rate plots | Images |
|---|---|---|
| Comparison with Poisson distribution Blue bars denote a histogram of data divided into 1 sec bins. Red curve is a Poisson curve with rate = median count rate of data. |
 |
 |
| Quadrant-wise count rates Data is divided into 100 sec bins |
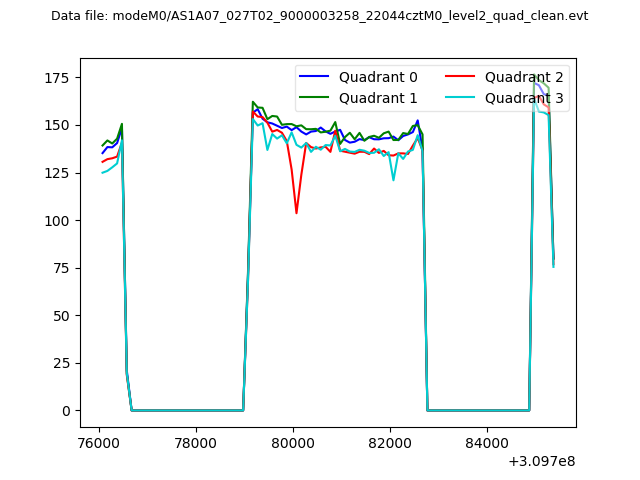 |
|
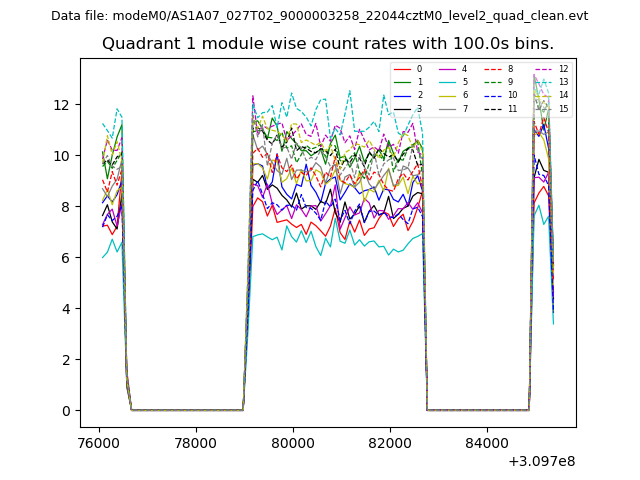
| Module-wise count rates for Quadrant A Data is divided into 100 sec bins |
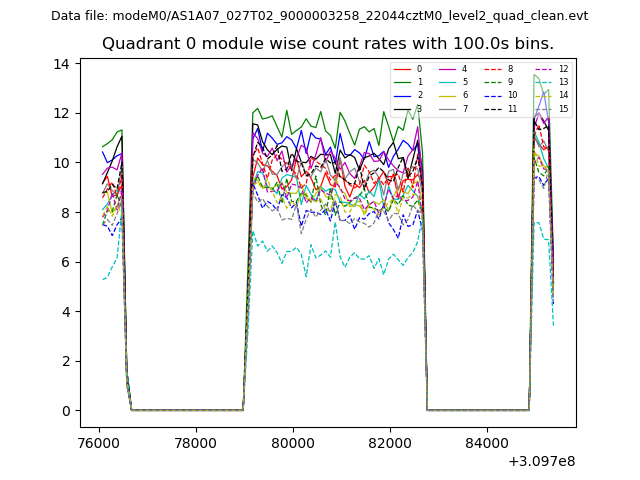 |
 |
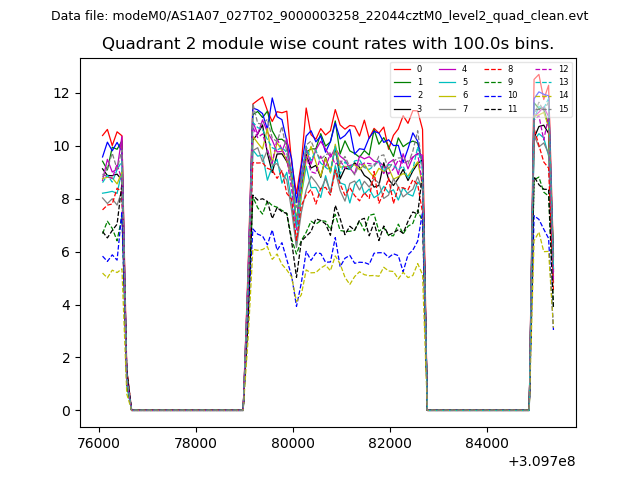
| Module-wise count rates for Quadrant B Data is divided into 100 sec bins |
 |
 |
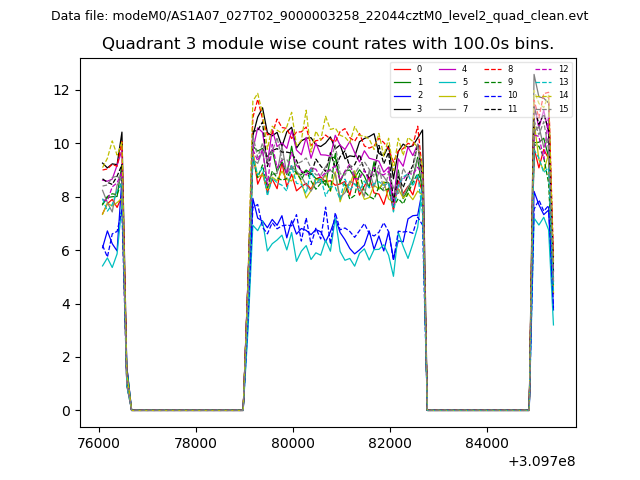
| Module-wise count rates for Quadrant C Data is divided into 100 sec bins |
 |
 |
| Module-wise count rates for Quadrant D Data is divided into 100 sec bins |
 |
 |
| Parameter | Plot |
|---|---|
| CZT HV Monitor | 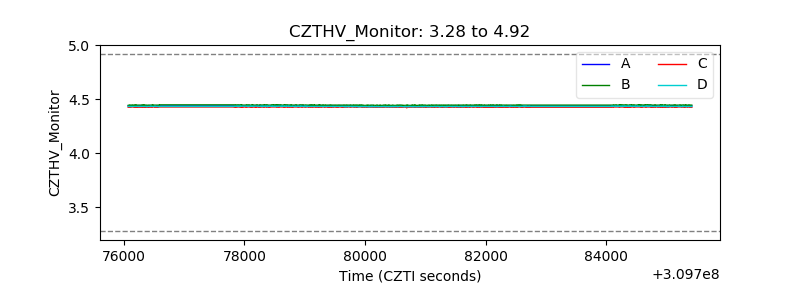 |
| D_VDD | 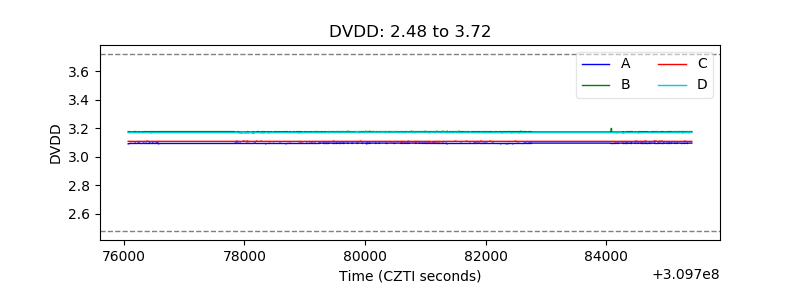 |
| Temperature 1 | 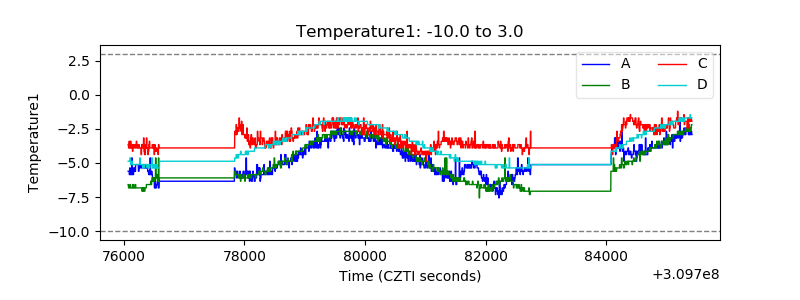 |
| Veto HV Monitor | 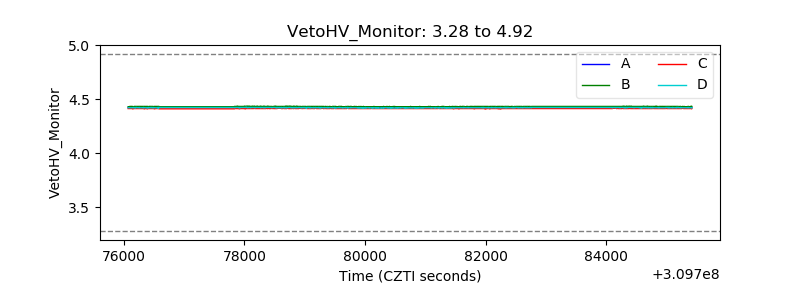 |
| Veto LLD | 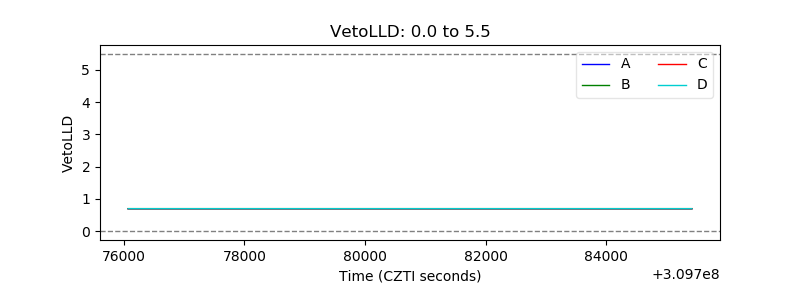 |
| Alpha Counter | 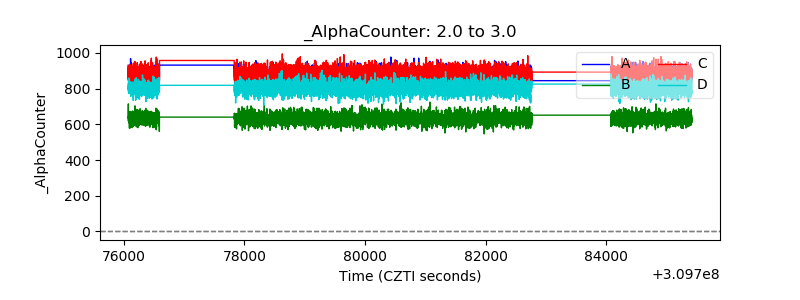 |
| _CPM_Rate |  |
| CZT Counter | 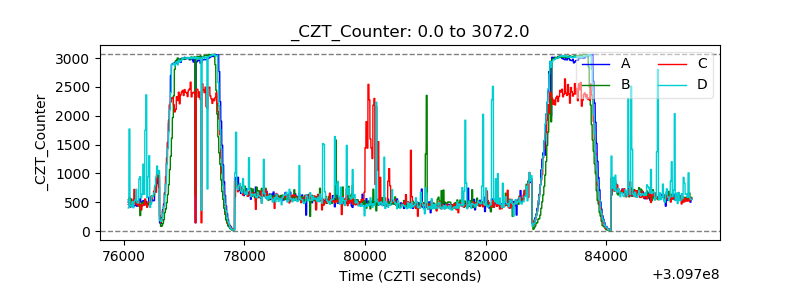 |
| +2.5 Volts monitor |  |
| +5 Volts monitor |  |
| _ROLL_ROT | 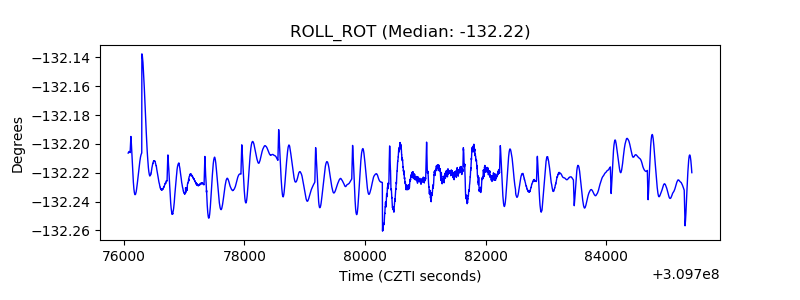 |
| _Roll_DEC | 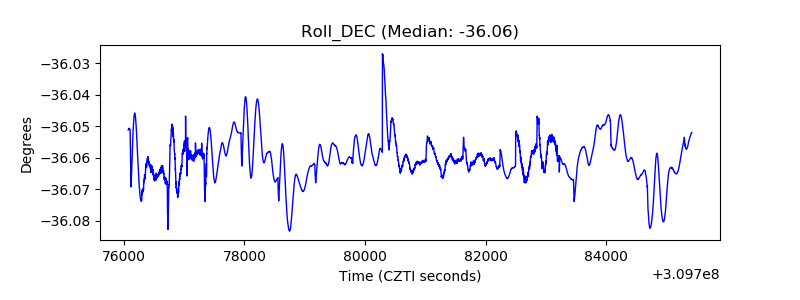 |
| _Roll_RA | 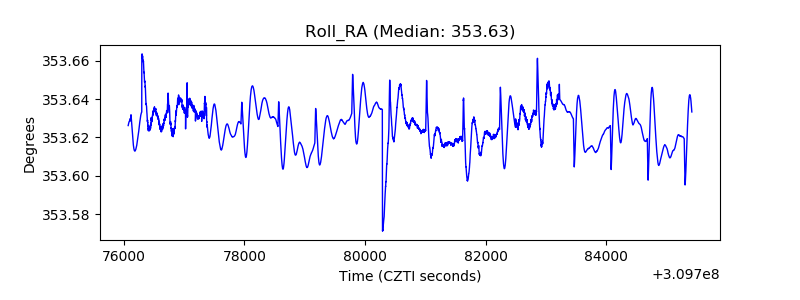 |
| Veto Counter | 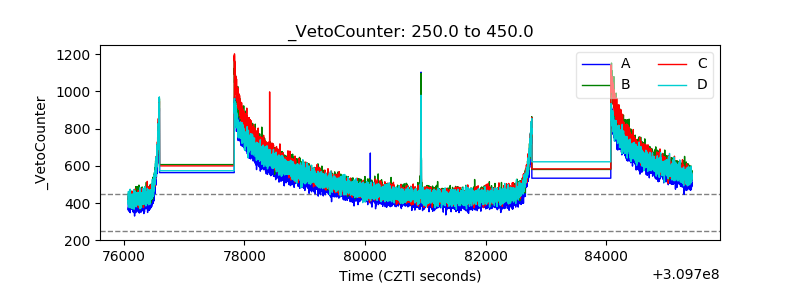 |