| Param | Original file | Final file |
|---|---|---|
| Filename | modeM0/AS1A07_027T02_9000003258_22045cztM0_level2.evt | modeM0/AS1A07_027T02_9000003258_22045cztM0_level2_quad_clean.evt |
| Size (bytes) | 324,512,640 | 74,831,040 |
| Size | 309.5 MB | 71.4 MB |
| Events in quadrant A | 2,225,288 | 506,423 |
| Events in quadrant B | 2,419,477 | 508,104 |
| Events in quadrant C | 2,198,956 | 479,272 |
| Events in quadrant D | 2,694,777 | 473,365 |
| Mode SS | |||
|---|---|---|---|
| Quadrant | BADHDUFLAG | Total packets | Discarded packets |
| A | 0 | 86 | 0 |
| B | 0 | 86 | 0 |
| C | 0 | 86 | 0 |
| D | 0 | 86 | 0 |
| Mode M9 | |||
|---|---|---|---|
| Quadrant | BADHDUFLAG | Total packets | Discarded packets |
| A | 0 | 10 | 0 |
| B | 0 | 11 | 0 |
| C | 0 | 11 | 0 |
| D | 0 | 11 | 0 |
| Mode M0 | |||
|---|---|---|---|
| Quadrant | BADHDUFLAG | Total packets | Discarded packets |
| A | 0 | 9376 | 1 |
| B | 0 | 9919 | 1 |
| C | 0 | 9341 | 1 |
| D | 0 | 10857 | 1 |
| Quadrant | Total seconds | Saturated seconds | Saturation percentage |
|---|---|---|---|
| A | 4242 | 13 | 0.306459% |
| B | 4242 | 50 | 1.178689% |
| C | 4242 | 40 | 0.942951% |
| D | 4242 | 74 | 1.744460% |
Noise dominated data is calculated using 1-second bins in cleaned event files. If a bin has >2000 counts, and if more than 50% of those come from <1% of pixels, then it is considered to be noise-dominated and hence unusable.
| Quadrant | # 1 sec bins | Bins with >0 counts | Bins with >2000 counts | High rate bins dominated by noise | Noise dominated (total time) | Noise dominated (detector-on time) | Marked lightcurve |
|---|---|---|---|---|---|---|---|
| A | 4242 | 4242 | 0 | 0 | 0.00% | 0.00% | 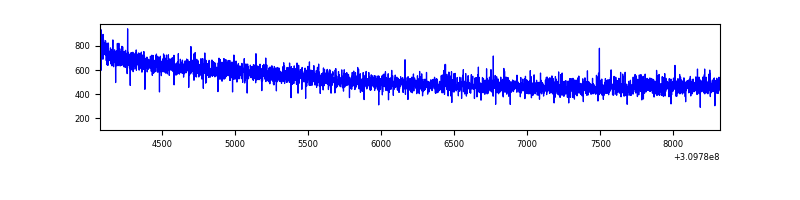 |
| B | 4242 | 4242 | 28 | 28 | 0.66% | 0.66% | 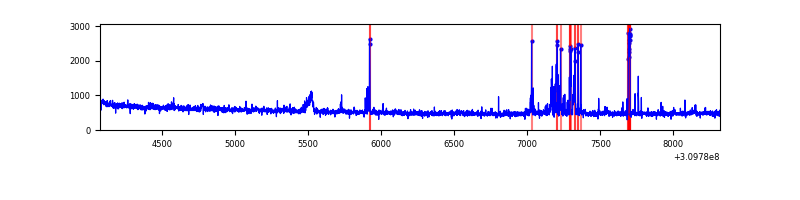 |
| C | 4242 | 4242 | 0 | 0 | 0.00% | 0.00% | 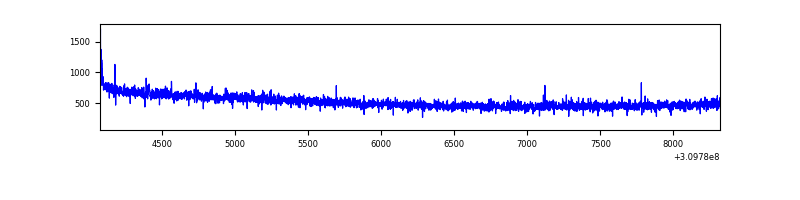 |
| D | 4242 | 4242 | 60 | 60 | 1.41% | 1.41% |  |
Top three noisy pixels from each quadrant. If the there are fewer than three noisy pixels in the level2.evt file, extra rows are filled as -1
| Pixel properties | Quadrant properties | ||||||
|---|---|---|---|---|---|---|---|
| Quadrant | DetID | PixID | Counts | Sigma | Mean | Median | Sigma |
| A | 3 | 1 | 6749 | 54.4 | 576 | 567 | 113.6 |
| A | 13 | 254 | 6430 | 51.6 | 576 | 567 | 113.6 |
| A | 0 | 226 | 5091 | 39.81 | 576 | 567 | 113.6 |
| B | 4 | 171 | 104787 | 991.93 | 567 | 556 | 105.1 |
| B | 3 | 64 | 54041 | 509.0 | 567 | 556 | 105.1 |
| B | 0 | 197 | 20790 | 192.56 | 567 | 556 | 105.1 |
| C | 14 | 238 | 88641 | 713.15 | 538 | 542 | 123.5 |
| C | 10 | 22 | 8226 | 62.2 | 538 | 542 | 123.5 |
| C | 8 | 208 | 5110 | 36.98 | 538 | 542 | 123.5 |
| D | 1 | 52 | 192727 | 1452.69 | 547 | 532 | 132.3 |
| D | 7 | 238 | 152554 | 1149.05 | 547 | 532 | 132.3 |
| D | 12 | 233 | 118458 | 891.33 | 547 | 532 | 132.3 |
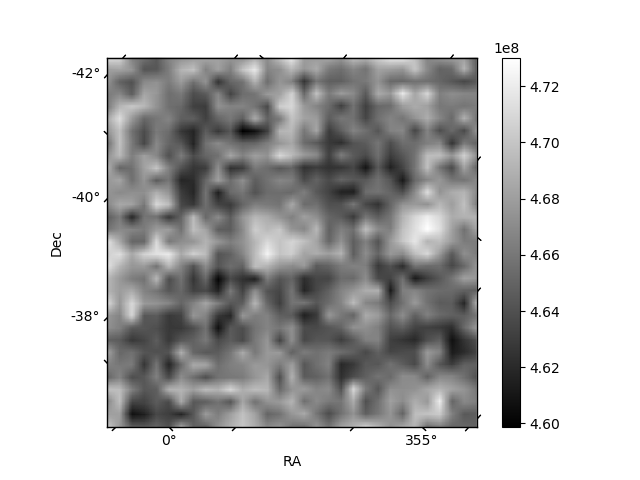
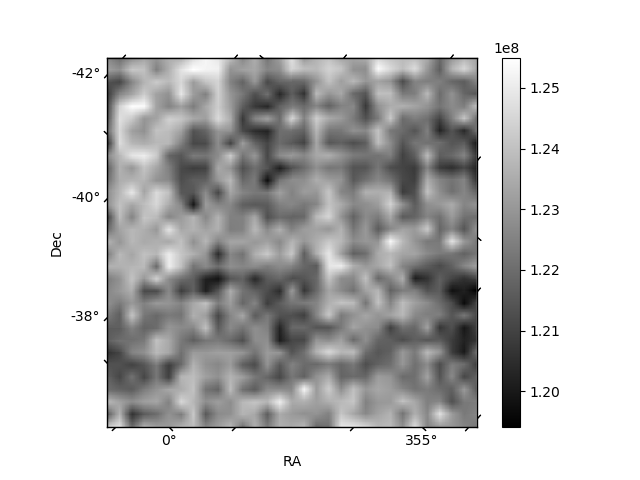
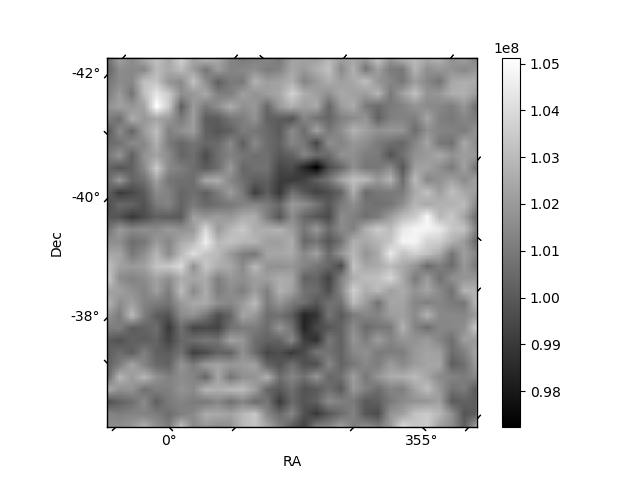
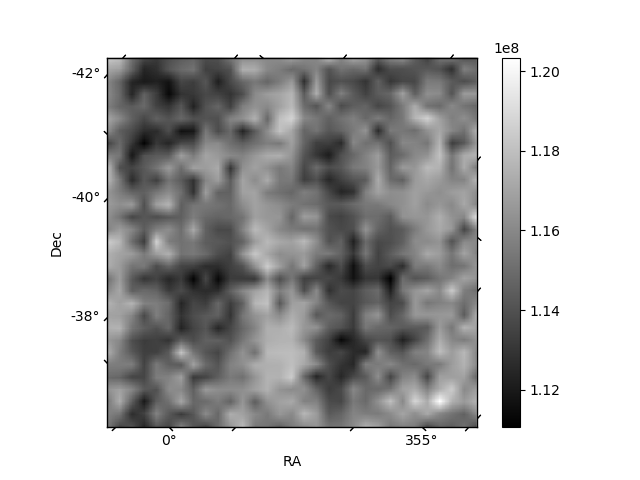
Histogram calculated using DETX and DETY for each event in the final _common_clean file
| Quadrant A |  |
 |
Quadrant B |
|---|---|---|---|
| Quadrant D | 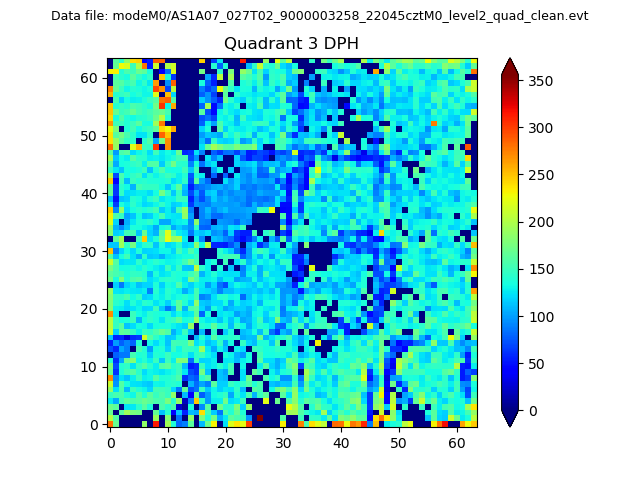 |
 |
Quadrant C |
| Plot type | Count rate plots | Images |
|---|---|---|
| Comparison with Poisson distribution Blue bars denote a histogram of data divided into 1 sec bins. Red curve is a Poisson curve with rate = median count rate of data. |
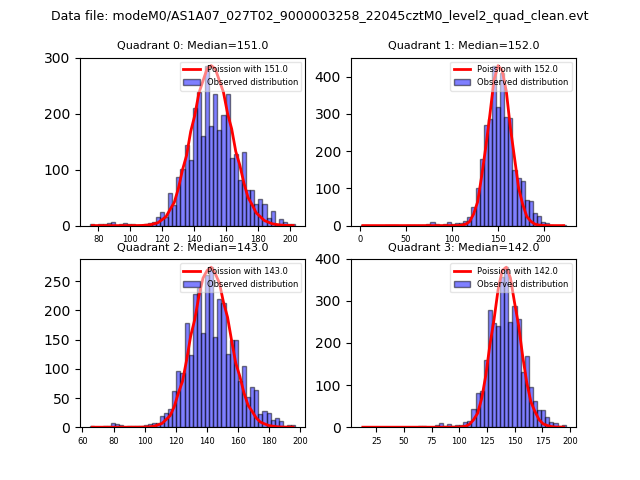 |
 |
| Quadrant-wise count rates Data is divided into 100 sec bins |
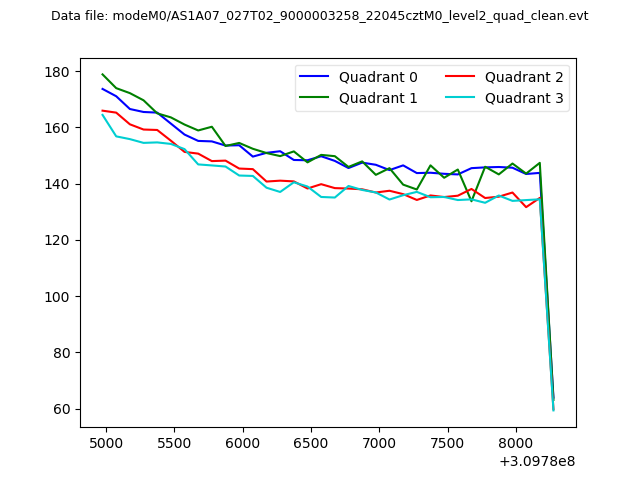 |
|
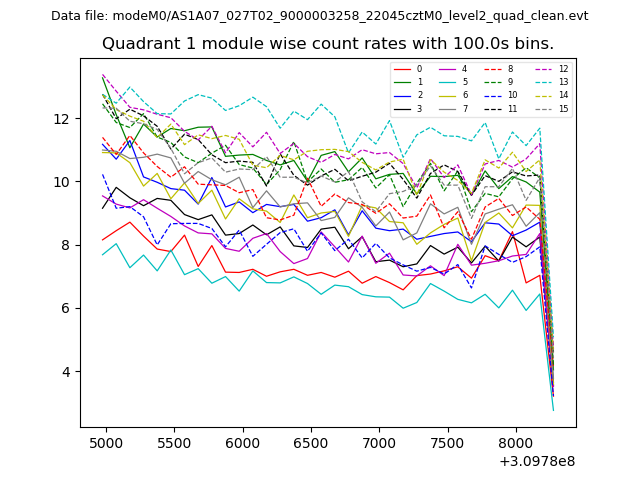
| Module-wise count rates for Quadrant A Data is divided into 100 sec bins |
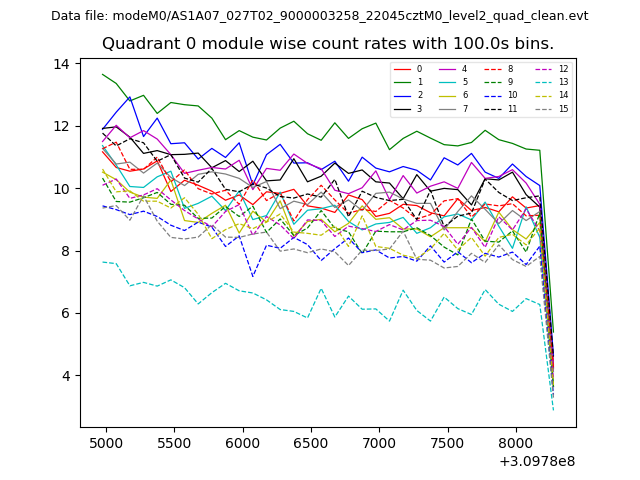 |
 |
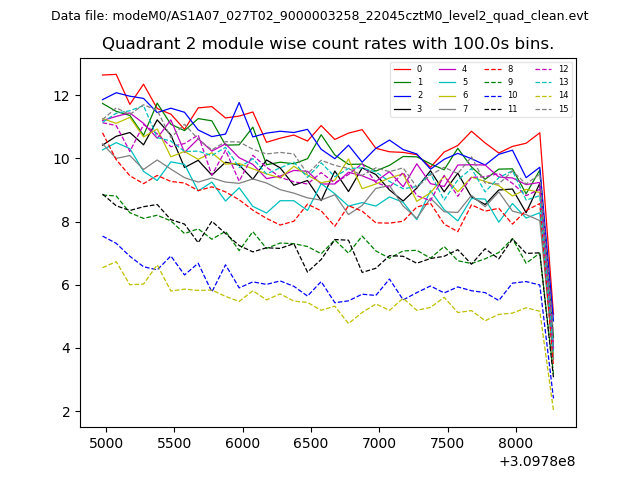
| Module-wise count rates for Quadrant B Data is divided into 100 sec bins |
 |
 |
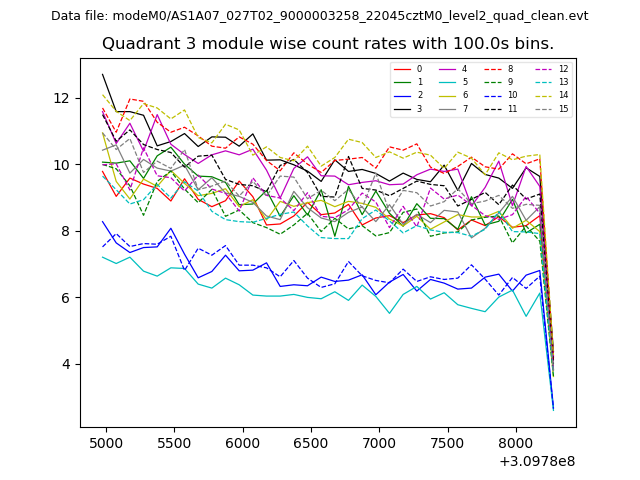
| Module-wise count rates for Quadrant C Data is divided into 100 sec bins |
 |
 |
| Module-wise count rates for Quadrant D Data is divided into 100 sec bins |
 |
 |
| Parameter | Plot |
|---|---|
| CZT HV Monitor | 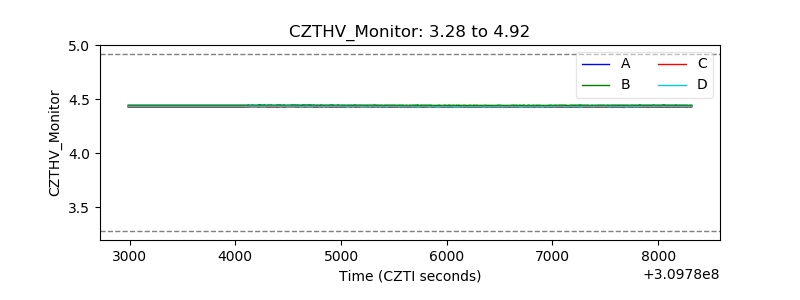 |
| D_VDD | 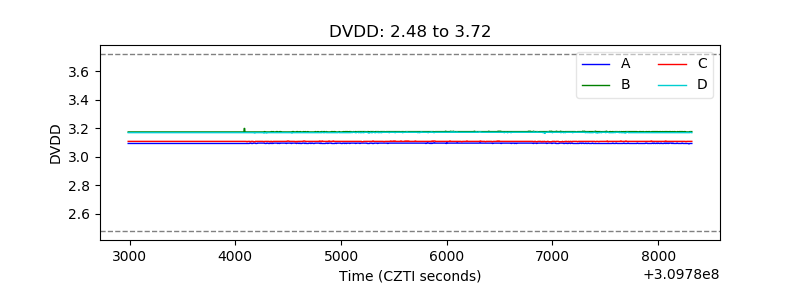 |
| Temperature 1 | 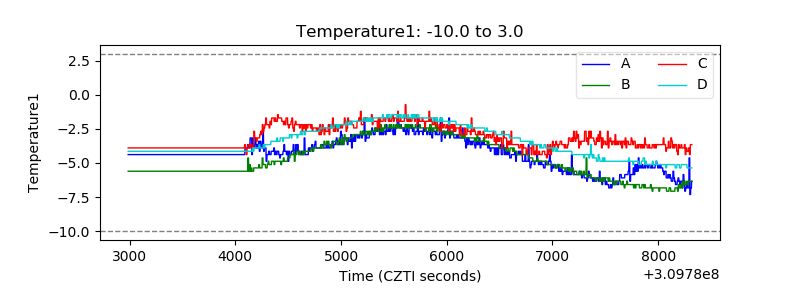 |
| Veto HV Monitor | 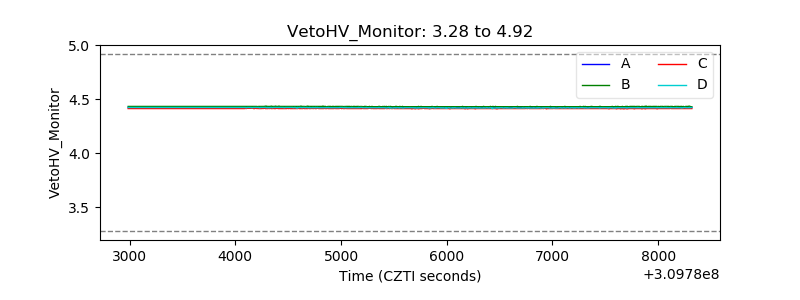 |
| Veto LLD | 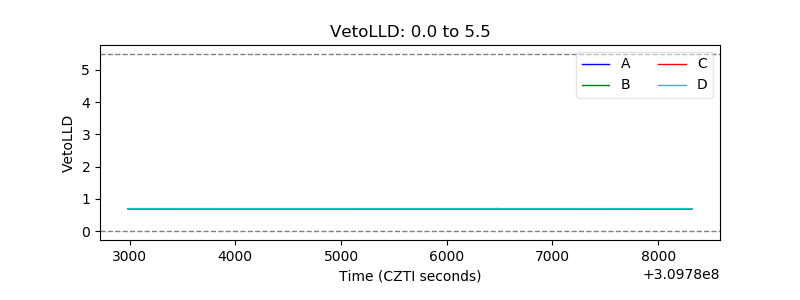 |
| Alpha Counter | 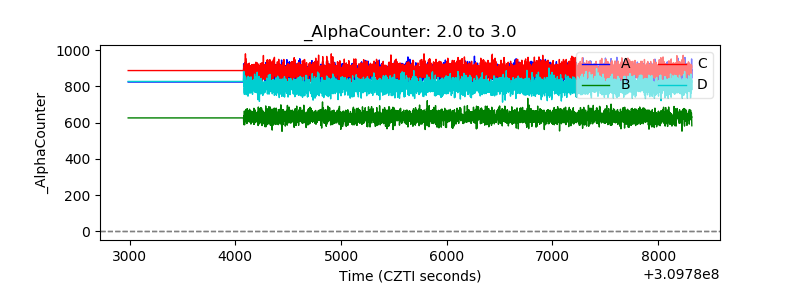 |
| _CPM_Rate | 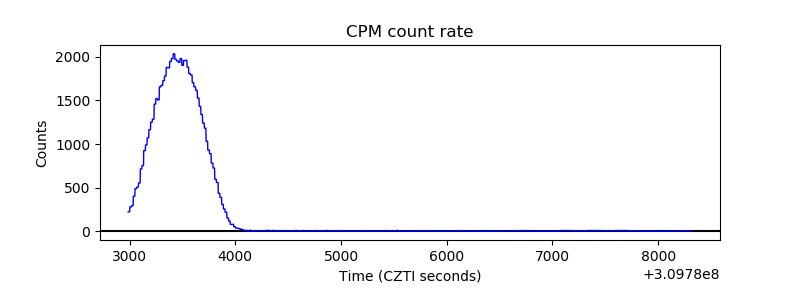 |
| CZT Counter |  |
| +2.5 Volts monitor |  |
| +5 Volts monitor | 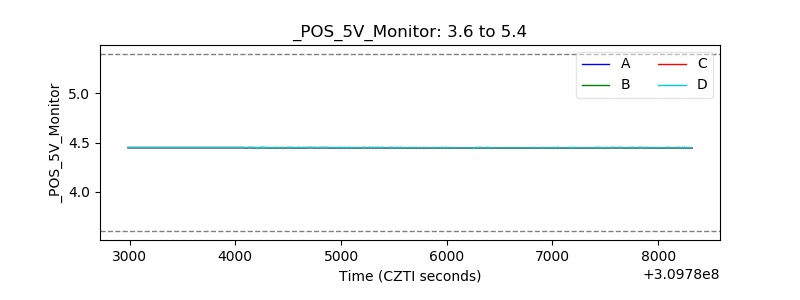 |
| _ROLL_ROT | 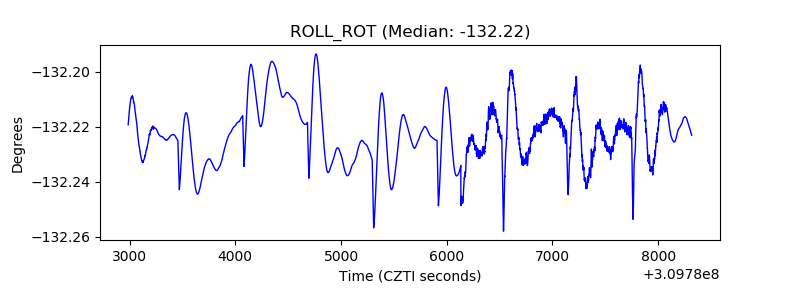 |
| _Roll_DEC | 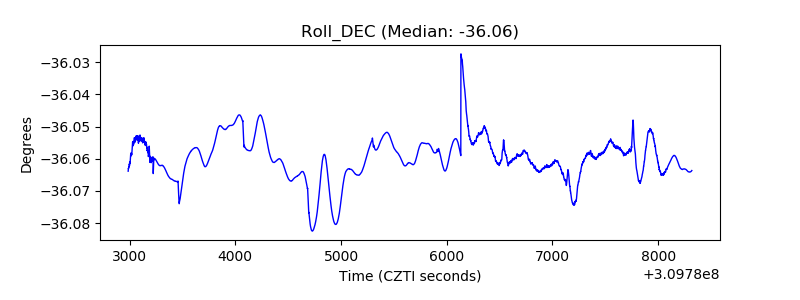 |
| _Roll_RA | 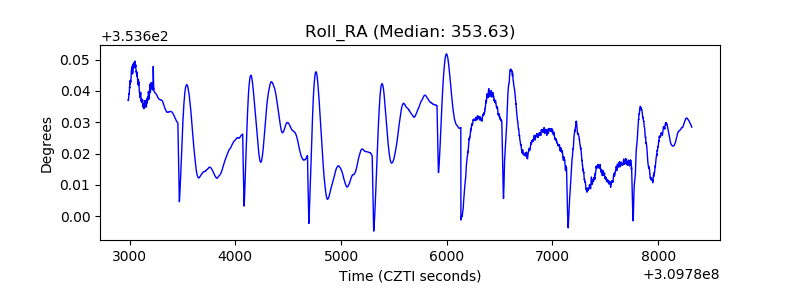 |
| Veto Counter | 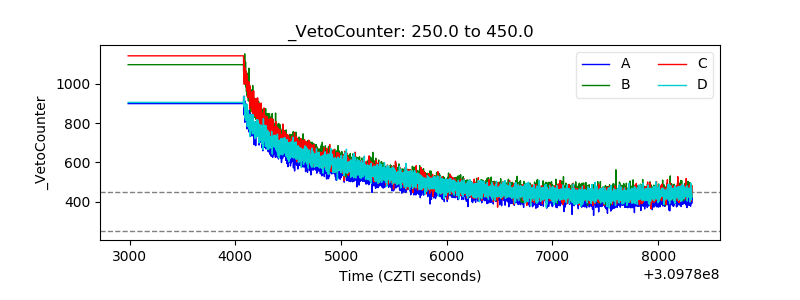 |