| Param | Original file | Final file |
|---|---|---|
| Filename | modeM0/AS1A07_047T08_9000003262_22047cztM0_level2.evt | modeM0/AS1A07_047T08_9000003262_22047cztM0_level2_quad_clean.evt |
| Size (bytes) | 291,816,000 | 72,034,560 |
| Size | 278.3 MB | 68.7 MB |
| Events in quadrant A | 1,787,283 | 497,493 |
| Events in quadrant B | 1,833,658 | 504,659 |
| Events in quadrant C | 1,789,574 | 480,740 |
| Events in quadrant D | 3,181,576 | 444,014 |
| Mode M9 | |||
|---|---|---|---|
| Quadrant | BADHDUFLAG | Total packets | Discarded packets |
| A | 0 | 10 | 0 |
| B | 0 | 10 | 0 |
| C | 0 | 10 | 0 |
| D | 0 | 10 | 0 |
| Mode M0 | |||
|---|---|---|---|
| Quadrant | BADHDUFLAG | Total packets | Discarded packets |
| A | 0 | 7560 | 1 |
| B | 0 | 7603 | 2 |
| C | 0 | 7540 | 1 |
| D | 0 | 11843 | 1 |
| Mode SS | |||
|---|---|---|---|
| Quadrant | BADHDUFLAG | Total packets | Discarded packets |
| A | 0 | 74 | 0 |
| B | 0 | 74 | 0 |
| C | 0 | 74 | 0 |
| D | 0 | 74 | 0 |
| Quadrant | Total seconds | Saturated seconds | Saturation percentage |
|---|---|---|---|
| A | 3593 | 71 | 1.976065% |
| B | 3592 | 88 | 2.449889% |
| C | 3592 | 74 | 2.060134% |
| D | 3592 | 456 | 12.694878% |
Noise dominated data is calculated using 1-second bins in cleaned event files. If a bin has >2000 counts, and if more than 50% of those come from <1% of pixels, then it is considered to be noise-dominated and hence unusable.
| Quadrant | # 1 sec bins | Bins with >0 counts | Bins with >2000 counts | High rate bins dominated by noise | Noise dominated (total time) | Noise dominated (detector-on time) | Marked lightcurve |
|---|---|---|---|---|---|---|---|
| A | 4593 | 3593 | 2 | 2 | 0.04% | 0.06% | 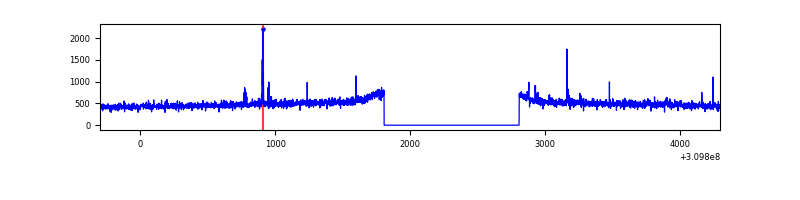 |
| B | 4592 | 3592 | 0 | 0 | 0.00% | 0.00% | 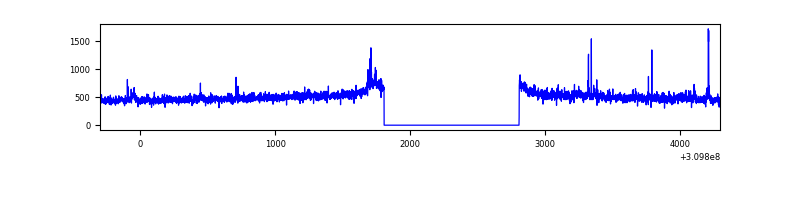 |
| C | 4592 | 3592 | 0 | 0 | 0.00% | 0.00% | 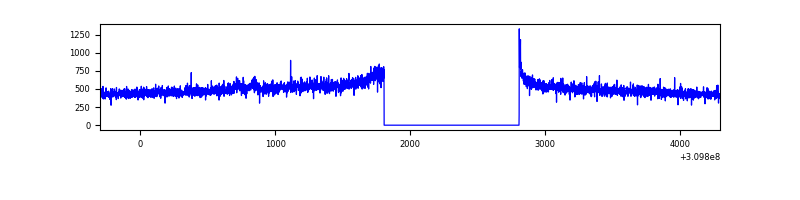 |
| D | 4592 | 3592 | 418 | 418 | 9.10% | 11.64% | 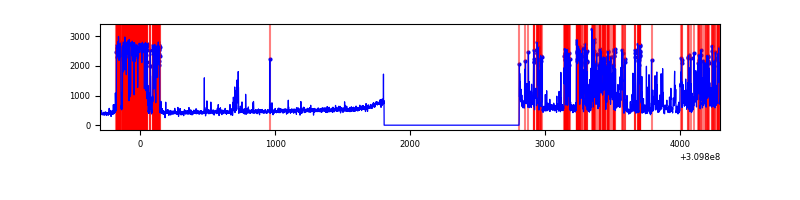 |
Top three noisy pixels from each quadrant. If the there are fewer than three noisy pixels in the level2.evt file, extra rows are filled as -1
| Pixel properties | Quadrant properties | ||||||
|---|---|---|---|---|---|---|---|
| Quadrant | DetID | PixID | Counts | Sigma | Mean | Median | Sigma |
| A | 5 | 16 | 24541 | 261.2 | 454 | 446 | 92.2 |
| A | 15 | 236 | 9239 | 95.32 | 454 | 446 | 92.2 |
| A | 13 | 254 | 5547 | 55.3 | 454 | 446 | 92.2 |
| B | 0 | 230 | 24041 | 275.78 | 453 | 441 | 85.6 |
| B | 12 | 111 | 9977 | 111.43 | 453 | 441 | 85.6 |
| B | 0 | 229 | 9692 | 108.1 | 453 | 441 | 85.6 |
| C | 14 | 238 | 69206 | 678.04 | 437 | 440 | 101.4 |
| C | 10 | 22 | 8733 | 81.77 | 437 | 440 | 101.4 |
| C | 0 | 10 | 4219 | 37.26 | 437 | 440 | 101.4 |
| D | 12 | 233 | 704222 | 6895.3 | 424 | 411 | 102.1 |
| D | 11 | 176 | 318474 | 3116.09 | 424 | 411 | 102.1 |
| D | 5 | 222 | 285170 | 2789.81 | 424 | 411 | 102.1 |
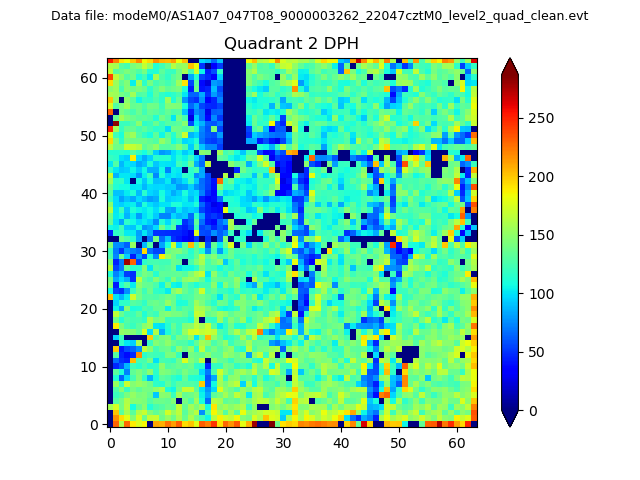
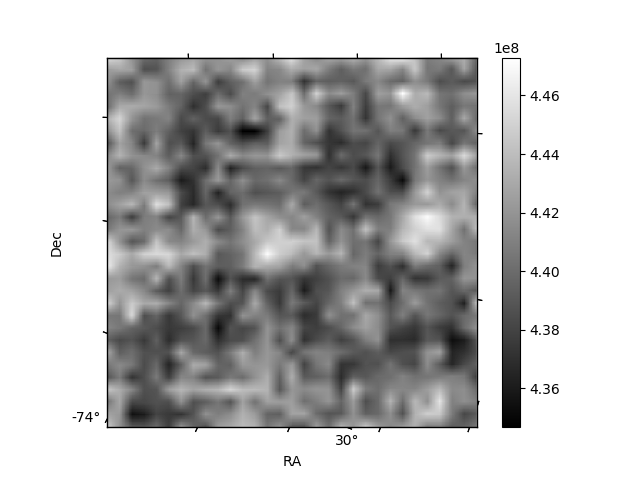
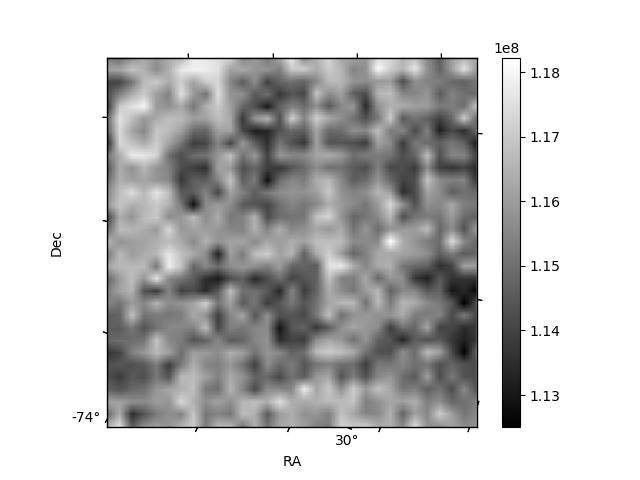
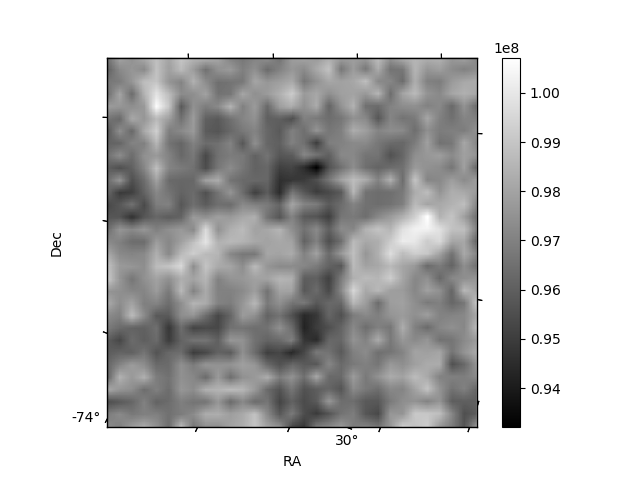
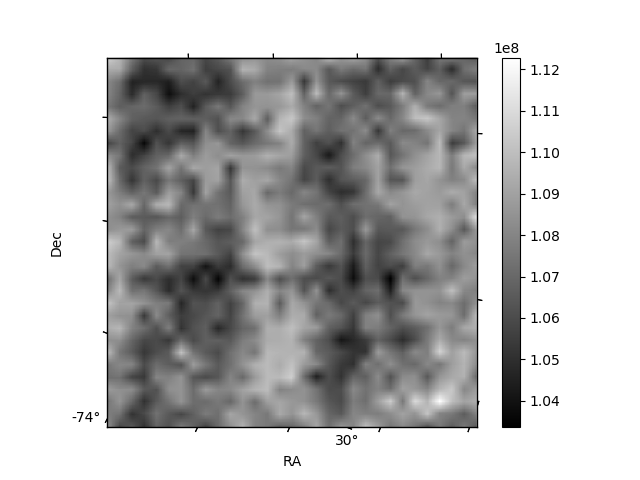
Histogram calculated using DETX and DETY for each event in the final _common_clean file
| Quadrant A | 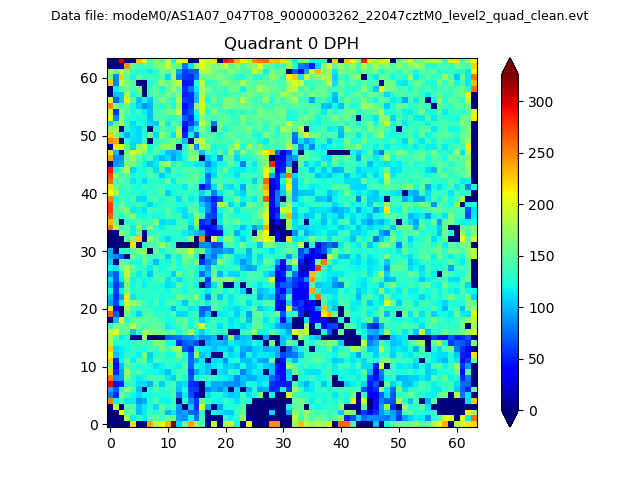 |
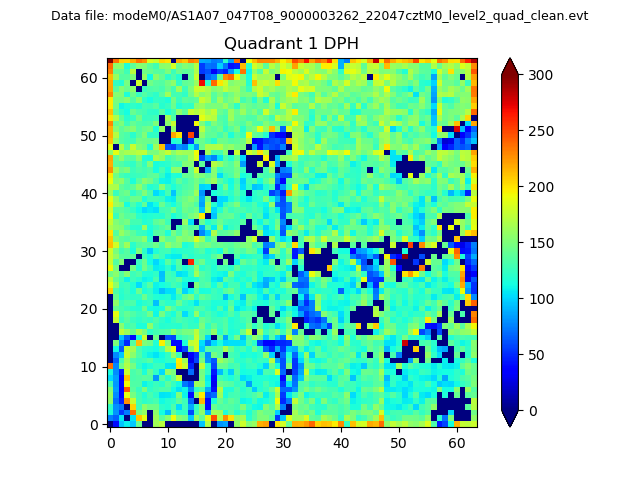 |
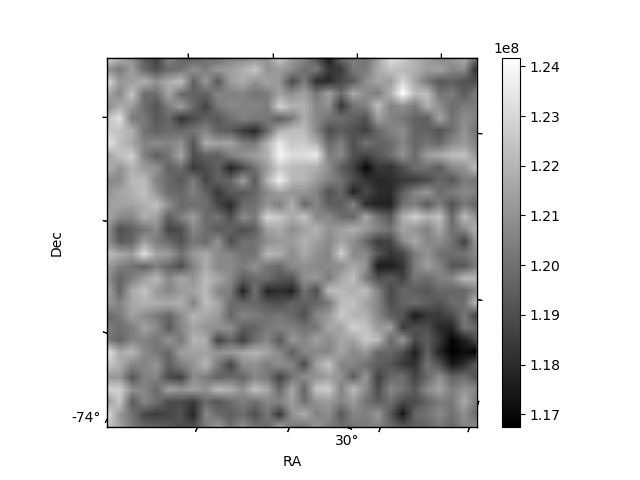
Quadrant B |
|---|---|---|---|
| Quadrant D | 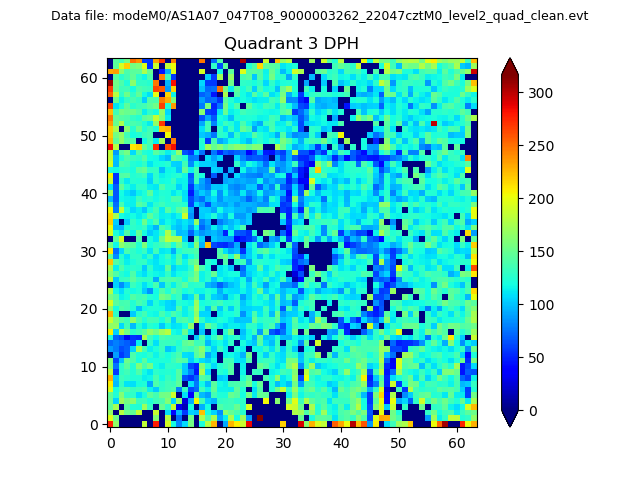 |
 |
Quadrant C |
| Plot type | Count rate plots | Images |
|---|---|---|
| Comparison with Poisson distribution Blue bars denote a histogram of data divided into 1 sec bins. Red curve is a Poisson curve with rate = median count rate of data. |
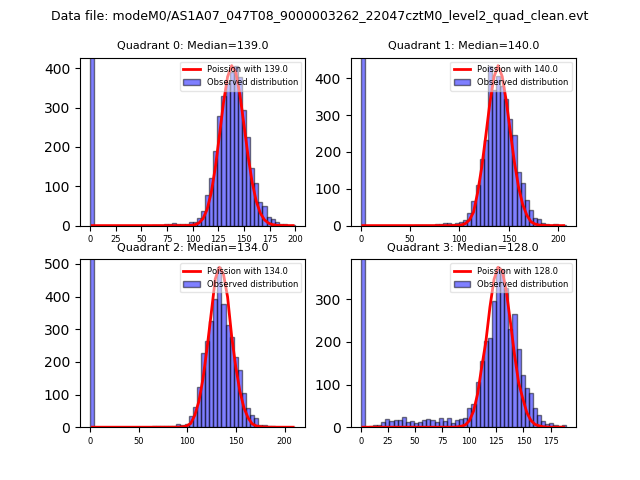 |
 |
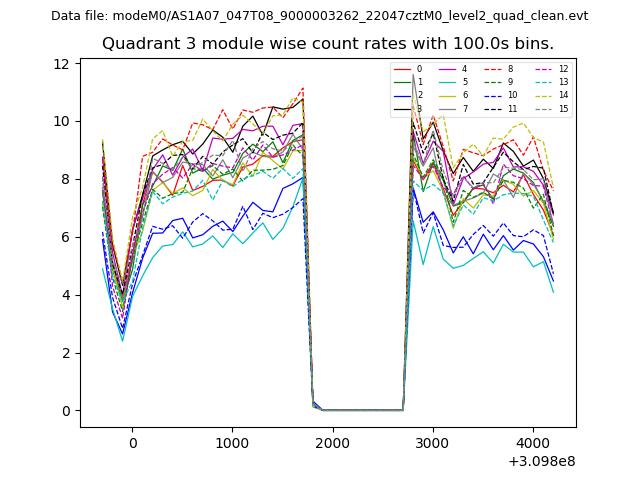
| Quadrant-wise count rates Data is divided into 100 sec bins |
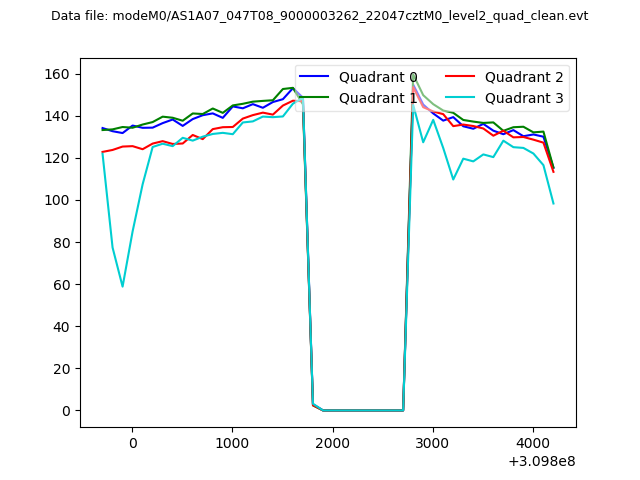 |
|
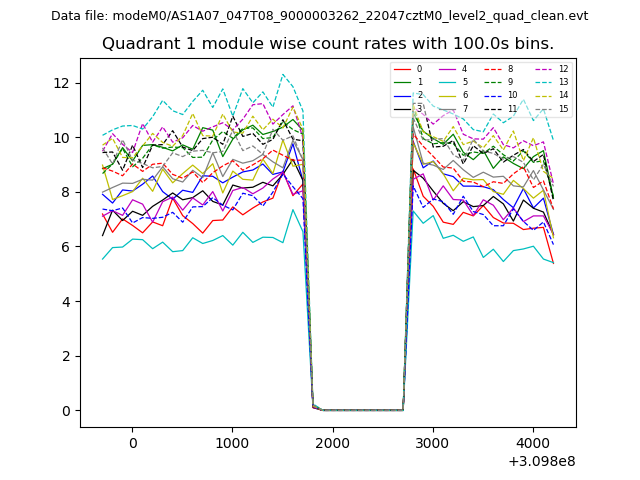
| Module-wise count rates for Quadrant A Data is divided into 100 sec bins |
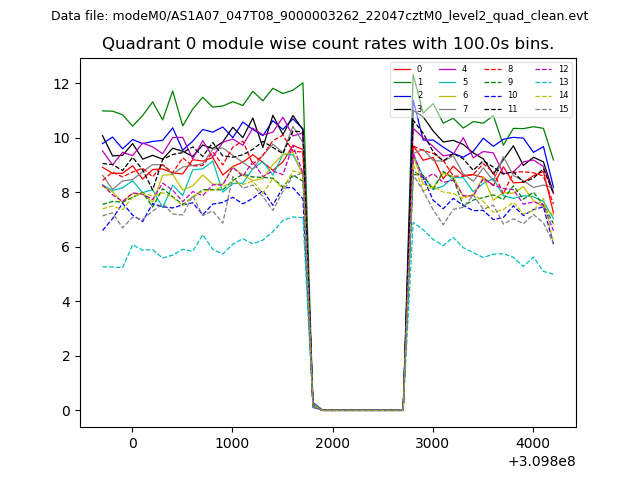 |
 |
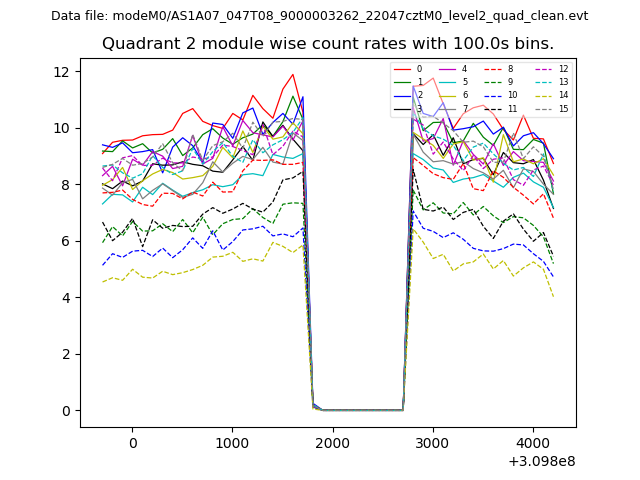
| Module-wise count rates for Quadrant B Data is divided into 100 sec bins |
 |
 |
| Module-wise count rates for Quadrant C Data is divided into 100 sec bins |
 |
 |
| Module-wise count rates for Quadrant D Data is divided into 100 sec bins |
 |
 |
| Parameter | Plot |
|---|---|
| CZT HV Monitor | 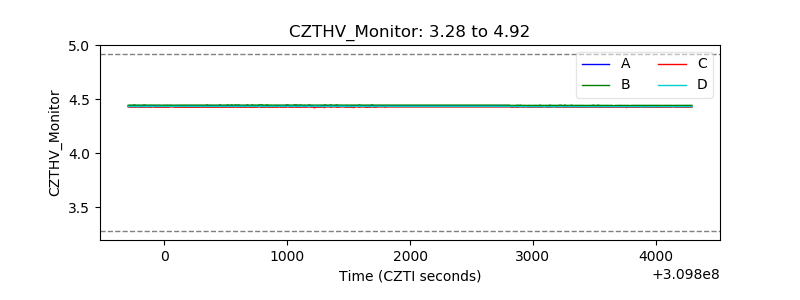 |
| D_VDD | 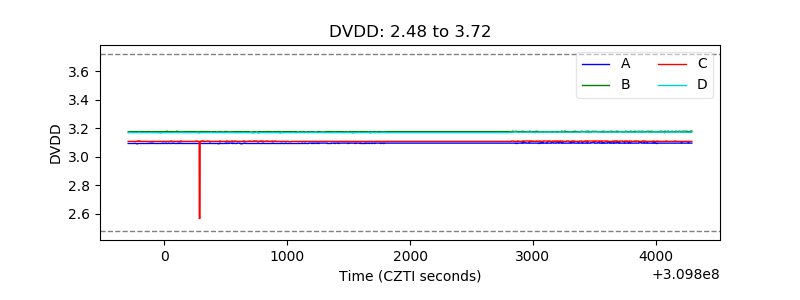 |
| Temperature 1 | 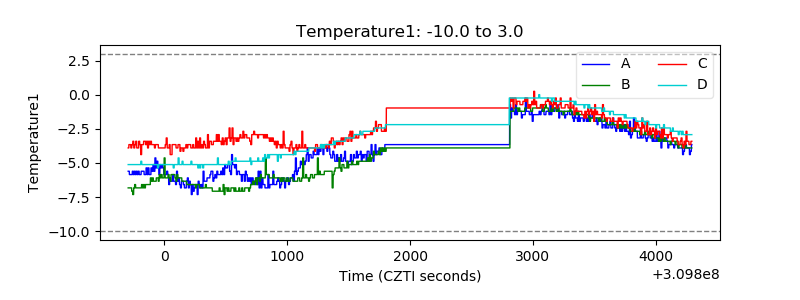 |
| Veto HV Monitor | 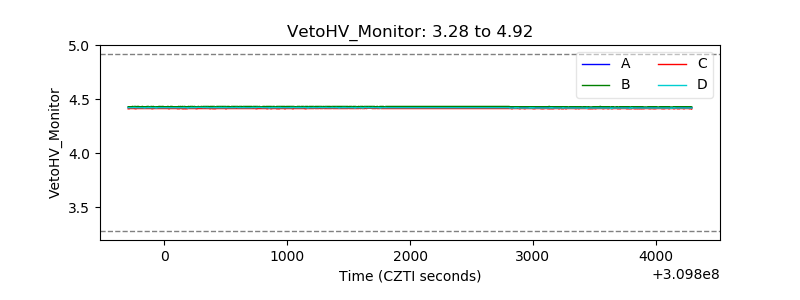 |
| Veto LLD | 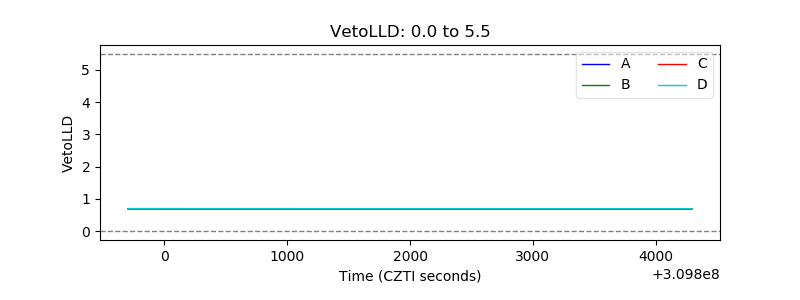 |
| Alpha Counter | 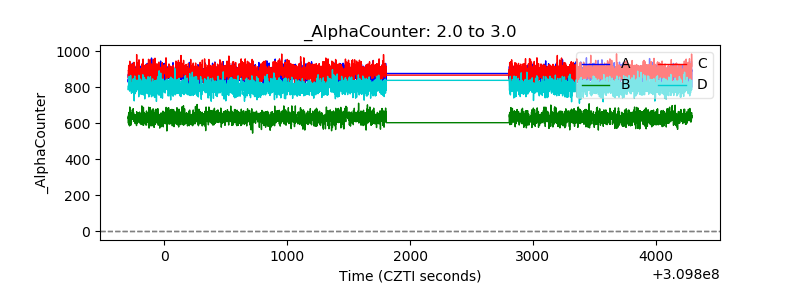 |
| _CPM_Rate | 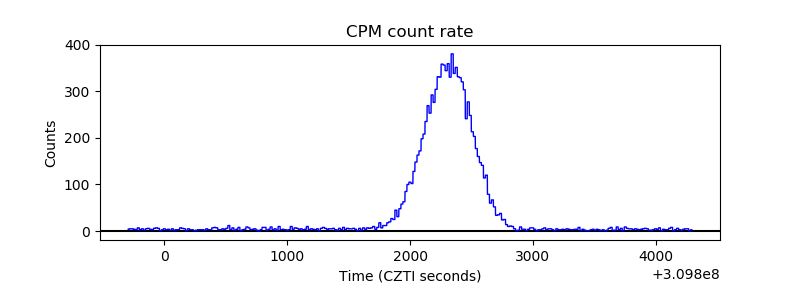 |
| CZT Counter |  |
| +2.5 Volts monitor |  |
| +5 Volts monitor |  |
| _ROLL_ROT | 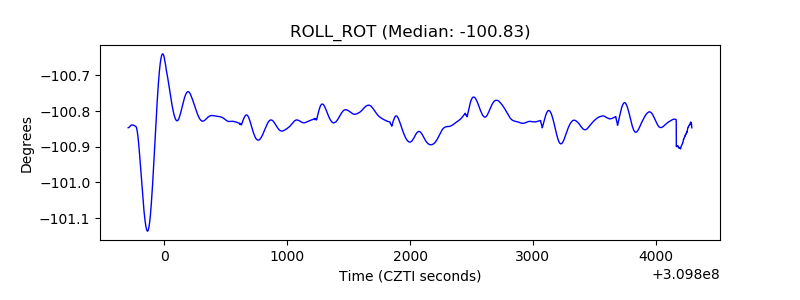 |
| _Roll_DEC | 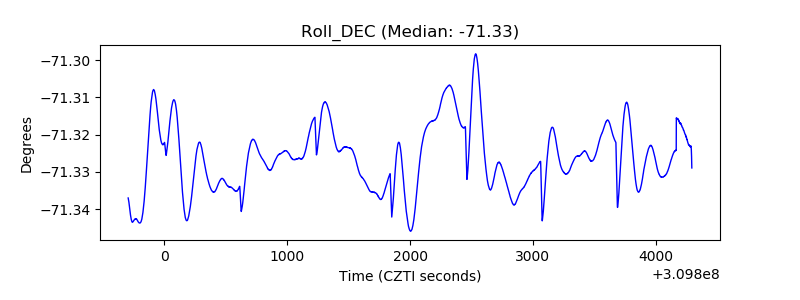 |
| _Roll_RA |  |
| Veto Counter | 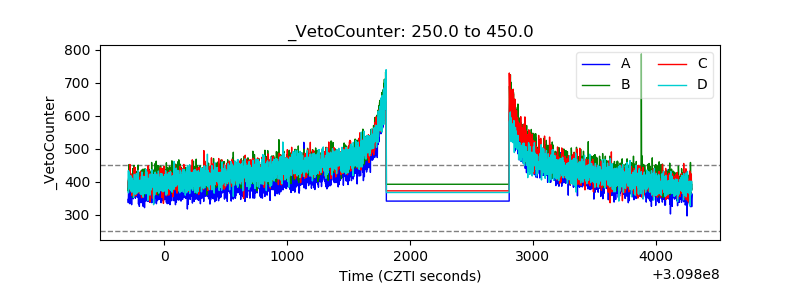 |