| Param | Original file | Final file |
|---|---|---|
| Filename | modeM0/AS1A07_047T08_9000003262_22048cztM0_level2.evt | modeM0/AS1A07_047T08_9000003262_22048cztM0_level2_quad_clean.evt |
| Size (bytes) | 501,367,680 | 135,915,840 |
| Size | 478.1 MB | 129.6 MB |
| Events in quadrant A | 3,272,527 | 923,551 |
| Events in quadrant B | 3,473,385 | 937,923 |
| Events in quadrant C | 3,272,446 | 901,182 |
| Events in quadrant D | 4,690,468 | 866,509 |
| Mode M9 | |||
|---|---|---|---|
| Quadrant | BADHDUFLAG | Total packets | Discarded packets |
| A | 0 | 7 | 0 |
| B | 0 | 7 | 0 |
| C | 0 | 7 | 0 |
| D | 0 | 7 | 0 |
| Mode M0 | |||
|---|---|---|---|
| Quadrant | BADHDUFLAG | Total packets | Discarded packets |
| A | 0 | 14358 | 2 |
| B | 0 | 14838 | 2 |
| C | 0 | 14354 | 2 |
| D | 0 | 18789 | 4 |
| Mode SS | |||
|---|---|---|---|
| Quadrant | BADHDUFLAG | Total packets | Discarded packets |
| A | 0 | 142 | 0 |
| B | 0 | 142 | 0 |
| C | 0 | 142 | 0 |
| D | 0 | 142 | 0 |
| Quadrant | Total seconds | Saturated seconds | Saturation percentage |
|---|---|---|---|
| A | 6999 | 40 | 0.571510% |
| B | 7000 | 55 | 0.785714% |
| C | 7000 | 42 | 0.600000% |
| D | 6999 | 267 | 3.814831% |
Noise dominated data is calculated using 1-second bins in cleaned event files. If a bin has >2000 counts, and if more than 50% of those come from <1% of pixels, then it is considered to be noise-dominated and hence unusable.
| Quadrant | # 1 sec bins | Bins with >0 counts | Bins with >2000 counts | High rate bins dominated by noise | Noise dominated (total time) | Noise dominated (detector-on time) | Marked lightcurve |
|---|---|---|---|---|---|---|---|
| A | 7634 | 6999 | 4 | 4 | 0.05% | 0.06% | 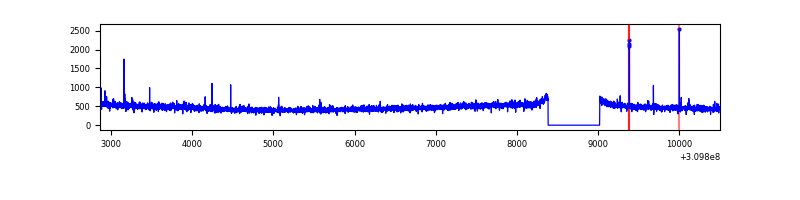 |
| B | 7635 | 7001 | 15 | 15 | 0.20% | 0.21% | 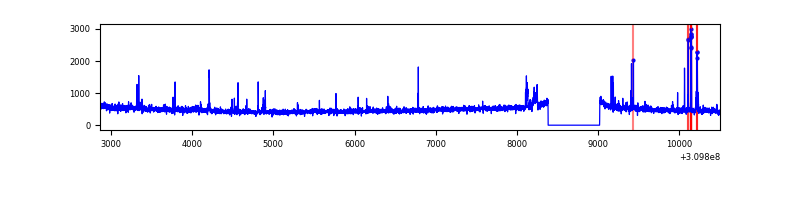 |
| C | 7635 | 7001 | 0 | 0 | 0.00% | 0.00% | 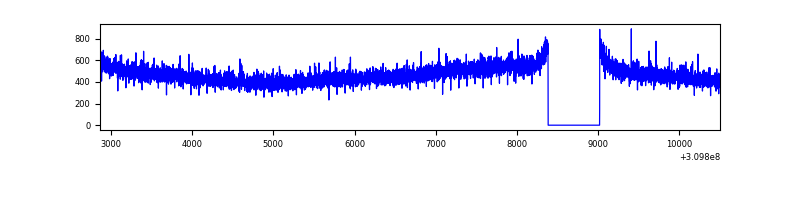 |
| D | 7634 | 7000 | 240 | 240 | 3.14% | 3.43% | 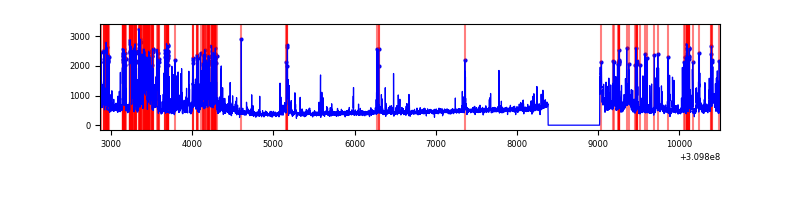 |
Top three noisy pixels from each quadrant. If the there are fewer than three noisy pixels in the level2.evt file, extra rows are filled as -1
| Pixel properties | Quadrant properties | ||||||
|---|---|---|---|---|---|---|---|
| Quadrant | DetID | PixID | Counts | Sigma | Mean | Median | Sigma |
| A | 15 | 236 | 22215 | 125.95 | 840 | 824 | 169.8 |
| A | 13 | 254 | 11157 | 60.84 | 840 | 824 | 169.8 |
| A | 5 | 16 | 8110 | 42.9 | 840 | 824 | 169.8 |
| B | 3 | 64 | 64146 | 403.05 | 837 | 817 | 157.1 |
| B | 0 | 197 | 35966 | 223.7 | 837 | 817 | 157.1 |
| B | 0 | 190 | 28876 | 178.58 | 837 | 817 | 157.1 |
| C | 14 | 238 | 126590 | 677.39 | 803 | 808 | 185.7 |
| C | 3 | 233 | 8676 | 42.37 | 803 | 808 | 185.7 |
| C | 4 | 175 | 6349 | 29.84 | 803 | 808 | 185.7 |
| D | 11 | 176 | 430019 | 2214.63 | 805 | 782 | 193.8 |
| D | 5 | 222 | 288591 | 1484.94 | 805 | 782 | 193.8 |
| D | 7 | 38 | 227810 | 1171.34 | 805 | 782 | 193.8 |
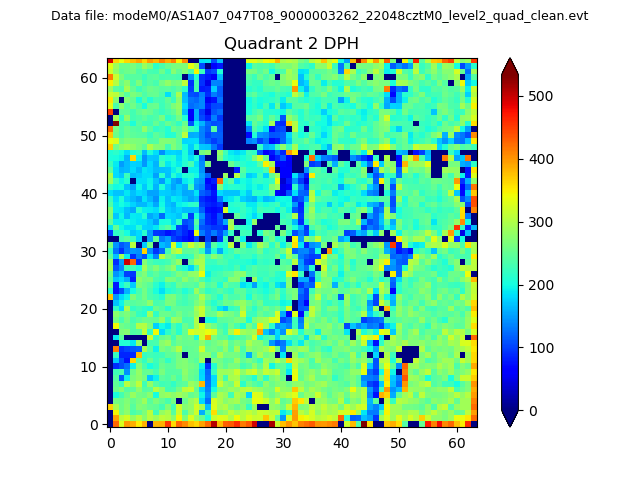
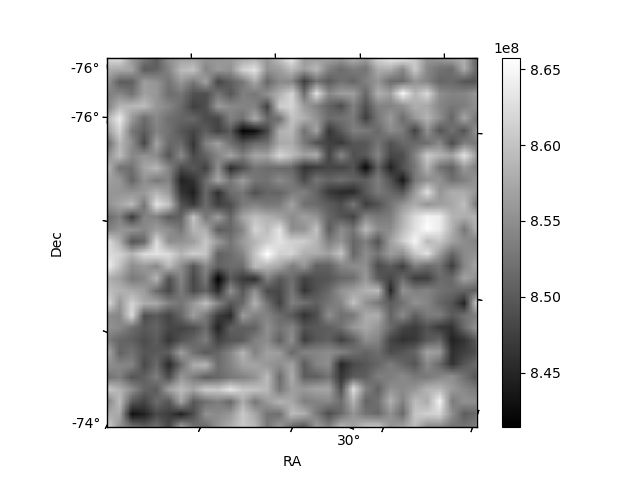
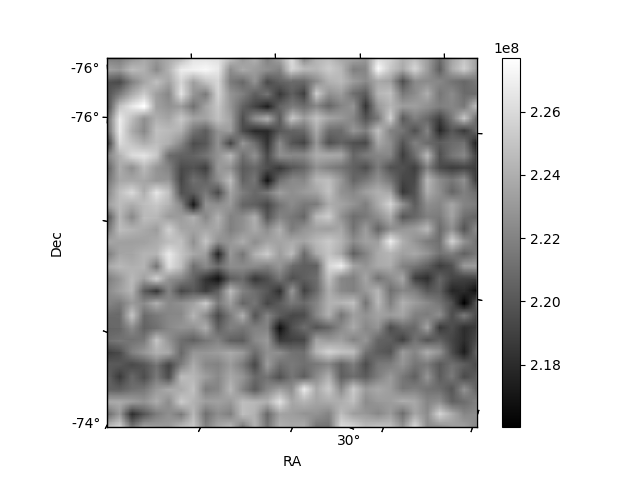
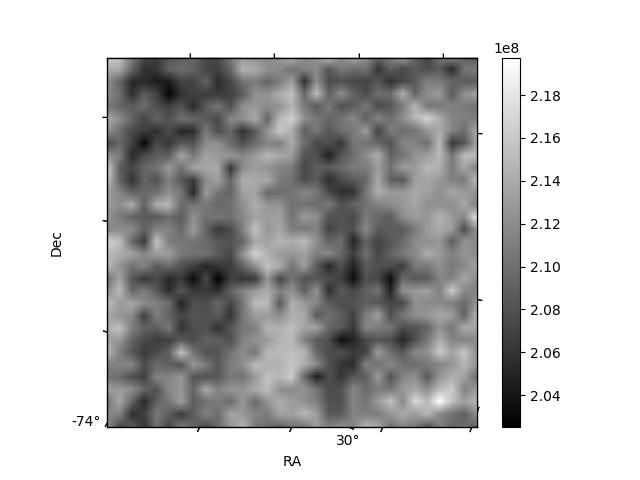
Histogram calculated using DETX and DETY for each event in the final _common_clean file
| Quadrant A | 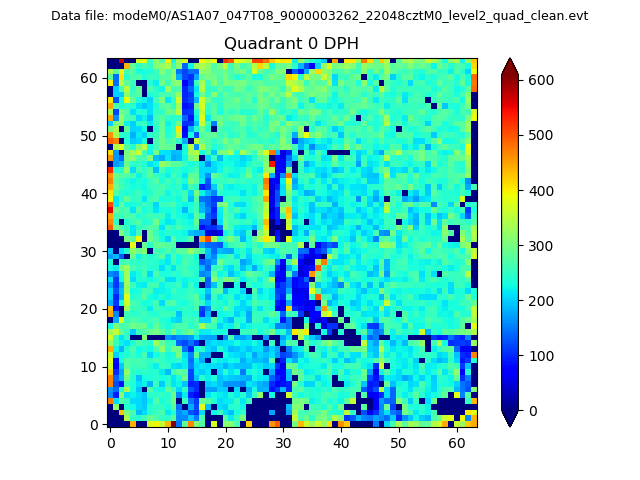 |
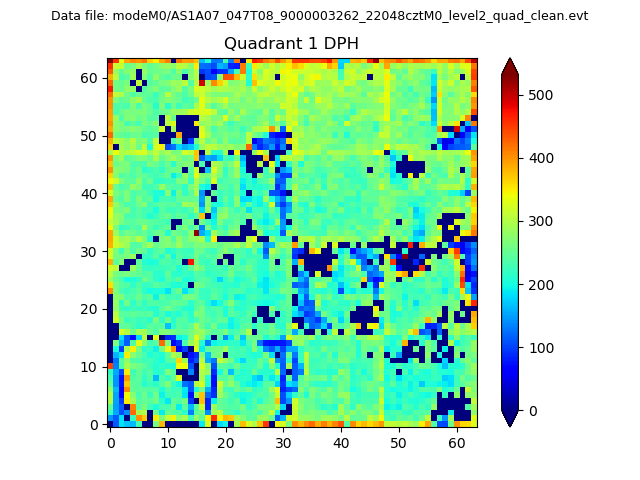 |
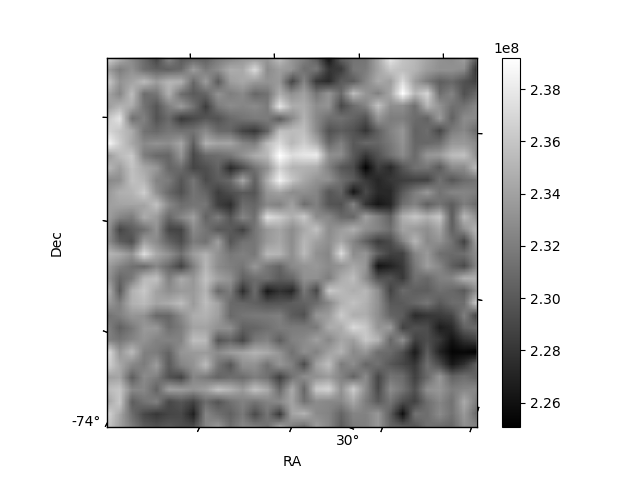
Quadrant B |
|---|---|---|---|
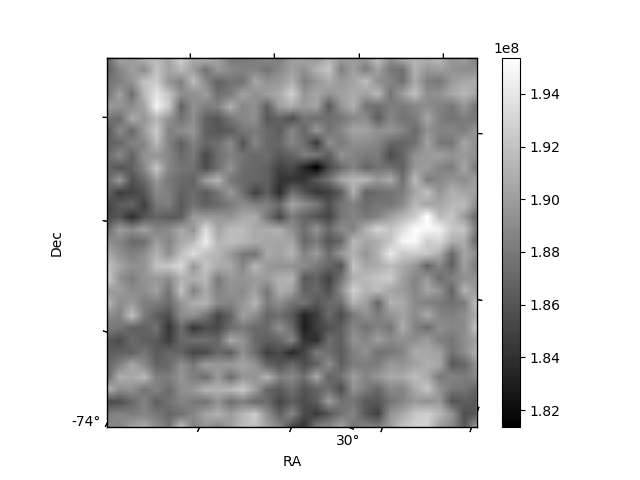
| Quadrant D | 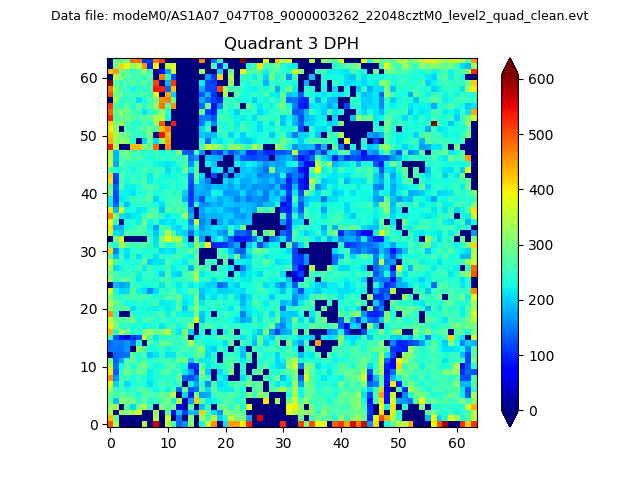 |
 |
Quadrant C |
| Plot type | Count rate plots | Images |
|---|---|---|
| Comparison with Poisson distribution Blue bars denote a histogram of data divided into 1 sec bins. Red curve is a Poisson curve with rate = median count rate of data. |
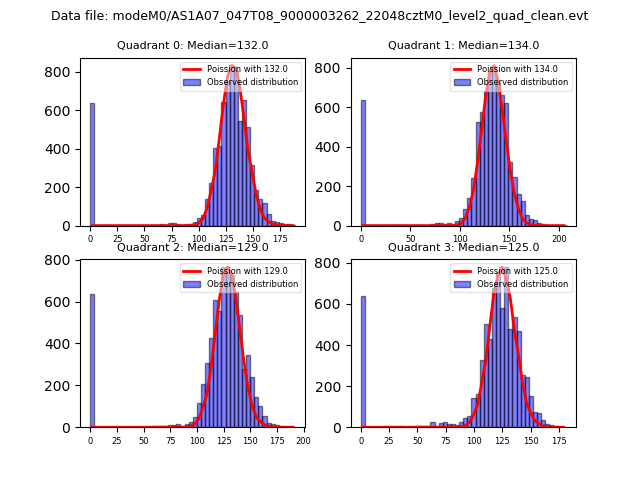 |
 |
| Quadrant-wise count rates Data is divided into 100 sec bins |
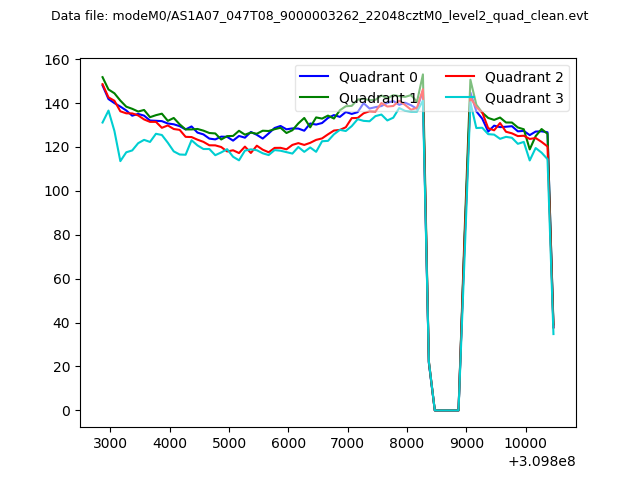 |
|
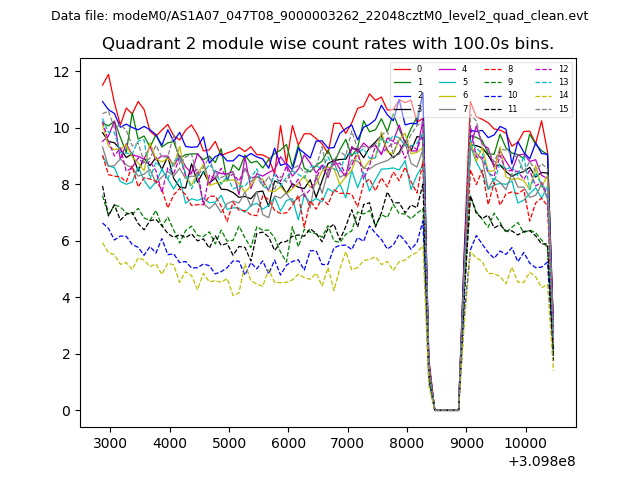
| Module-wise count rates for Quadrant A Data is divided into 100 sec bins |
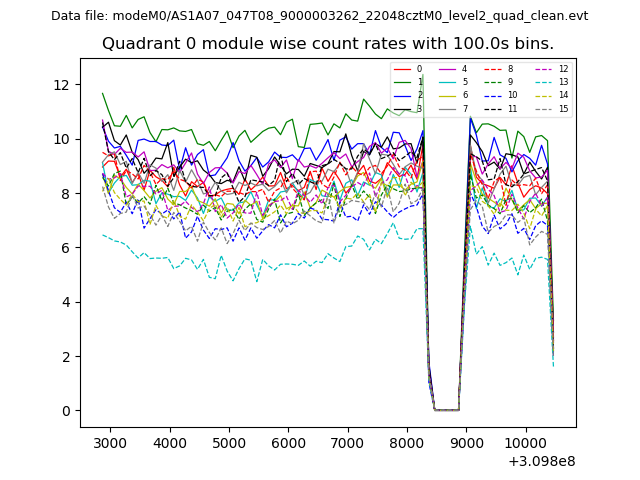 |
 |
| Module-wise count rates for Quadrant B Data is divided into 100 sec bins |
 |
 |
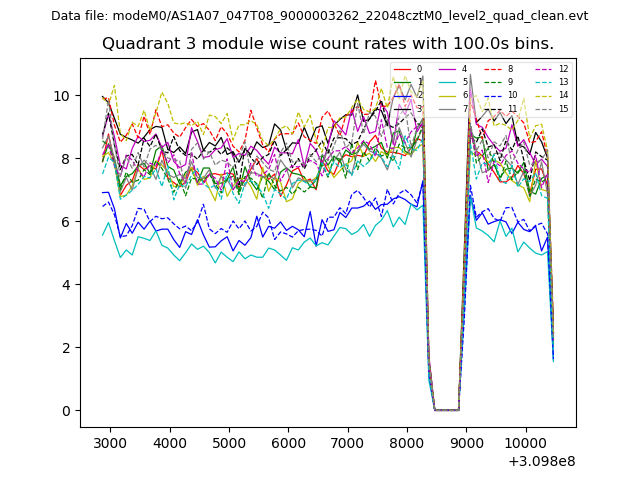
| Module-wise count rates for Quadrant C Data is divided into 100 sec bins |
 |
 |
| Module-wise count rates for Quadrant D Data is divided into 100 sec bins |
 |
 |
| Parameter | Plot |
|---|---|
| CZT HV Monitor | 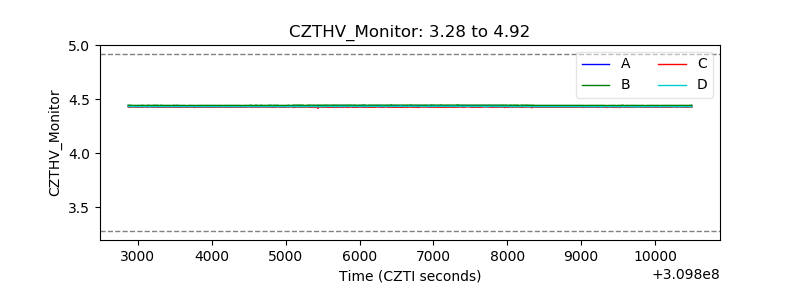 |
| D_VDD | 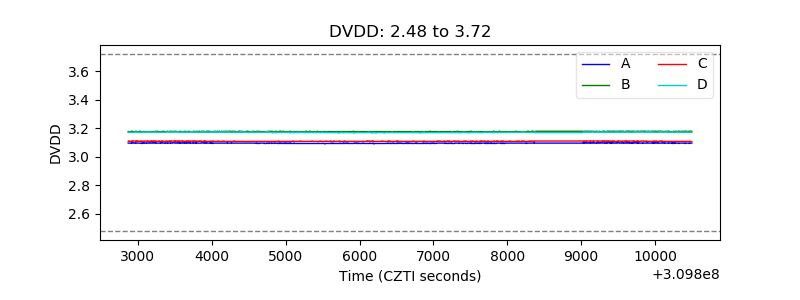 |
| Temperature 1 | 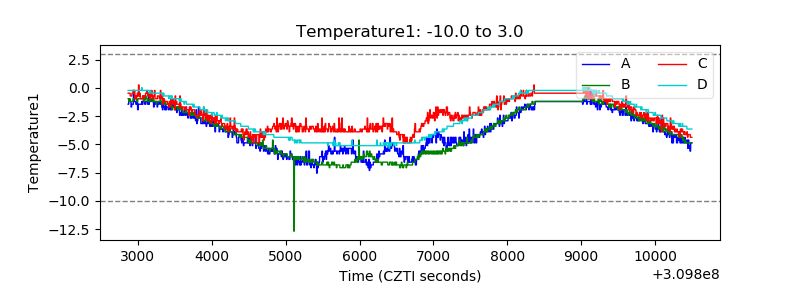 |
| Veto HV Monitor | 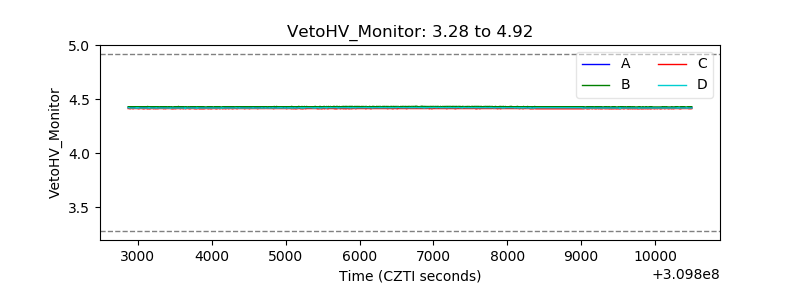 |
| Veto LLD | 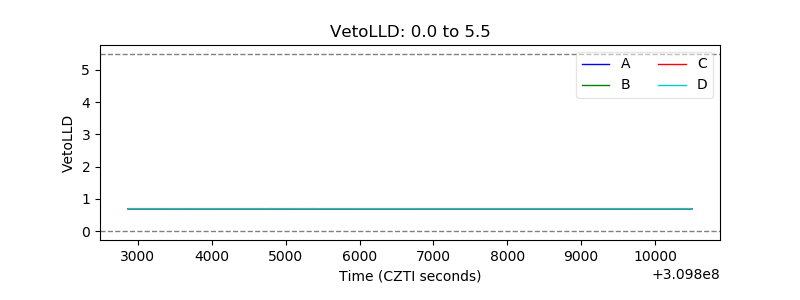 |
| Alpha Counter | 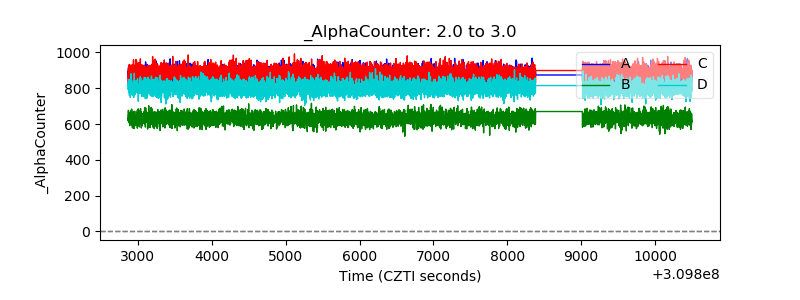 |
| _CPM_Rate | 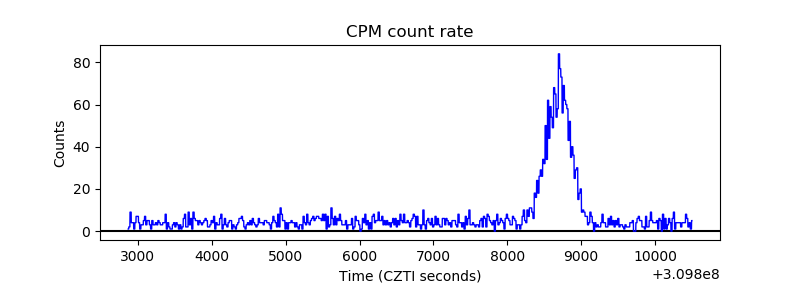 |
| CZT Counter | 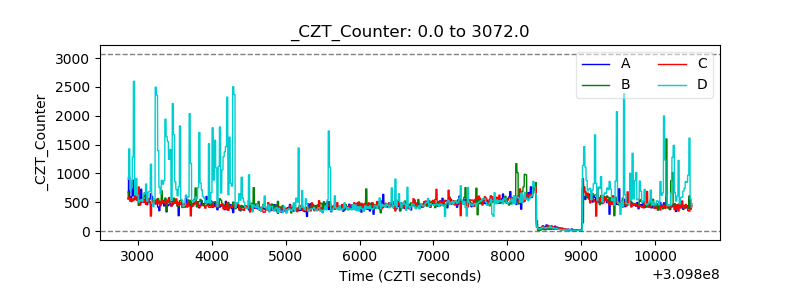 |
| +2.5 Volts monitor |  |
| +5 Volts monitor |  |
| _ROLL_ROT | 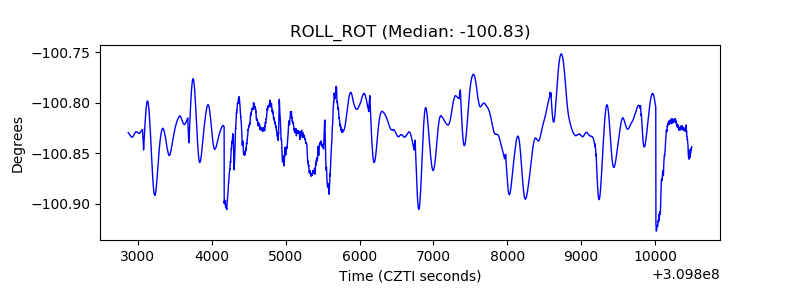 |
| _Roll_DEC | 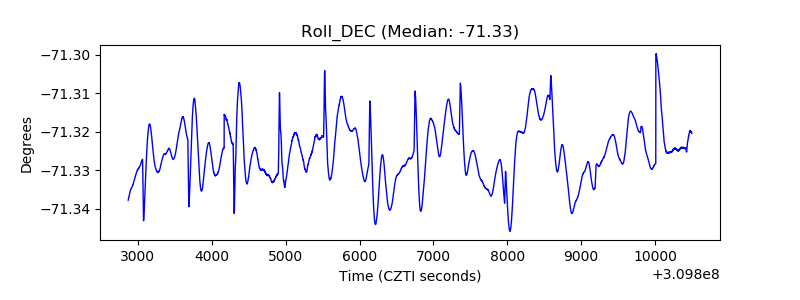 |
| _Roll_RA | 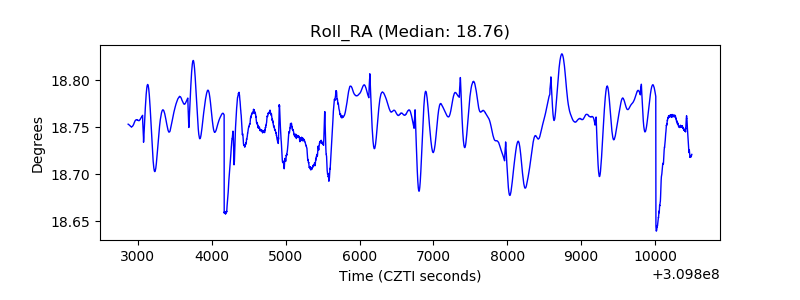 |
| Veto Counter | 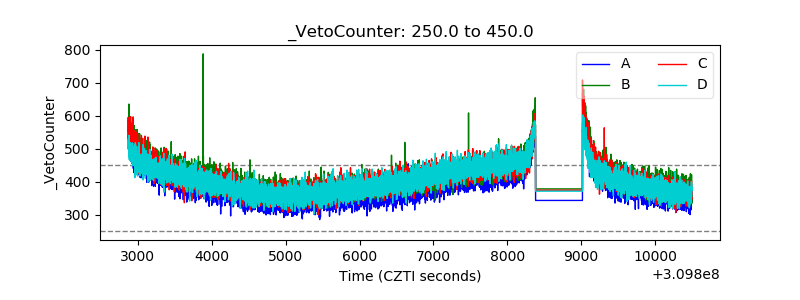 |