| Param | Original file | Final file |
|---|---|---|
| Filename | modeM0/AS1A07_047T08_9000003262_22049cztM0_level2.evt | modeM0/AS1A07_047T08_9000003262_22049cztM0_level2_quad_clean.evt |
| Size (bytes) | 151,833,600 | 38,957,760 |
| Size | 144.8 MB | 37.2 MB |
| Events in quadrant A | 951,422 | 261,648 |
| Events in quadrant B | 1,039,607 | 264,910 |
| Events in quadrant C | 917,819 | 256,761 |
| Events in quadrant D | 1,548,330 | 247,897 |
| Mode M9 | |||
|---|---|---|---|
| Quadrant | BADHDUFLAG | Total packets | Discarded packets |
| A | 1 | 139951111330696 | 46 |
| B | 1 | -1 | -1 |
| C | 1 | -1 | -1 |
| D | 1 | -1 | -1 |
| Mode M0 | |||
|---|---|---|---|
| Quadrant | BADHDUFLAG | Total packets | Discarded packets |
| A | 0 | 4226 | 1 |
| B | 0 | 4463 | 1 |
| C | 0 | 4178 | 1 |
| D | 0 | 6009 | 1 |
| Mode SS | |||
|---|---|---|---|
| Quadrant | BADHDUFLAG | Total packets | Discarded packets |
| A | 0 | 40 | 0 |
| B | 0 | 40 | 0 |
| C | 0 | 40 | 0 |
| D | 0 | 40 | 0 |
| Quadrant | Total seconds | Saturated seconds | Saturation percentage |
|---|---|---|---|
| A | 2042 | 15 | 0.734574% |
| B | 2042 | 27 | 1.322233% |
| C | 2042 | 12 | 0.587659% |
| D | 2042 | 88 | 4.309500% |
Noise dominated data is calculated using 1-second bins in cleaned event files. If a bin has >2000 counts, and if more than 50% of those come from <1% of pixels, then it is considered to be noise-dominated and hence unusable.
| Quadrant | # 1 sec bins | Bins with >0 counts | Bins with >2000 counts | High rate bins dominated by noise | Noise dominated (total time) | Noise dominated (detector-on time) | Marked lightcurve |
|---|---|---|---|---|---|---|---|
| A | 2042 | 2042 | 4 | 4 | 0.20% | 0.20% |  |
| B | 2042 | 2042 | 15 | 15 | 0.73% | 0.73% | 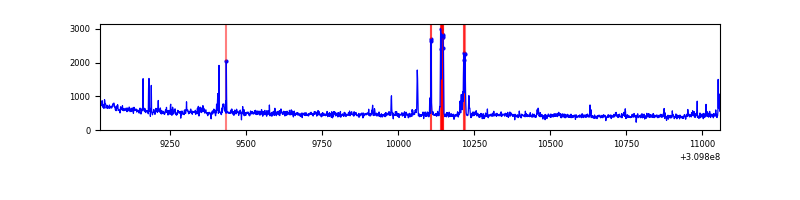 |
| C | 2042 | 2042 | 0 | 0 | 0.00% | 0.00% | 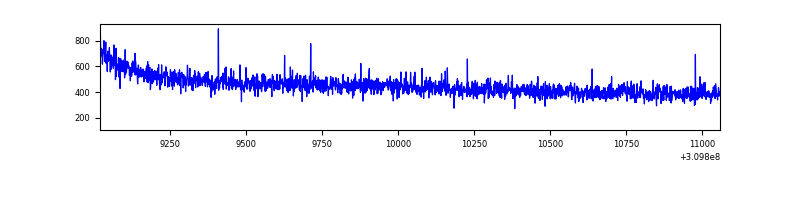 |
| D | 2042 | 2042 | 70 | 70 | 3.43% | 3.43% | 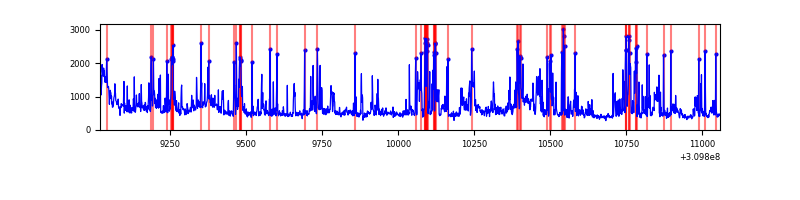 |
Top three noisy pixels from each quadrant. If the there are fewer than three noisy pixels in the level2.evt file, extra rows are filled as -1
| Pixel properties | Quadrant properties | ||||||
|---|---|---|---|---|---|---|---|
| Quadrant | DetID | PixID | Counts | Sigma | Mean | Median | Sigma |
| A | 15 | 236 | 12891 | 249.78 | 240 | 234 | 50.7 |
| A | 5 | 16 | 11730 | 226.87 | 240 | 234 | 50.7 |
| A | 13 | 254 | 3433 | 63.13 | 240 | 234 | 50.7 |
| B | 3 | 64 | 47820 | 1008.36 | 239 | 234 | 47.2 |
| B | 0 | 190 | 19184 | 401.55 | 239 | 234 | 47.2 |
| B | 0 | 229 | 9632 | 199.15 | 239 | 234 | 47.2 |
| C | 14 | 238 | 35520 | 657.6 | 224 | 224 | 53.7 |
| C | 3 | 233 | 5799 | 103.87 | 224 | 224 | 53.7 |
| C | 4 | 175 | 2991 | 51.55 | 224 | 224 | 53.7 |
| D | 7 | 38 | 240961 | 4285.18 | 225 | 218 | 56.2 |
| D | 1 | 52 | 125859 | 2236.39 | 225 | 218 | 56.2 |
| D | 12 | 233 | 99676 | 1770.33 | 225 | 218 | 56.2 |
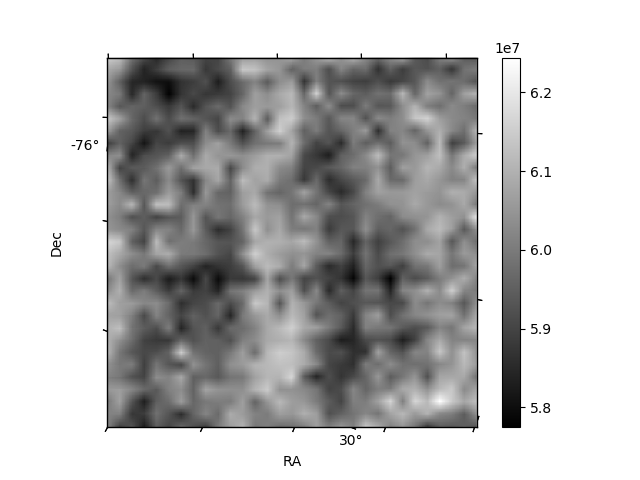
Histogram calculated using DETX and DETY for each event in the final _common_clean file
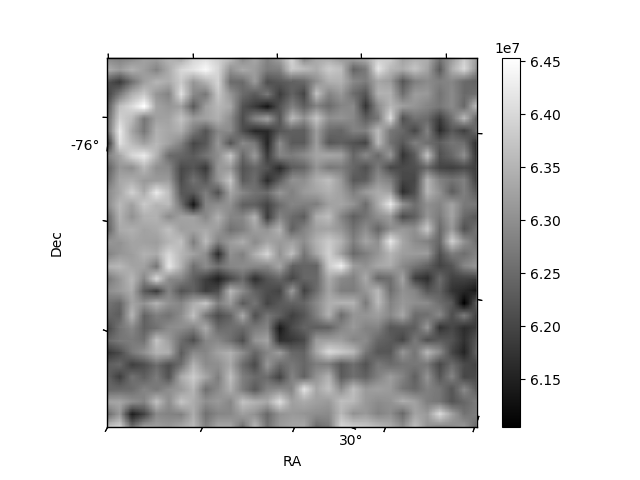
| Quadrant A |  |
 |
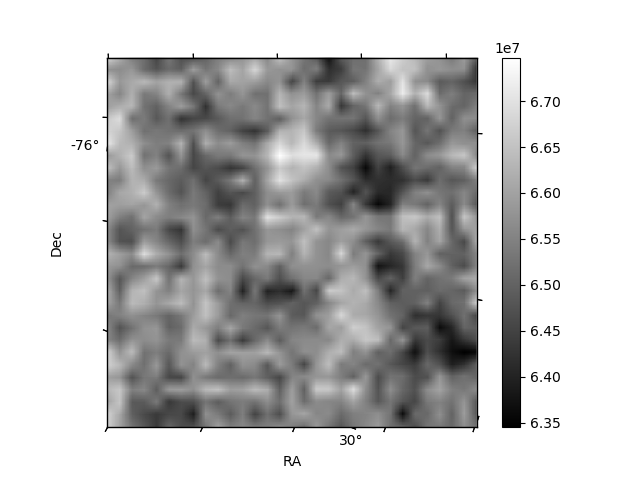
Quadrant B |
|---|---|---|---|
| Quadrant D | 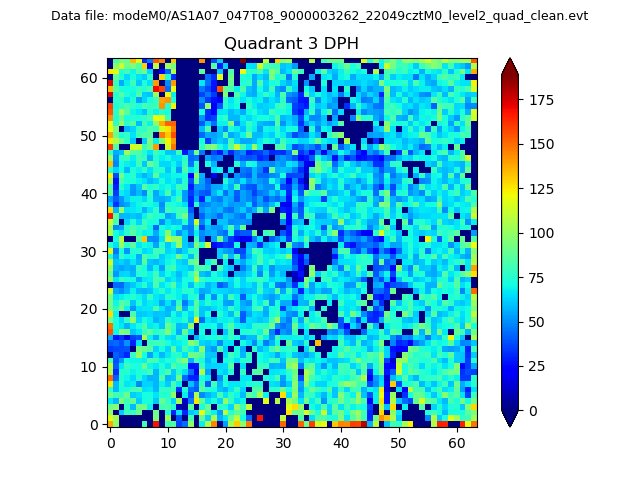 |
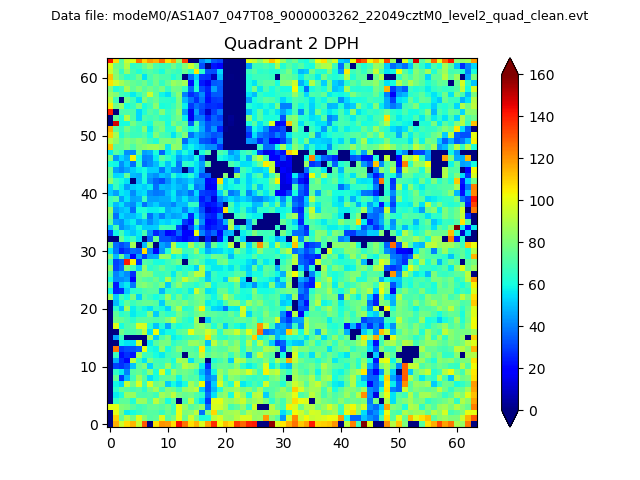 |
Quadrant C |
| Plot type | Count rate plots | Images |
|---|---|---|
| Comparison with Poisson distribution Blue bars denote a histogram of data divided into 1 sec bins. Red curve is a Poisson curve with rate = median count rate of data. |
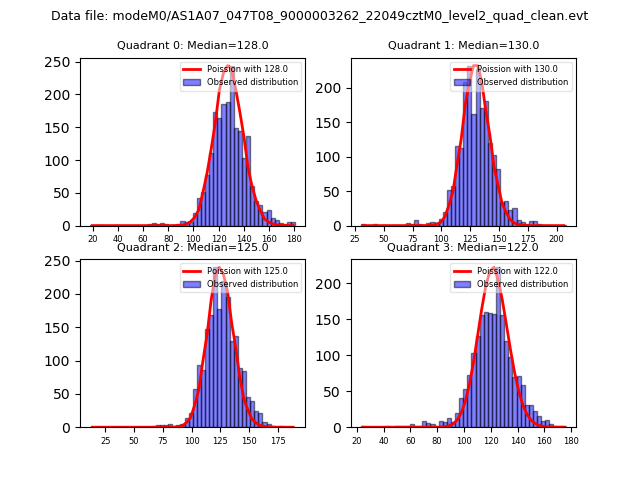 |
 |
| Quadrant-wise count rates Data is divided into 100 sec bins |
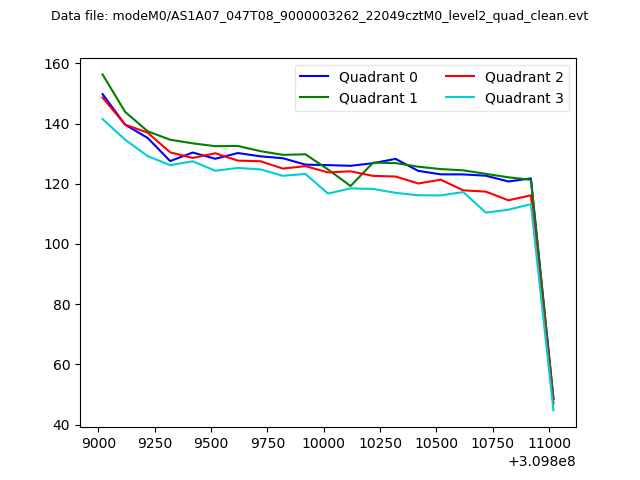 |
|
| Module-wise count rates for Quadrant A Data is divided into 100 sec bins |
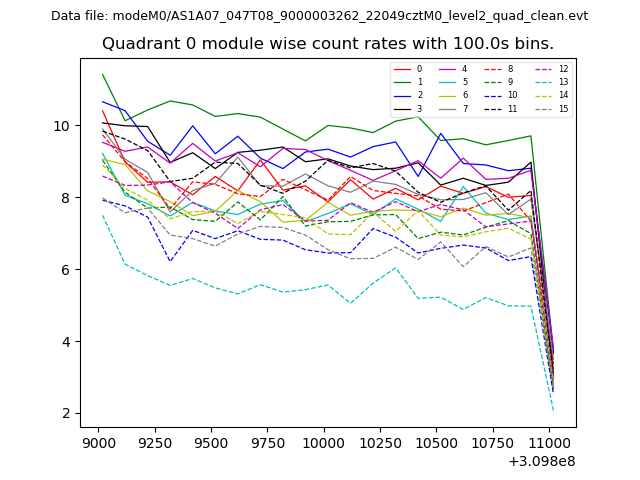 |
 |
| Module-wise count rates for Quadrant B Data is divided into 100 sec bins |
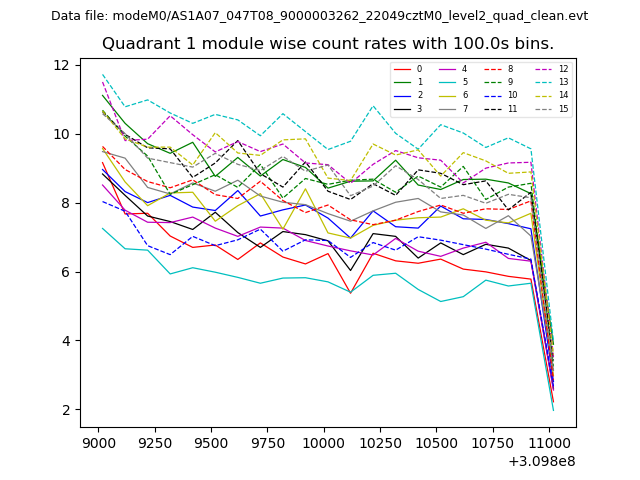 |
 |
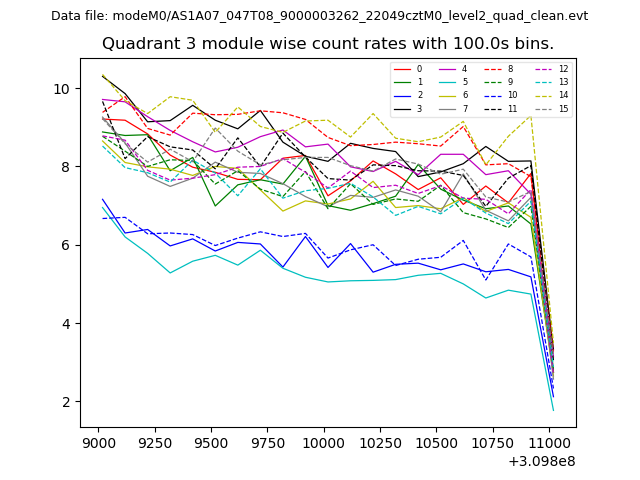
| Module-wise count rates for Quadrant C Data is divided into 100 sec bins |
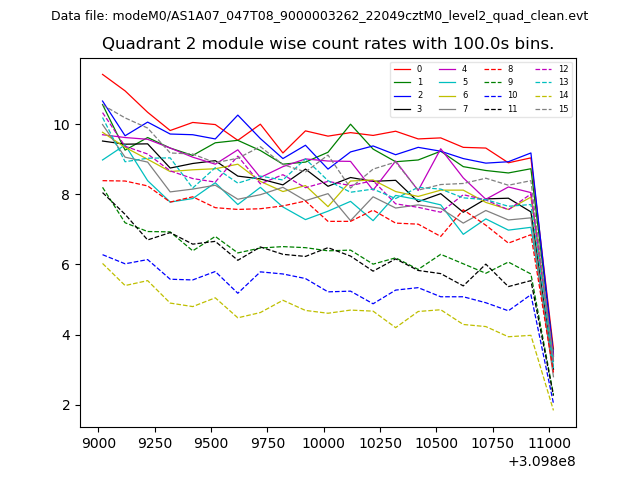 |
 |
| Module-wise count rates for Quadrant D Data is divided into 100 sec bins |
 |
 |
| Parameter | Plot |
|---|---|
| CZT HV Monitor | 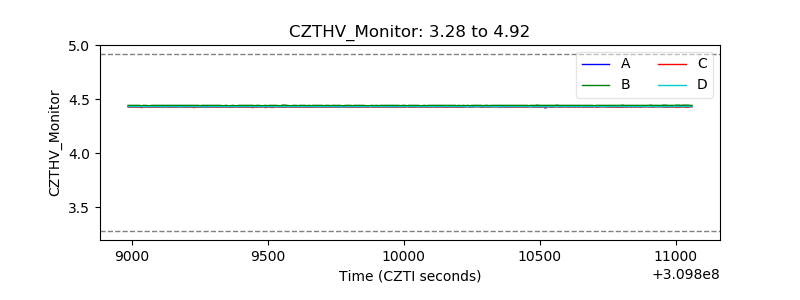 |
| D_VDD | 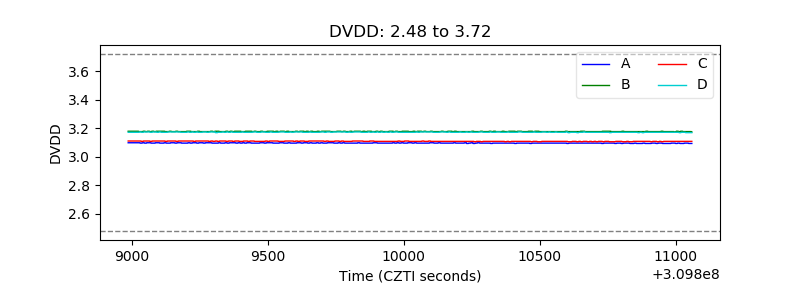 |
| Temperature 1 | 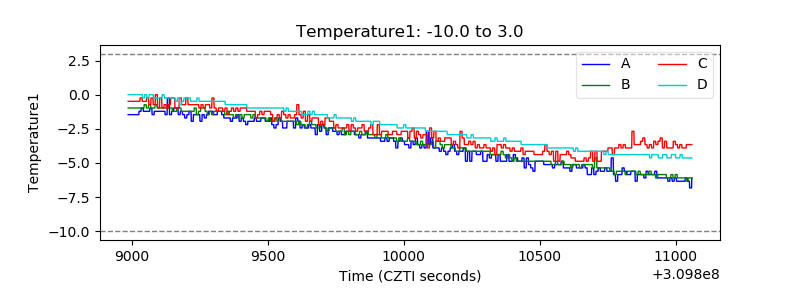 |
| Veto HV Monitor | 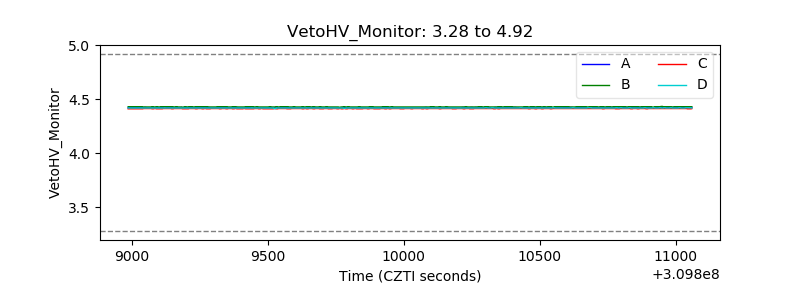 |
| Veto LLD | 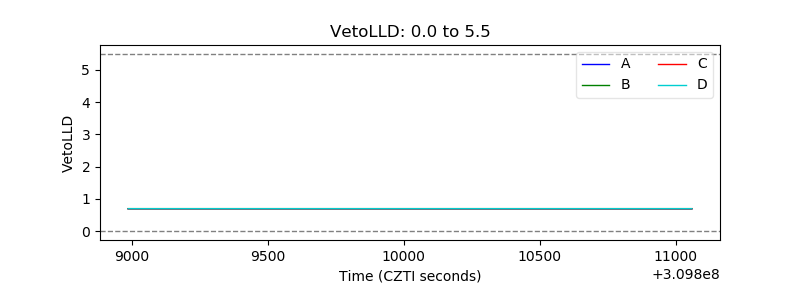 |
| Alpha Counter | 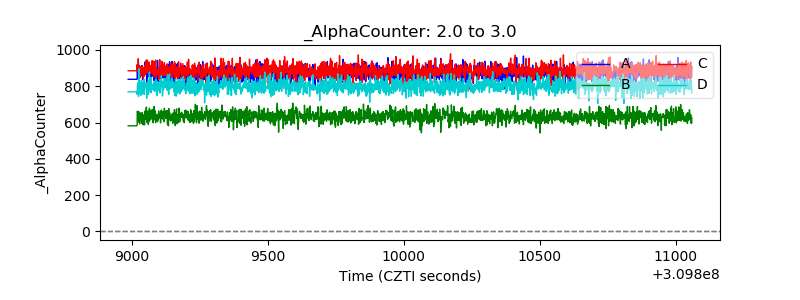 |
| _CPM_Rate | 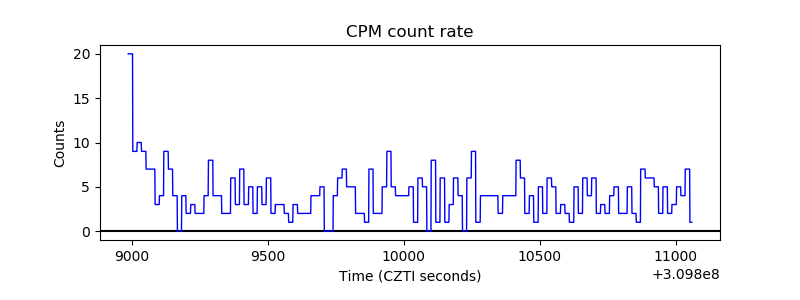 |
| CZT Counter | 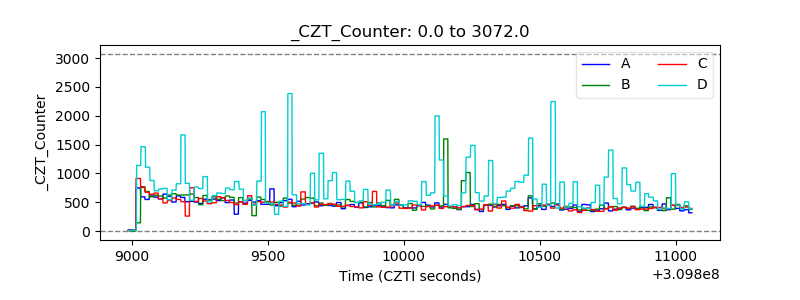 |
| +2.5 Volts monitor |  |
| +5 Volts monitor | 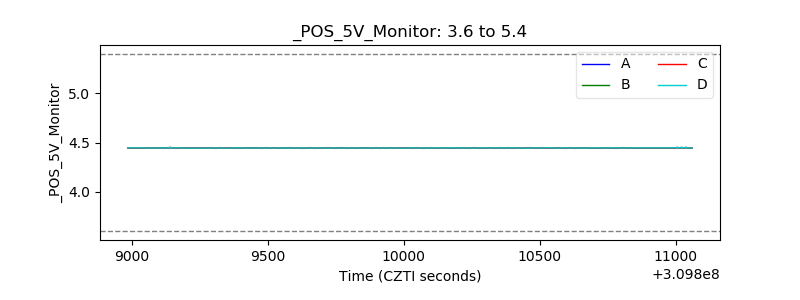 |
| _ROLL_ROT | 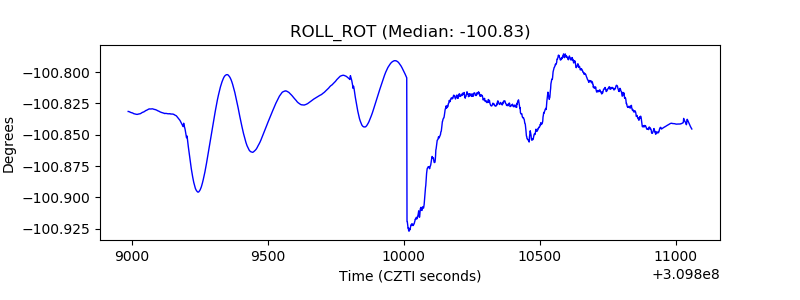 |
| _Roll_DEC | 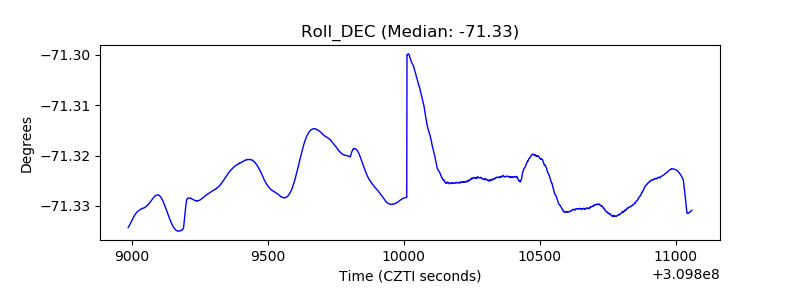 |
| _Roll_RA | 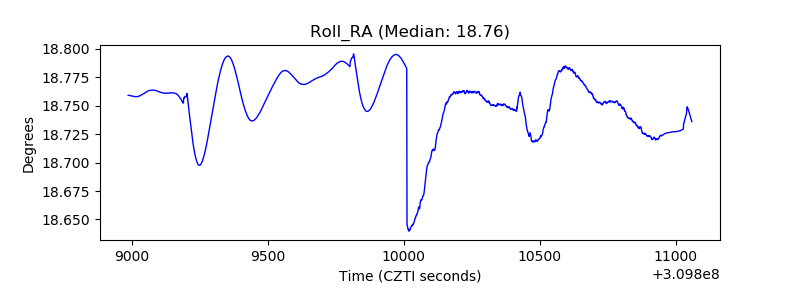 |
| Veto Counter | 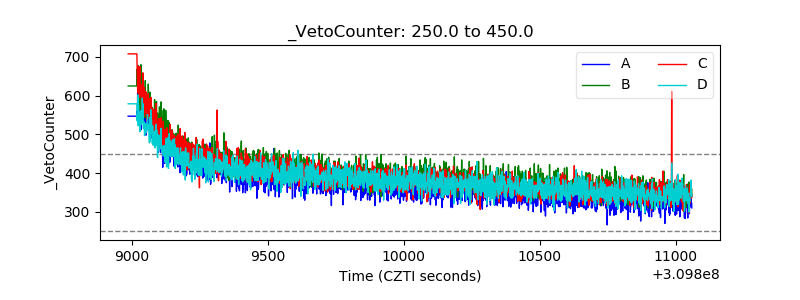 |