| Param | Original file | Final file |
|---|---|---|
| Filename | modeM0/AS1A07_047T09_9000003260_22045cztM0_level2.evt | modeM0/AS1A07_047T09_9000003260_22045cztM0_level2_quad_clean.evt |
| Size (bytes) | 146,928,960 | 40,685,760 |
| Size | 140.1 MB | 38.8 MB |
| Events in quadrant A | 968,610 | 283,390 |
| Events in quadrant B | 994,652 | 289,168 |
| Events in quadrant C | 959,012 | 273,072 |
| Events in quadrant D | 1,411,382 | 263,268 |
| Mode M0 | |||
|---|---|---|---|
| Quadrant | BADHDUFLAG | Total packets | Discarded packets |
| A | 0 | 3977 | 1 |
| B | 0 | 4054 | 1 |
| C | 0 | 3923 | 1 |
| D | 0 | 5402 | 1 |
| Mode M9 | |||
|---|---|---|---|
| Quadrant | BADHDUFLAG | Total packets | Discarded packets |
| A | 0 | 14 | 0 |
| B | 0 | 14 | 0 |
| C | 0 | 14 | 0 |
| D | 0 | 14 | 0 |
| Mode SS | |||
|---|---|---|---|
| Quadrant | BADHDUFLAG | Total packets | Discarded packets |
| A | 0 | 34 | 0 |
| B | 0 | 34 | 0 |
| C | 0 | 34 | 0 |
| D | 0 | 34 | 0 |
| Quadrant | Total seconds | Saturated seconds | Saturation percentage |
|---|---|---|---|
| A | 1678 | 52 | 3.098927% |
| B | 1678 | 65 | 3.873659% |
| C | 1678 | 79 | 4.707986% |
| D | 1678 | 125 | 7.449344% |
Noise dominated data is calculated using 1-second bins in cleaned event files. If a bin has >2000 counts, and if more than 50% of those come from <1% of pixels, then it is considered to be noise-dominated and hence unusable.
| Quadrant | # 1 sec bins | Bins with >0 counts | Bins with >2000 counts | High rate bins dominated by noise | Noise dominated (total time) | Noise dominated (detector-on time) | Marked lightcurve |
|---|---|---|---|---|---|---|---|
| A | 3023 | 1678 | 0 | 0 | 0.00% | 0.00% | 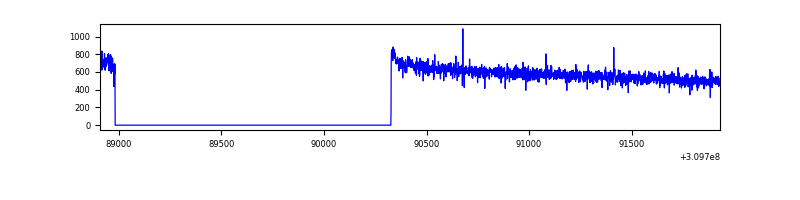 |
| B | 3023 | 1678 | 0 | 0 | 0.00% | 0.00% | 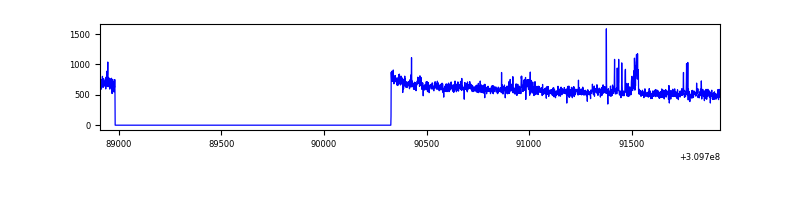 |
| C | 3023 | 1678 | 0 | 0 | 0.00% | 0.00% | 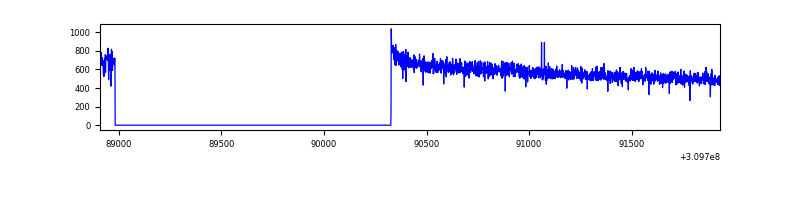 |
| D | 3023 | 1678 | 63 | 63 | 2.08% | 3.75% | 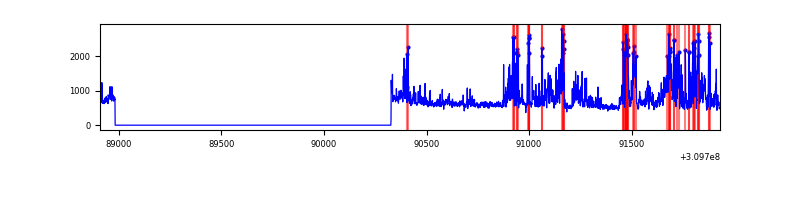 |
Top three noisy pixels from each quadrant. If the there are fewer than three noisy pixels in the level2.evt file, extra rows are filled as -1
| Pixel properties | Quadrant properties | ||||||
|---|---|---|---|---|---|---|---|
| Quadrant | DetID | PixID | Counts | Sigma | Mean | Median | Sigma |
| A | 13 | 254 | 2717 | 48.9 | 251 | 246 | 50.5 |
| A | 0 | 226 | 2122 | 37.12 | 251 | 246 | 50.5 |
| A | 3 | 137 | 1961 | 33.94 | 251 | 246 | 50.5 |
| B | 0 | 190 | 17805 | 369.83 | 245 | 239 | 47.5 |
| B | 3 | 64 | 5968 | 120.62 | 245 | 239 | 47.5 |
| B | 0 | 197 | 5226 | 104.99 | 245 | 239 | 47.5 |
| C | 14 | 238 | 37724 | 686.86 | 235 | 236 | 54.6 |
| C | 9 | 54 | 1682 | 26.49 | 235 | 236 | 54.6 |
| C | 13 | 61 | 1670 | 26.27 | 235 | 236 | 54.6 |
| D | 12 | 233 | 415662 | 7070.65 | 240 | 232 | 58.8 |
| D | 13 | 172 | 34692 | 586.51 | 240 | 232 | 58.8 |
| D | 1 | 52 | 23311 | 392.81 | 240 | 232 | 58.8 |
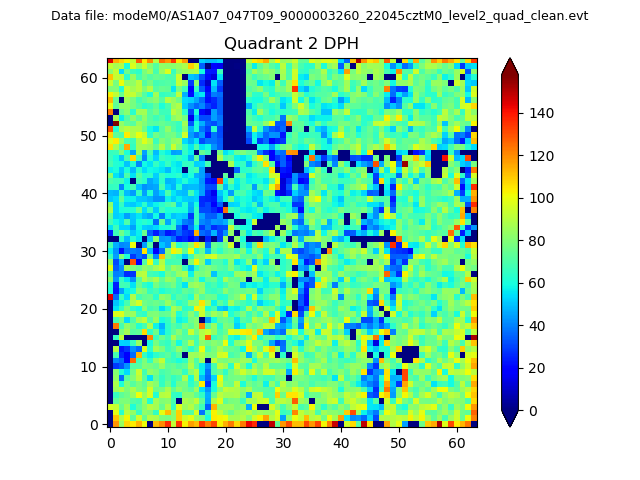
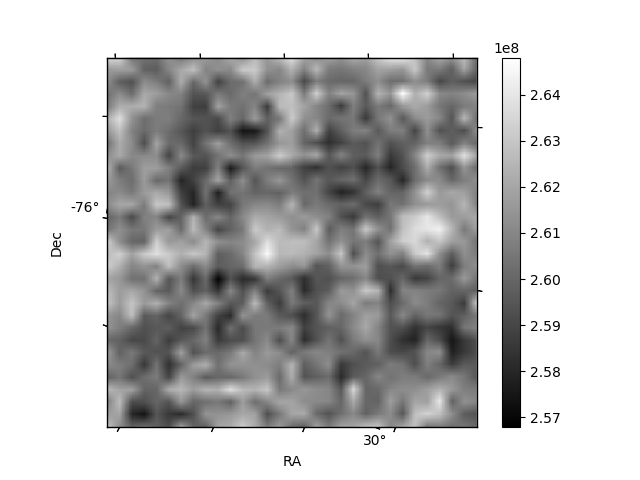
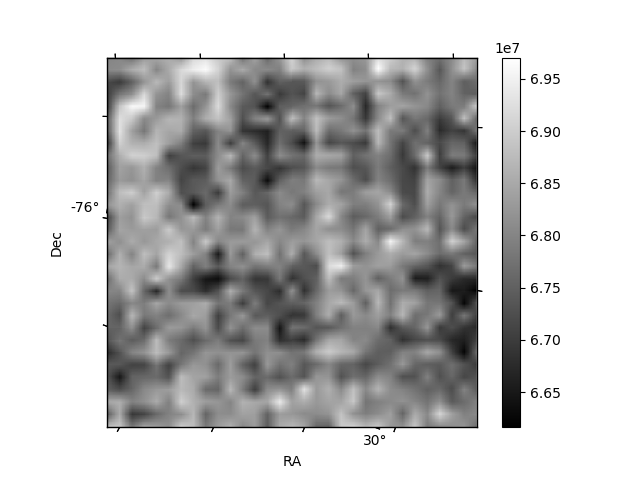
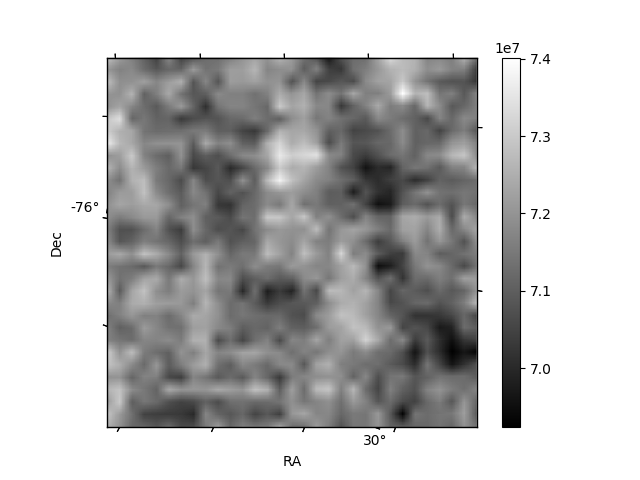
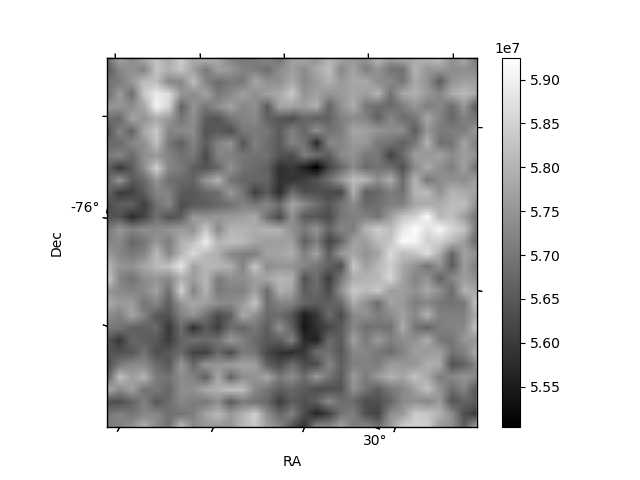
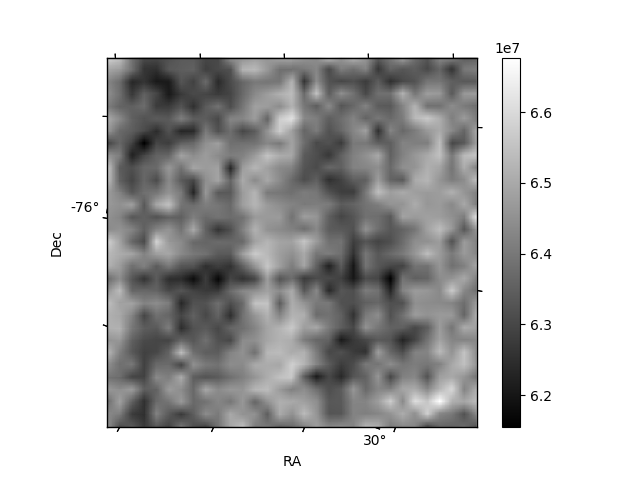
Histogram calculated using DETX and DETY for each event in the final _common_clean file
| Quadrant A | 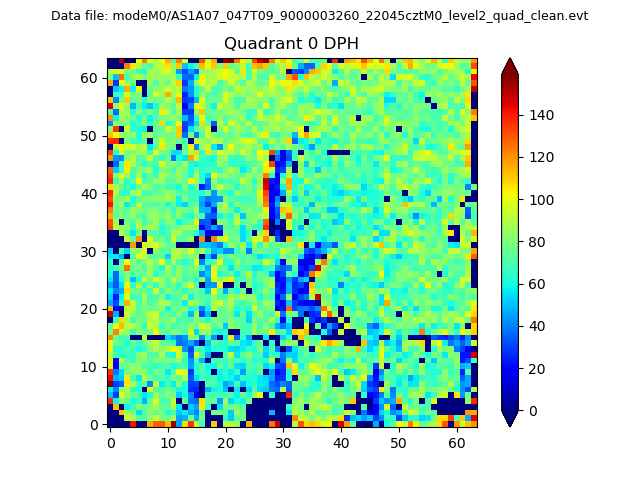 |
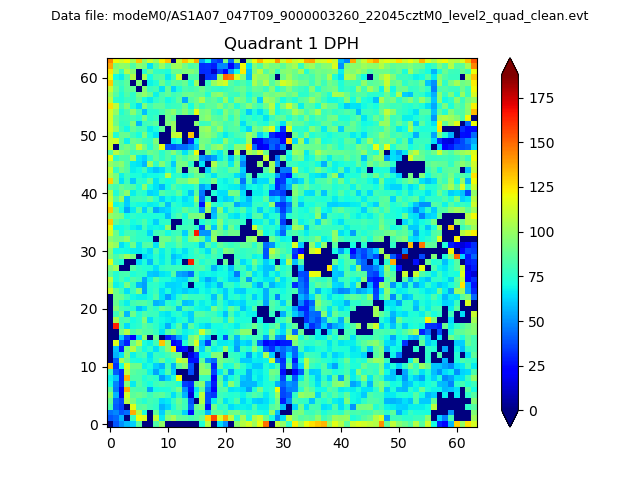 |
Quadrant B |
|---|---|---|---|
| Quadrant D | 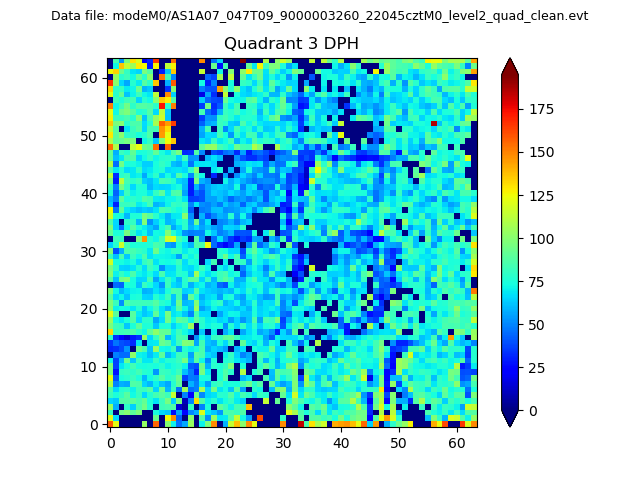 |
 |
Quadrant C |
| Plot type | Count rate plots | Images |
|---|---|---|
| Comparison with Poisson distribution Blue bars denote a histogram of data divided into 1 sec bins. Red curve is a Poisson curve with rate = median count rate of data. |
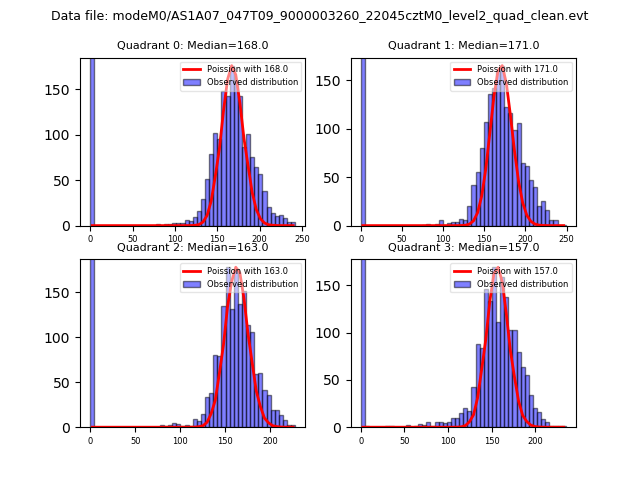 |
 |
| Quadrant-wise count rates Data is divided into 100 sec bins |
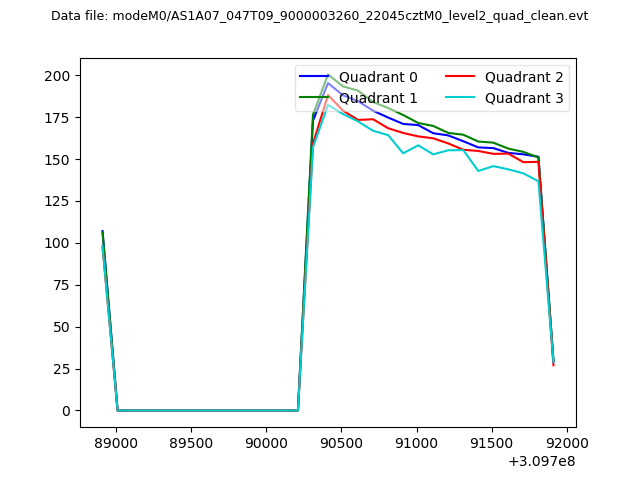 |
|
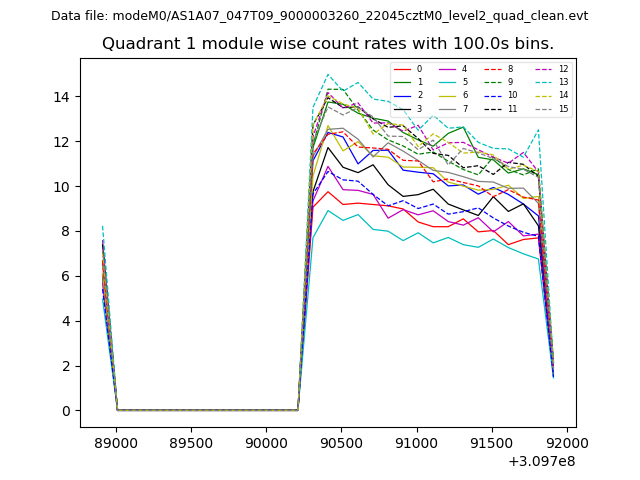
| Module-wise count rates for Quadrant A Data is divided into 100 sec bins |
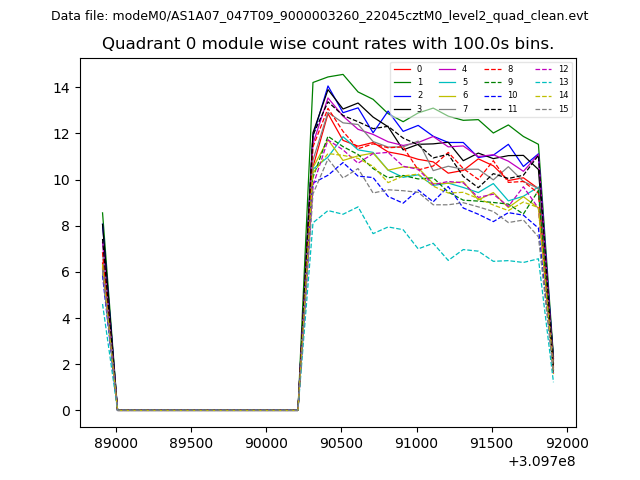 |
 |
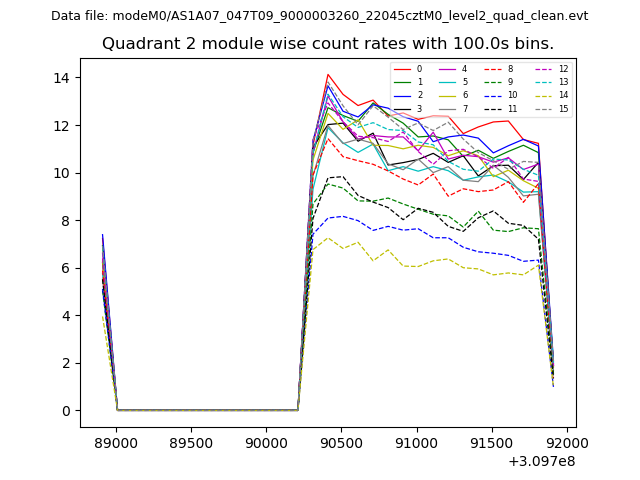
| Module-wise count rates for Quadrant B Data is divided into 100 sec bins |
 |
 |
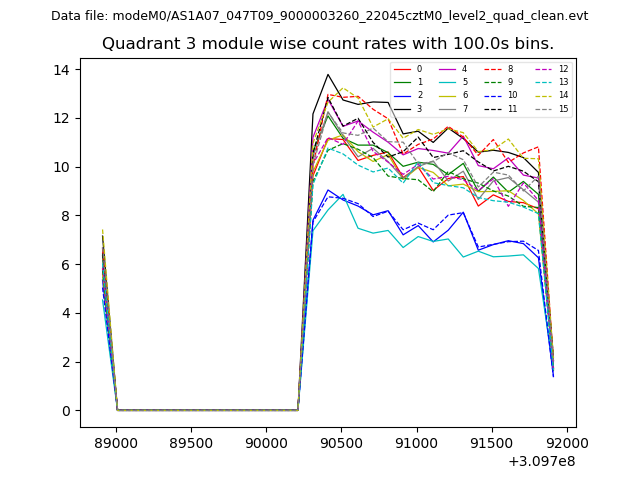
| Module-wise count rates for Quadrant C Data is divided into 100 sec bins |
 |
 |
| Module-wise count rates for Quadrant D Data is divided into 100 sec bins |
 |
 |
| Parameter | Plot |
|---|---|
| CZT HV Monitor | 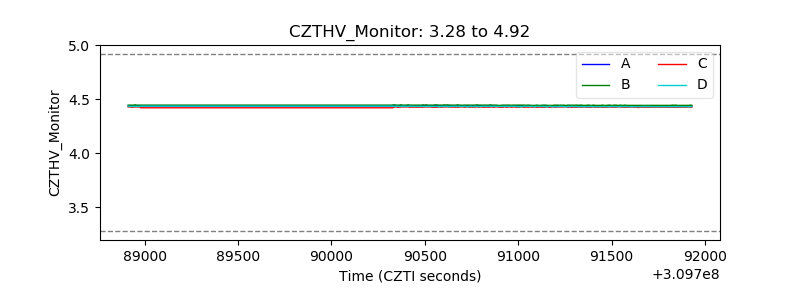 |
| D_VDD | 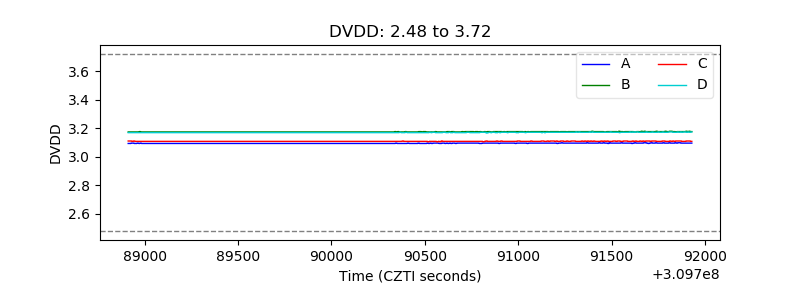 |
| Temperature 1 | 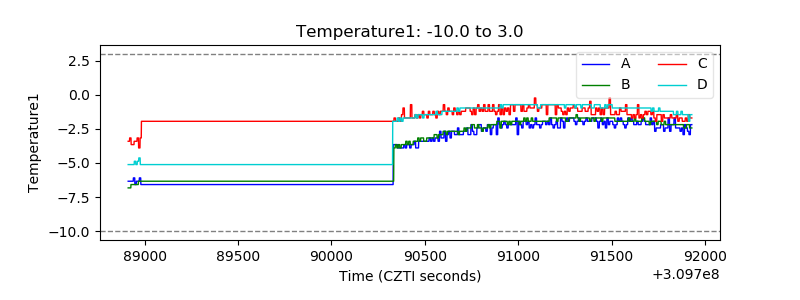 |
| Veto HV Monitor | 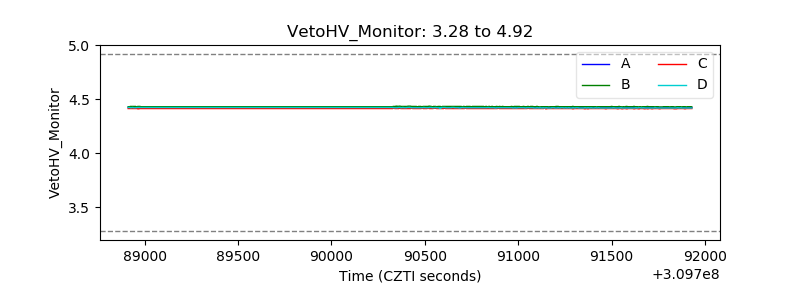 |
| Veto LLD | 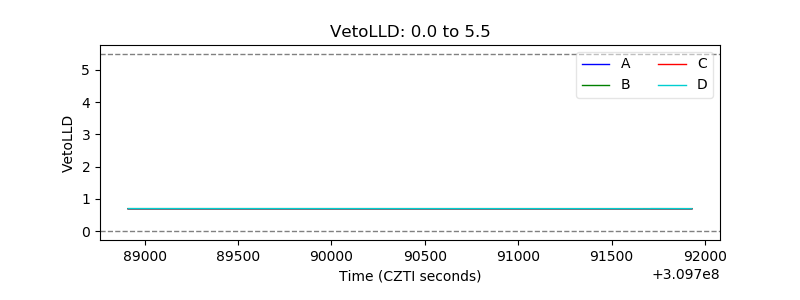 |
| Alpha Counter | 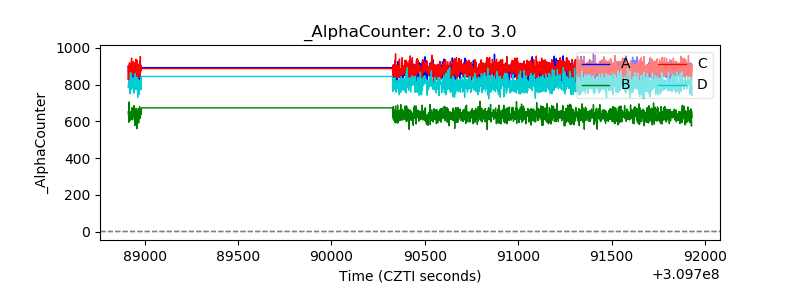 |
| _CPM_Rate | 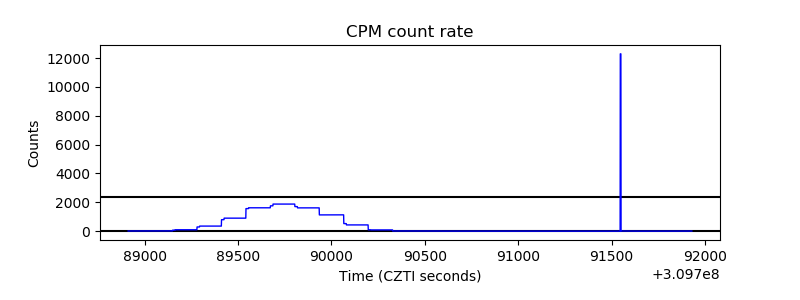 |
| CZT Counter | 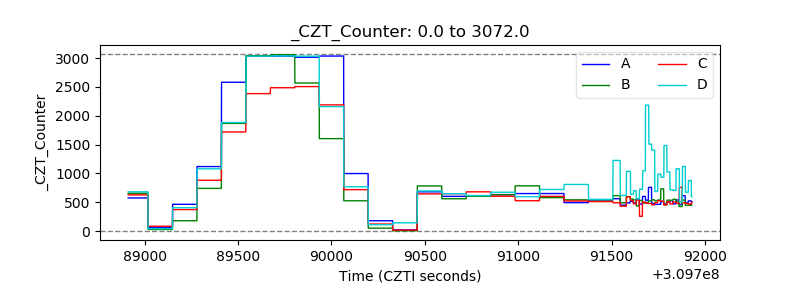 |
| +2.5 Volts monitor |  |
| +5 Volts monitor | 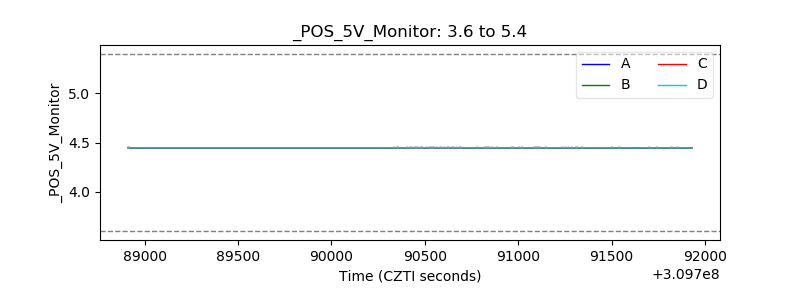 |
| _ROLL_ROT | 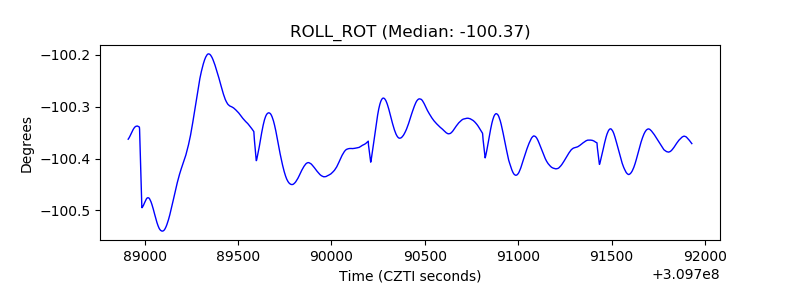 |
| _Roll_DEC | 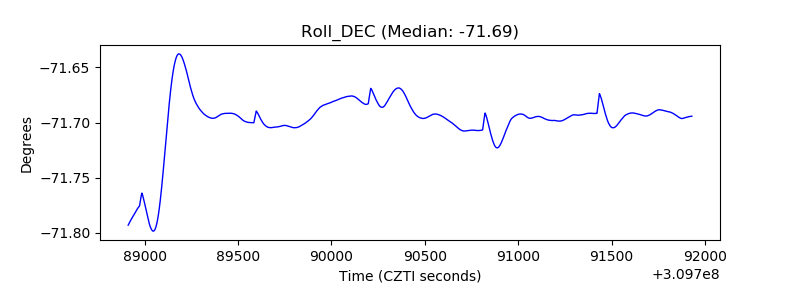 |
| _Roll_RA | 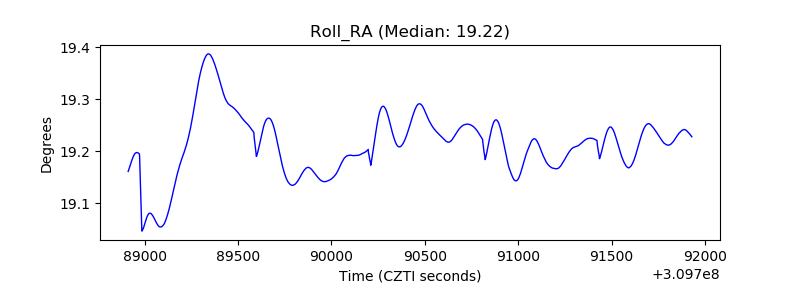 |
| Veto Counter | 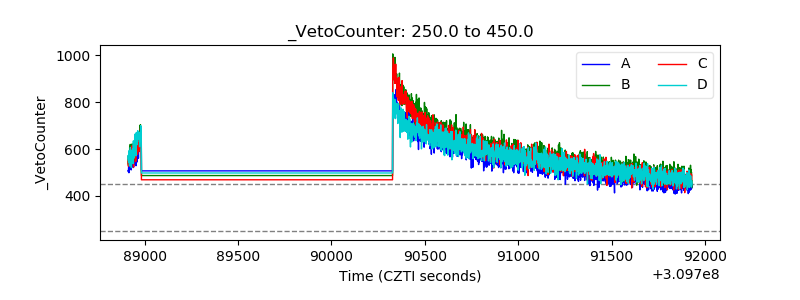 |