| Param | Original file | Final file |
|---|---|---|
| Filename | modeM0/AS1A07_047T09_9000003260_22046cztM0_level2.evt | modeM0/AS1A07_047T09_9000003260_22046cztM0_level2_quad_clean.evt |
| Size (bytes) | 476,933,760 | 136,477,440 |
| Size | 454.8 MB | 130.2 MB |
| Events in quadrant A | 3,171,396 | 946,943 |
| Events in quadrant B | 3,374,940 | 958,086 |
| Events in quadrant C | 3,175,417 | 910,155 |
| Events in quadrant D | 4,294,215 | 878,606 |
| Mode M0 | |||
|---|---|---|---|
| Quadrant | BADHDUFLAG | Total packets | Discarded packets |
| A | 0 | 13368 | 1 |
| B | 0 | 13915 | 1 |
| C | 0 | 13343 | 1 |
| D | 0 | 17047 | 1 |
| Mode M9 | |||
|---|---|---|---|
| Quadrant | BADHDUFLAG | Total packets | Discarded packets |
| A | 0 | 12 | 0 |
| B | 0 | 12 | 0 |
| C | 0 | 12 | 0 |
| D | 0 | 12 | 0 |
| Mode SS | |||
|---|---|---|---|
| Quadrant | BADHDUFLAG | Total packets | Discarded packets |
| A | 0 | 128 | 0 |
| B | 0 | 128 | 0 |
| C | 0 | 128 | 0 |
| D | 0 | 128 | 0 |
| Quadrant | Total seconds | Saturated seconds | Saturation percentage |
|---|---|---|---|
| A | 6300 | 100 | 1.587302% |
| B | 6301 | 136 | 2.158388% |
| C | 6301 | 137 | 2.174258% |
| D | 6301 | 351 | 5.570544% |
Noise dominated data is calculated using 1-second bins in cleaned event files. If a bin has >2000 counts, and if more than 50% of those come from <1% of pixels, then it is considered to be noise-dominated and hence unusable.
| Quadrant | # 1 sec bins | Bins with >0 counts | Bins with >2000 counts | High rate bins dominated by noise | Noise dominated (total time) | Noise dominated (detector-on time) | Marked lightcurve |
|---|---|---|---|---|---|---|---|
| A | 7530 | 6300 | 0 | 0 | 0.00% | 0.00% | 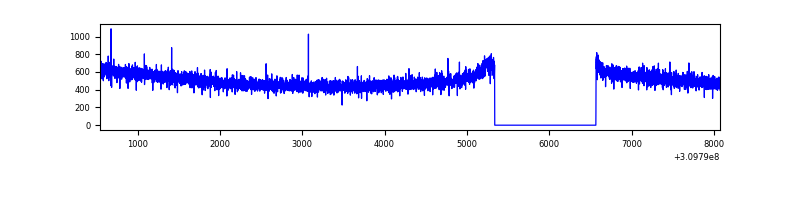 |
| B | 7531 | 6301 | 8 | 8 | 0.11% | 0.13% | 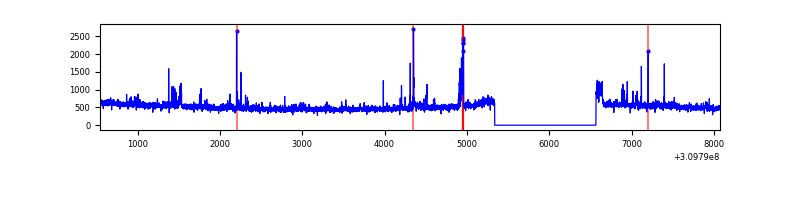 |
| C | 7531 | 6301 | 0 | 0 | 0.00% | 0.00% |  |
| D | 7530 | 6300 | 276 | 276 | 3.67% | 4.38% | 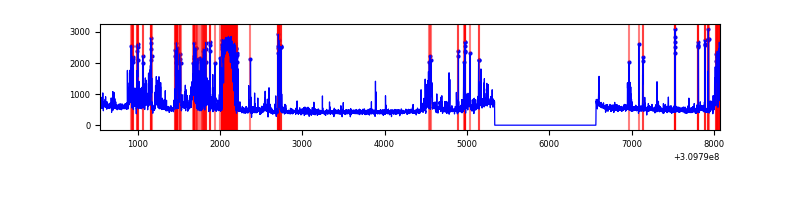 |
Top three noisy pixels from each quadrant. If the there are fewer than three noisy pixels in the level2.evt file, extra rows are filled as -1
| Pixel properties | Quadrant properties | ||||||
|---|---|---|---|---|---|---|---|
| Quadrant | DetID | PixID | Counts | Sigma | Mean | Median | Sigma |
| A | 13 | 254 | 9932 | 55.94 | 822 | 808 | 163.1 |
| A | 0 | 226 | 7056 | 38.3 | 822 | 808 | 163.1 |
| A | 3 | 137 | 6382 | 34.17 | 822 | 808 | 163.1 |
| B | 3 | 64 | 91329 | 600.68 | 814 | 796 | 150.7 |
| B | 0 | 190 | 39893 | 259.4 | 814 | 796 | 150.7 |
| B | 0 | 197 | 30609 | 197.81 | 814 | 796 | 150.7 |
| C | 14 | 238 | 126571 | 710.07 | 777 | 784 | 177.1 |
| C | 10 | 22 | 9307 | 48.11 | 777 | 784 | 177.1 |
| C | 9 | 54 | 6262 | 30.92 | 777 | 784 | 177.1 |
| D | 12 | 233 | 824242 | 4410.31 | 778 | 755 | 186.7 |
| D | 11 | 176 | 169950 | 906.15 | 778 | 755 | 186.7 |
| D | 13 | 249 | 107599 | 572.22 | 778 | 755 | 186.7 |
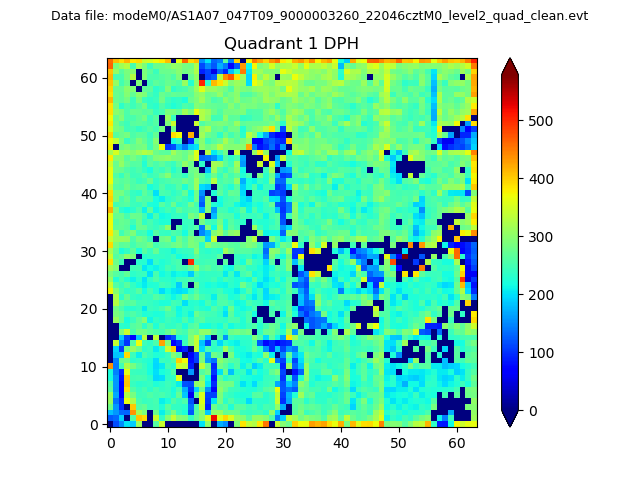
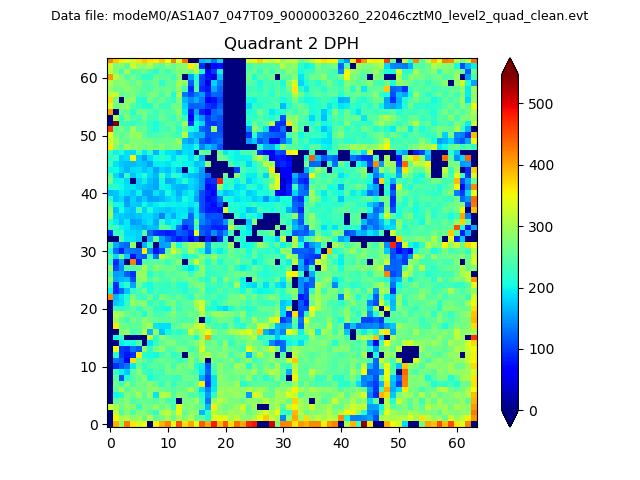
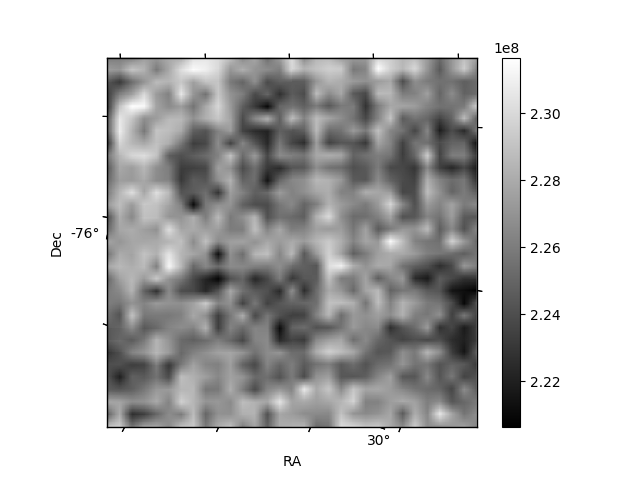
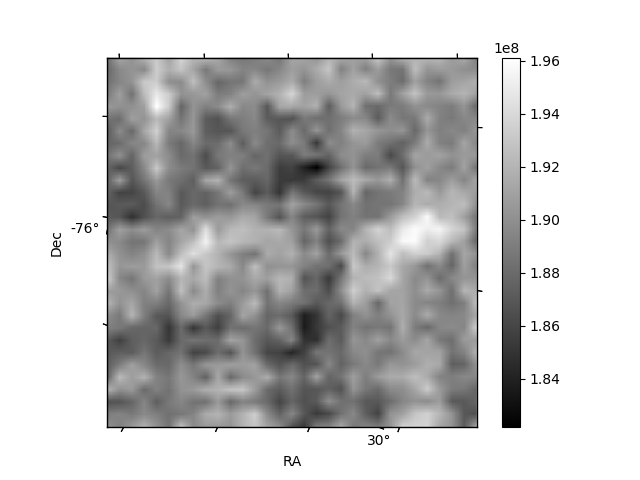
Histogram calculated using DETX and DETY for each event in the final _common_clean file
| Quadrant A | 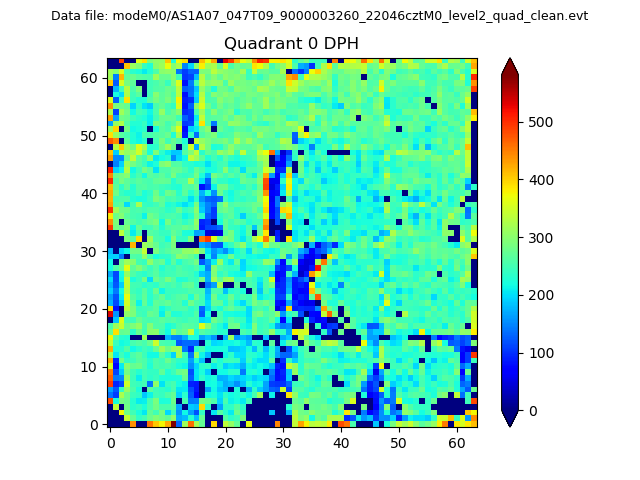 |
 |
Quadrant B |
|---|---|---|---|
| Quadrant D |  |
 |
Quadrant C |
| Plot type | Count rate plots | Images |
|---|---|---|
| Comparison with Poisson distribution Blue bars denote a histogram of data divided into 1 sec bins. Red curve is a Poisson curve with rate = median count rate of data. |
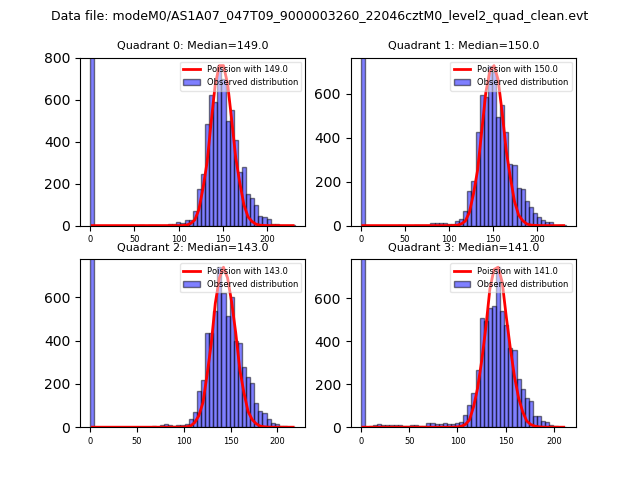 |
 |
| Quadrant-wise count rates Data is divided into 100 sec bins |
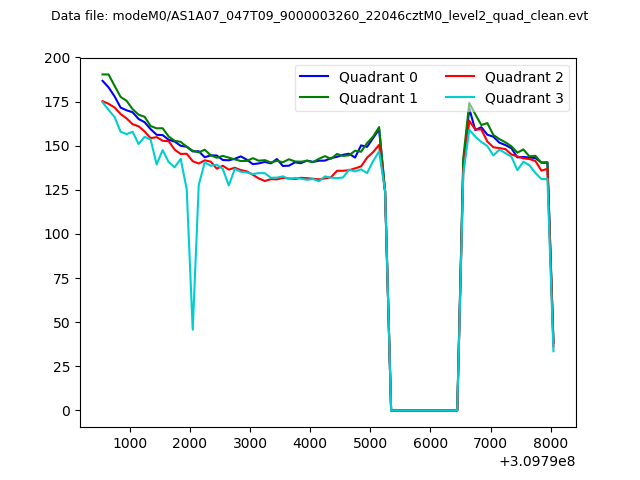 |
|
| Module-wise count rates for Quadrant A Data is divided into 100 sec bins |
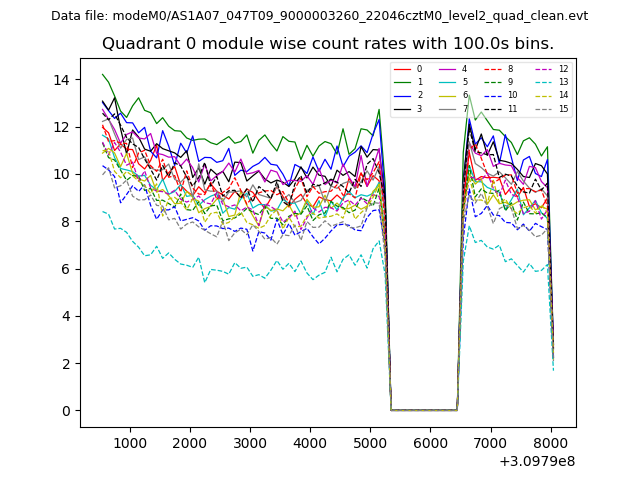 |
 |
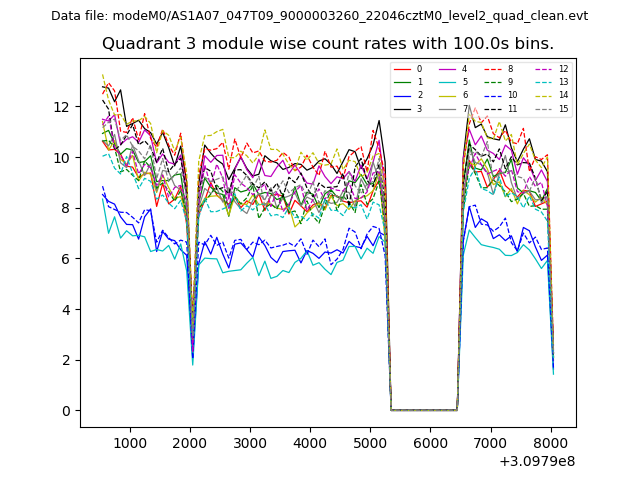
| Module-wise count rates for Quadrant B Data is divided into 100 sec bins |
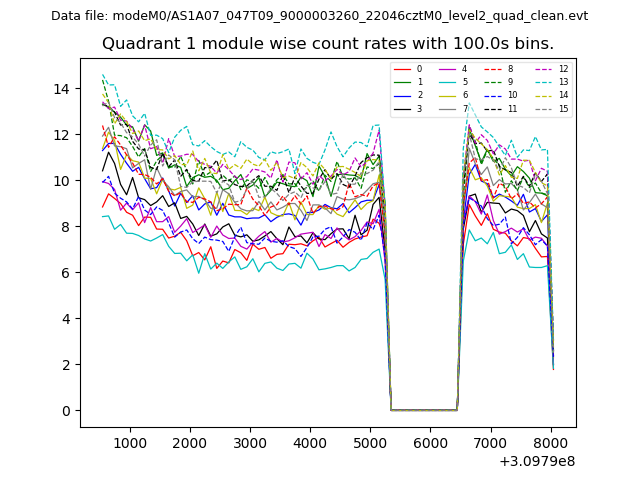 |
 |
| Module-wise count rates for Quadrant C Data is divided into 100 sec bins |
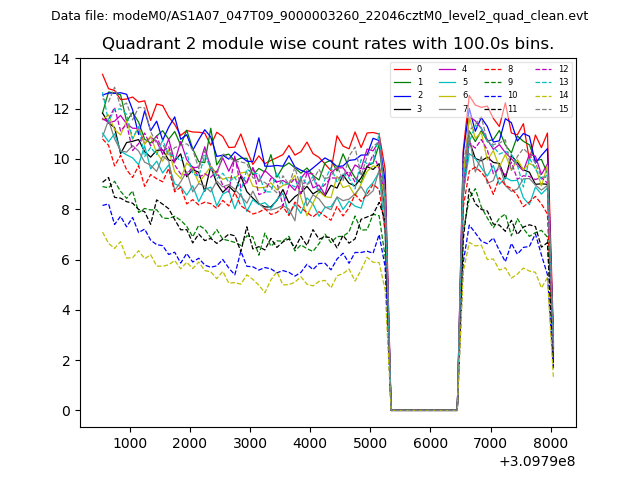 |
 |
| Module-wise count rates for Quadrant D Data is divided into 100 sec bins |
 |
 |
| Parameter | Plot |
|---|---|
| CZT HV Monitor | 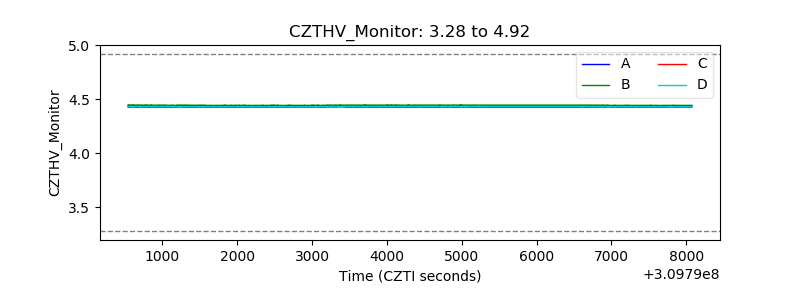 |
| D_VDD | 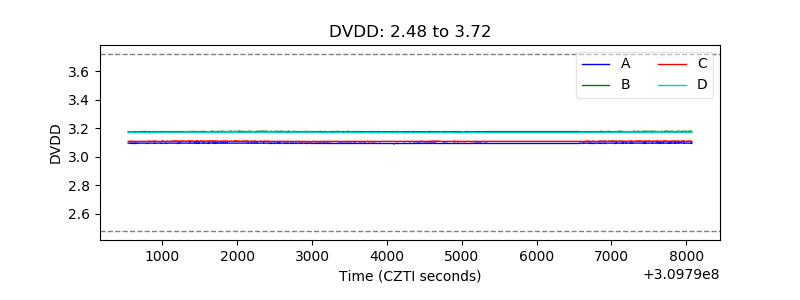 |
| Temperature 1 | 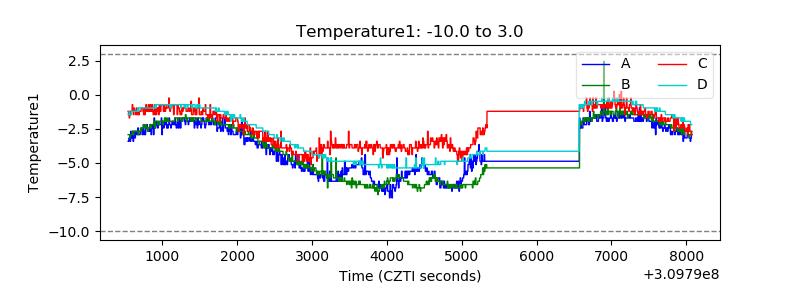 |
| Veto HV Monitor | 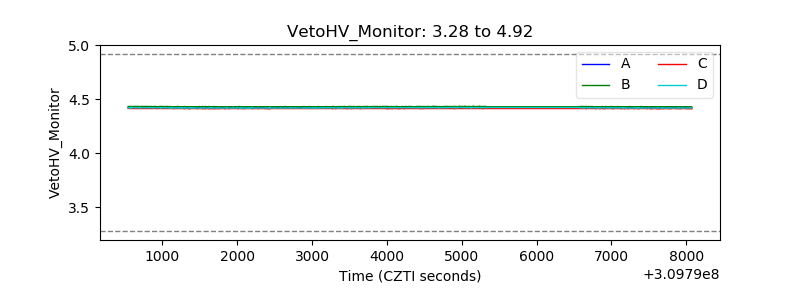 |
| Veto LLD | 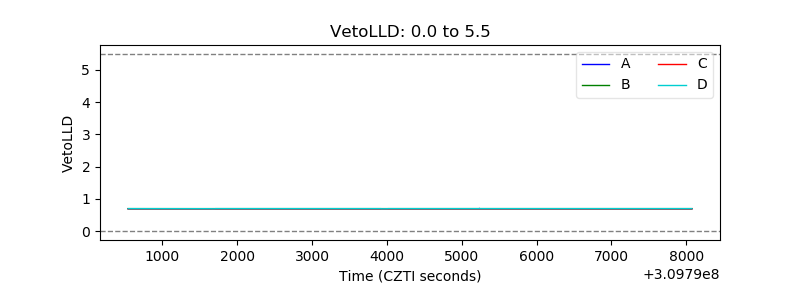 |
| Alpha Counter | 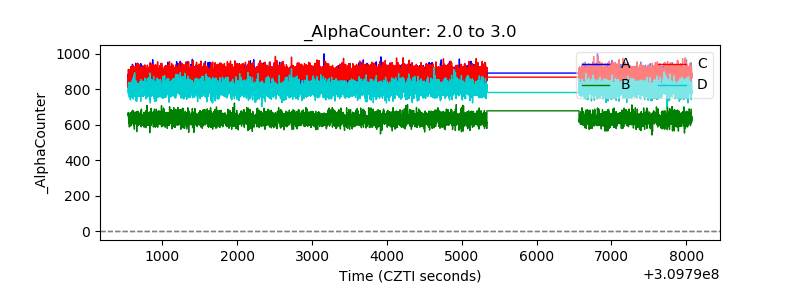 |
| _CPM_Rate | 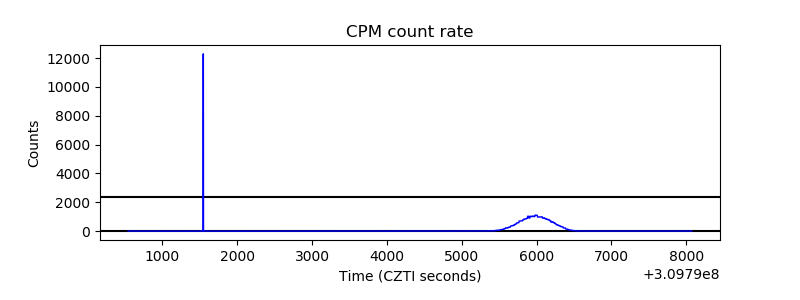 |
| CZT Counter | 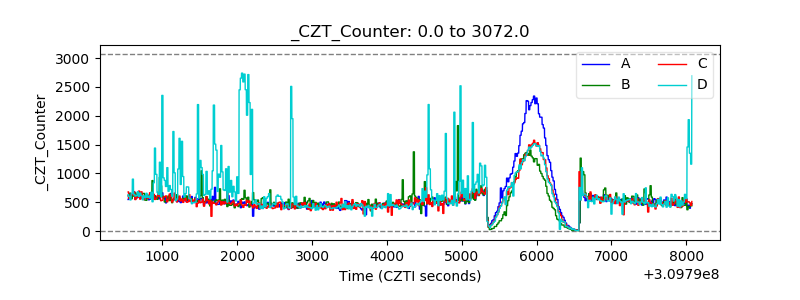 |
| +2.5 Volts monitor |  |
| +5 Volts monitor |  |
| _ROLL_ROT | 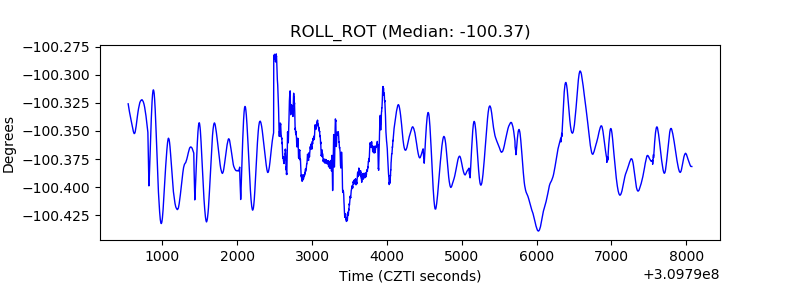 |
| _Roll_DEC | 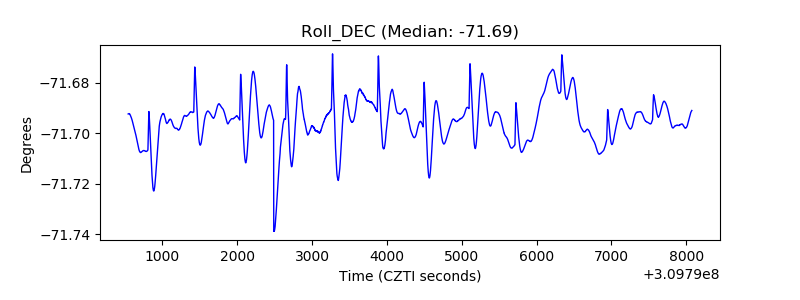 |
| _Roll_RA | 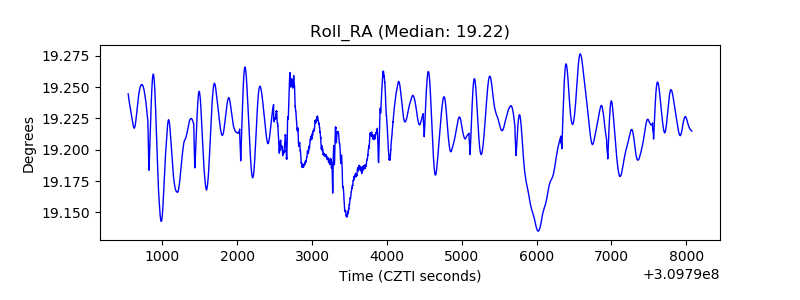 |
| Veto Counter | 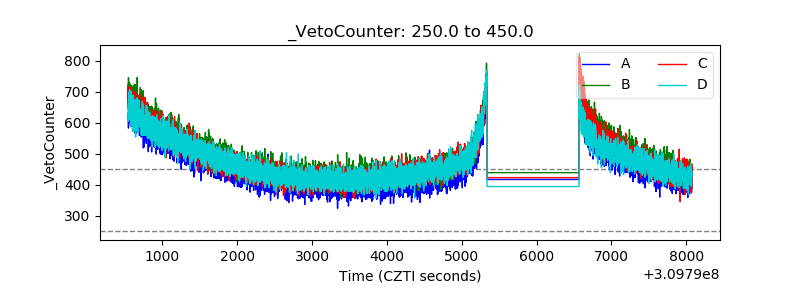 |