| Param | Original file | Final file |
|---|---|---|
| Filename | modeM0/AS1A07_047T09_9000003260_22047cztM0_level2.evt | modeM0/AS1A07_047T09_9000003260_22047cztM0_level2_quad_clean.evt |
| Size (bytes) | 189,656,640 | 55,454,400 |
| Size | 180.9 MB | 52.9 MB |
| Events in quadrant A | 1,261,978 | 379,634 |
| Events in quadrant B | 1,338,922 | 383,921 |
| Events in quadrant C | 1,255,903 | 368,405 |
| Events in quadrant D | 1,703,531 | 356,184 |
| Mode M0 | |||
|---|---|---|---|
| Quadrant | BADHDUFLAG | Total packets | Discarded packets |
| A | 0 | 5459 | 0 |
| B | 0 | 5686 | 0 |
| C | 0 | 5459 | 0 |
| D | 0 | 6852 | 0 |
| Mode SS | |||
|---|---|---|---|
| Quadrant | BADHDUFLAG | Total packets | Discarded packets |
| A | 0 | 52 | 0 |
| B | 0 | 52 | 0 |
| C | 0 | 52 | 0 |
| D | 0 | 52 | 0 |
| Quadrant | Total seconds | Saturated seconds | Saturation percentage |
|---|---|---|---|
| A | 2672 | 3 | 0.112275% |
| B | 2673 | 6 | 0.224467% |
| C | 2673 | 12 | 0.448934% |
| D | 2673 | 110 | 4.115226% |
Noise dominated data is calculated using 1-second bins in cleaned event files. If a bin has >2000 counts, and if more than 50% of those come from <1% of pixels, then it is considered to be noise-dominated and hence unusable.
| Quadrant | # 1 sec bins | Bins with >0 counts | Bins with >2000 counts | High rate bins dominated by noise | Noise dominated (total time) | Noise dominated (detector-on time) | Marked lightcurve |
|---|---|---|---|---|---|---|---|
| A | 2672 | 2672 | 0 | 0 | 0.00% | 0.00% | 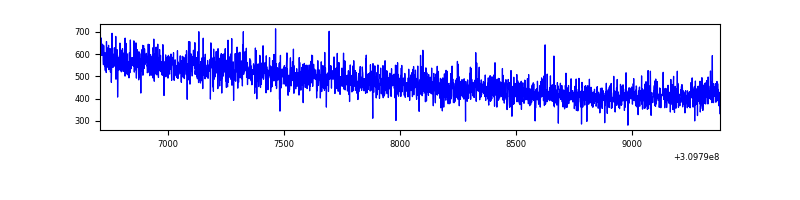 |
| B | 2673 | 2673 | 3 | 3 | 0.11% | 0.11% | 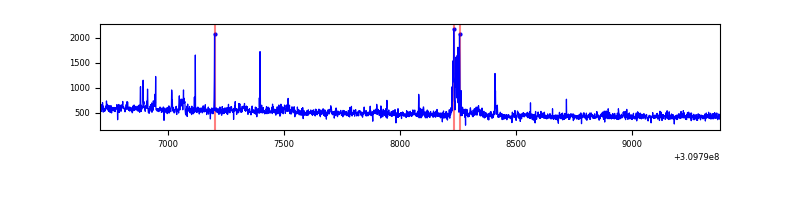 |
| C | 2673 | 2673 | 0 | 0 | 0.00% | 0.00% | 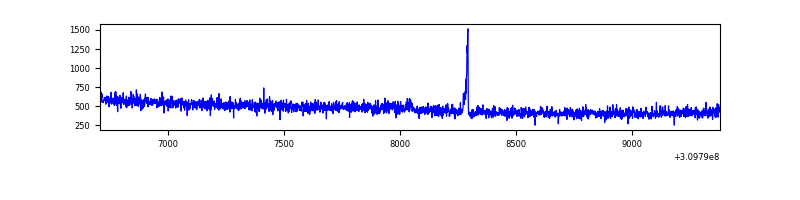 |
| D | 2673 | 2673 | 134 | 134 | 5.01% | 5.01% | 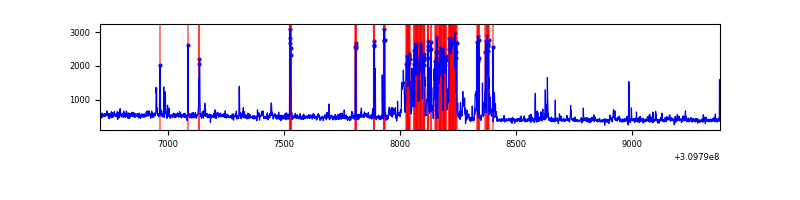 |
Top three noisy pixels from each quadrant. If the there are fewer than three noisy pixels in the level2.evt file, extra rows are filled as -1
| Pixel properties | Quadrant properties | ||||||
|---|---|---|---|---|---|---|---|
| Quadrant | DetID | PixID | Counts | Sigma | Mean | Median | Sigma |
| A | 13 | 254 | 4797 | 66.77 | 327 | 322 | 67.0 |
| A | 0 | 226 | 2810 | 37.13 | 327 | 322 | 67.0 |
| A | 3 | 137 | 2536 | 33.04 | 327 | 322 | 67.0 |
| B | 3 | 64 | 39446 | 626.73 | 324 | 317 | 62.4 |
| B | 0 | 190 | 16546 | 259.94 | 324 | 317 | 62.4 |
| B | 12 | 111 | 6602 | 100.67 | 324 | 317 | 62.4 |
| C | 14 | 238 | 49473 | 694.01 | 304 | 306 | 70.8 |
| C | 10 | 22 | 19108 | 265.4 | 304 | 306 | 70.8 |
| C | 13 | 61 | 2140 | 25.89 | 304 | 306 | 70.8 |
| D | 13 | 249 | 398269 | 5406.27 | 306 | 298 | 73.6 |
| D | 12 | 233 | 42777 | 577.06 | 306 | 298 | 73.6 |
| D | 13 | 172 | 27121 | 364.38 | 306 | 298 | 73.6 |
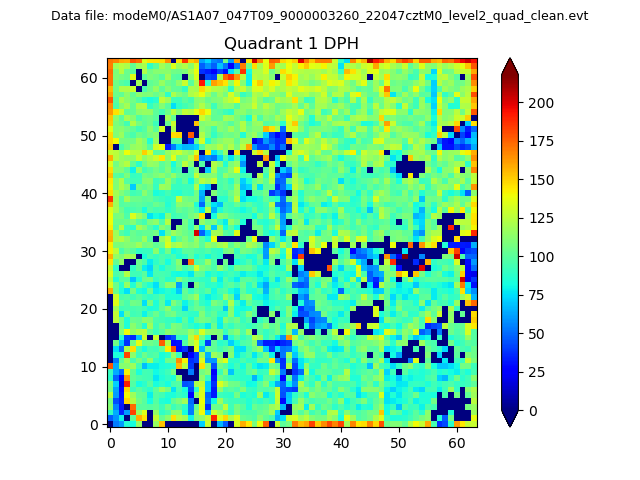
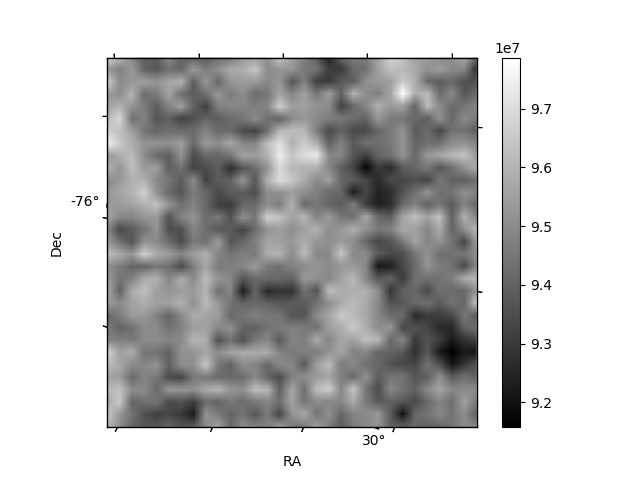
Histogram calculated using DETX and DETY for each event in the final _common_clean file
| Quadrant A |  |
 |
Quadrant B |
|---|---|---|---|
| Quadrant D | 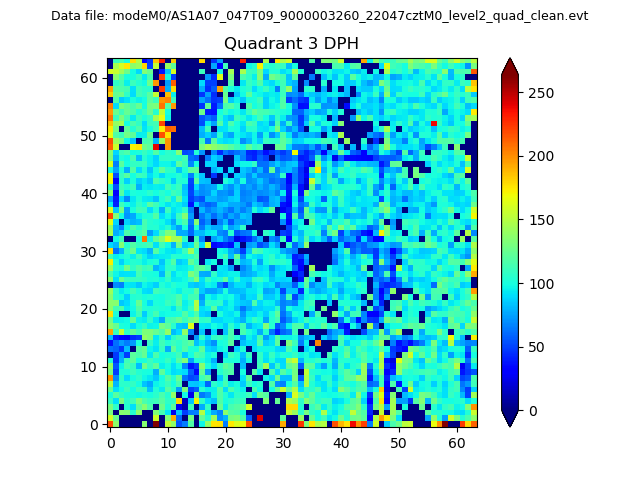 |
 |
Quadrant C |
| Plot type | Count rate plots | Images |
|---|---|---|
| Comparison with Poisson distribution Blue bars denote a histogram of data divided into 1 sec bins. Red curve is a Poisson curve with rate = median count rate of data. |
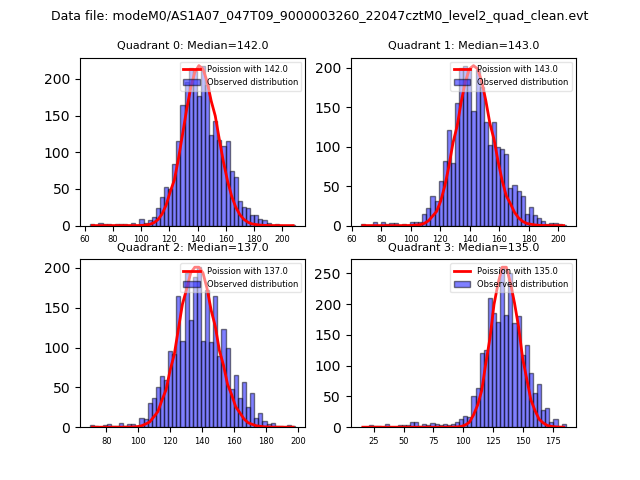 |
 |
| Quadrant-wise count rates Data is divided into 100 sec bins |
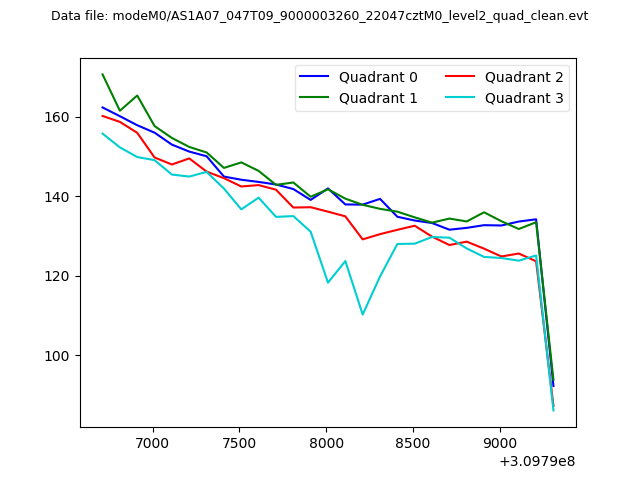 |
|
| Module-wise count rates for Quadrant A Data is divided into 100 sec bins |
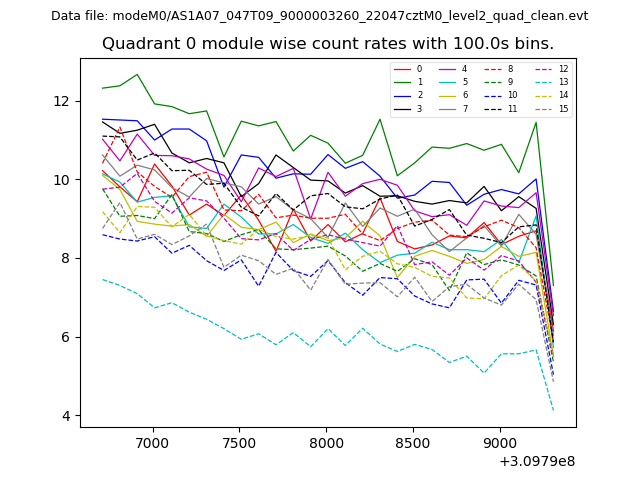 |
 |
| Module-wise count rates for Quadrant B Data is divided into 100 sec bins |
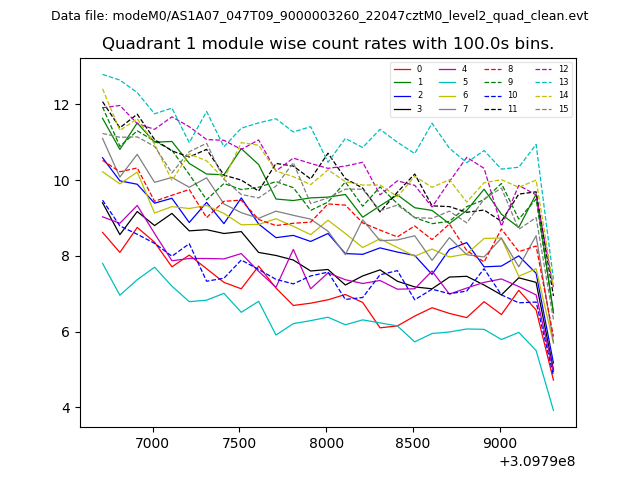 |
 |
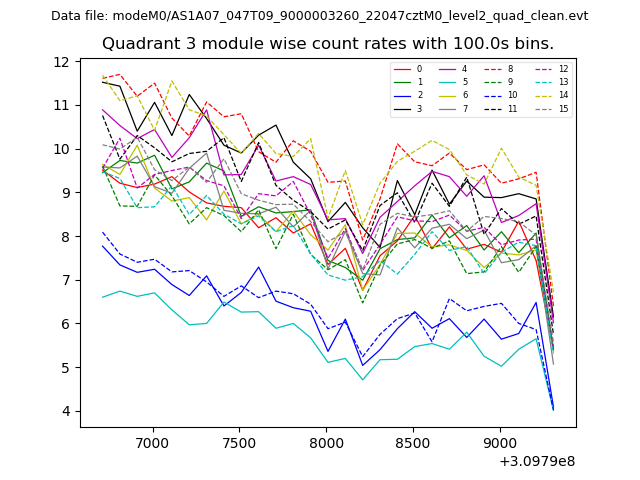
| Module-wise count rates for Quadrant C Data is divided into 100 sec bins |
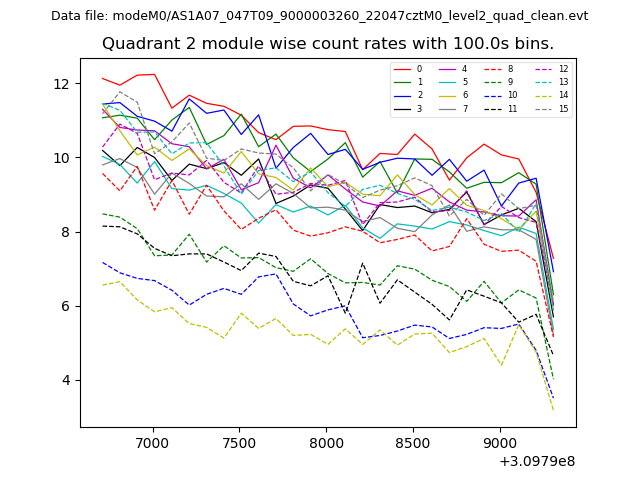 |
 |
| Module-wise count rates for Quadrant D Data is divided into 100 sec bins |
 |
 |
| Parameter | Plot |
|---|---|
| CZT HV Monitor | 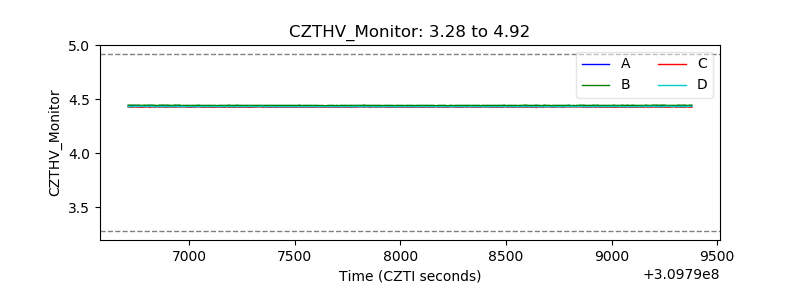 |
| D_VDD | 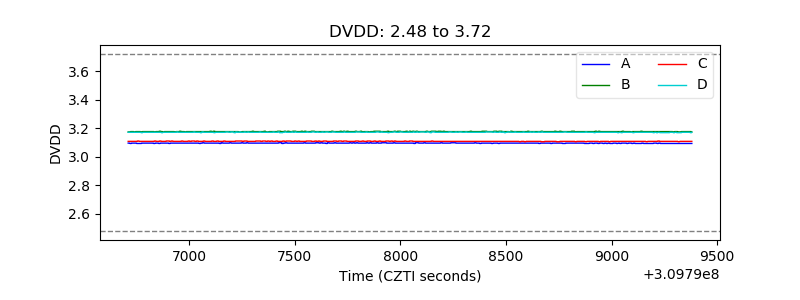 |
| Temperature 1 | 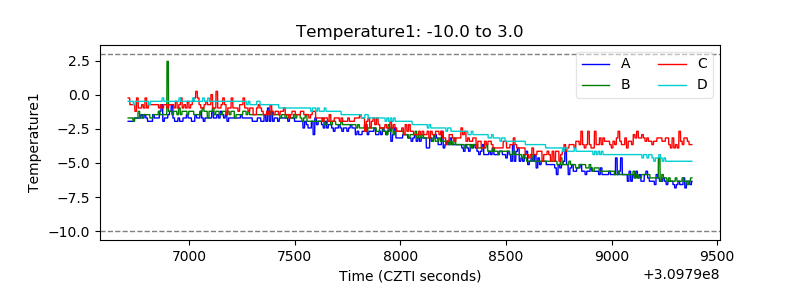 |
| Veto HV Monitor | 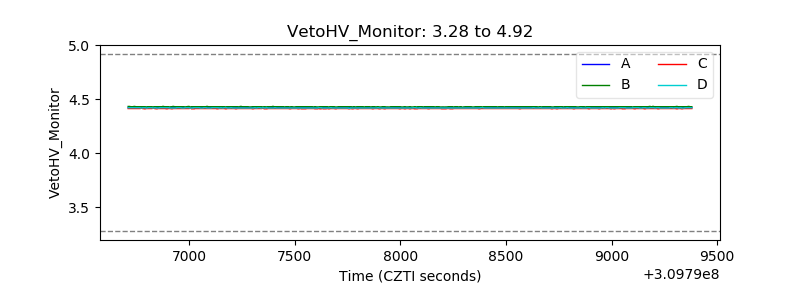 |
| Veto LLD | 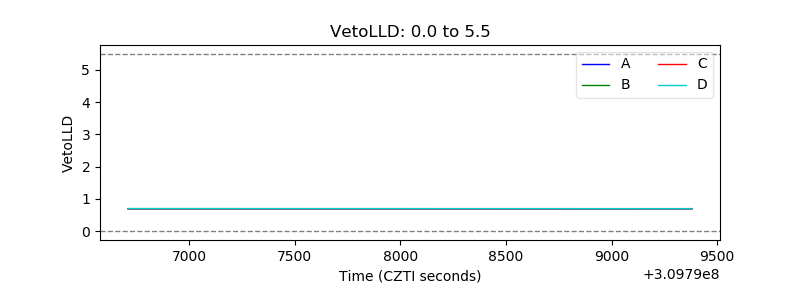 |
| Alpha Counter | 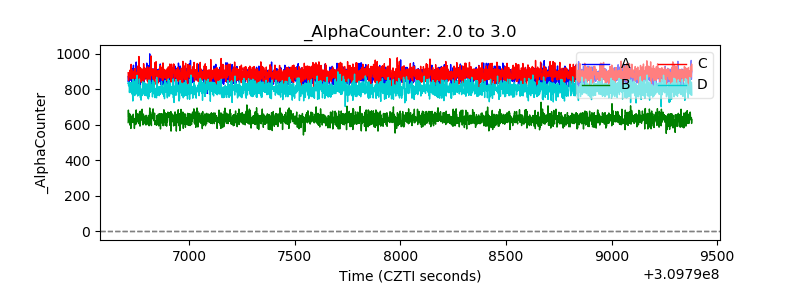 |
| _CPM_Rate | 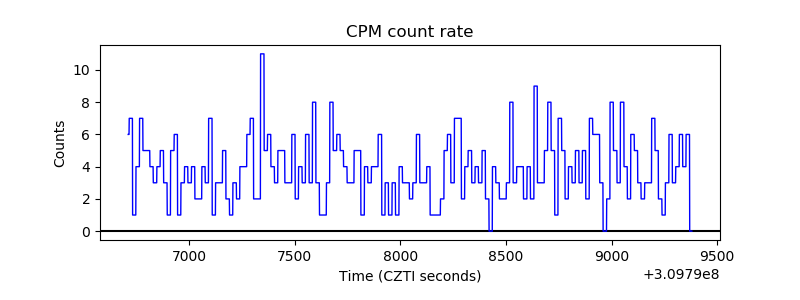 |
| CZT Counter | 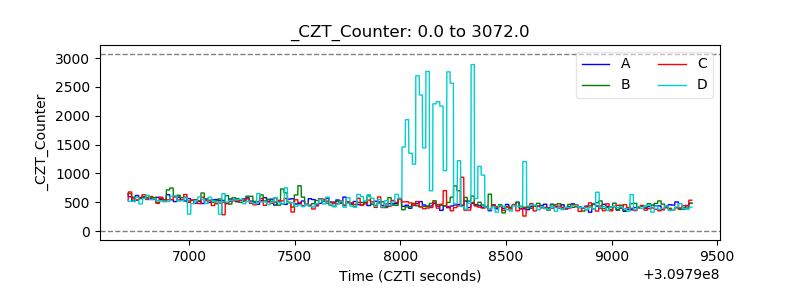 |
| +2.5 Volts monitor |  |
| +5 Volts monitor |  |
| _ROLL_ROT | 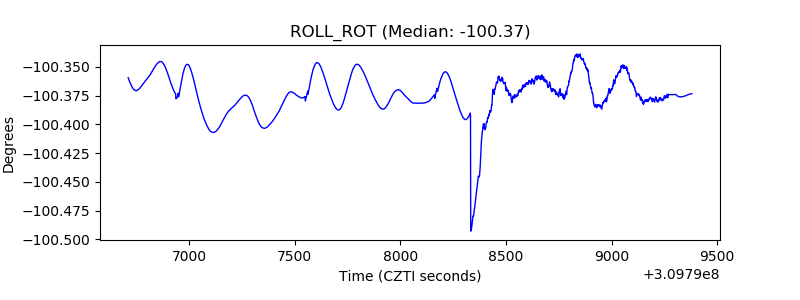 |
| _Roll_DEC | 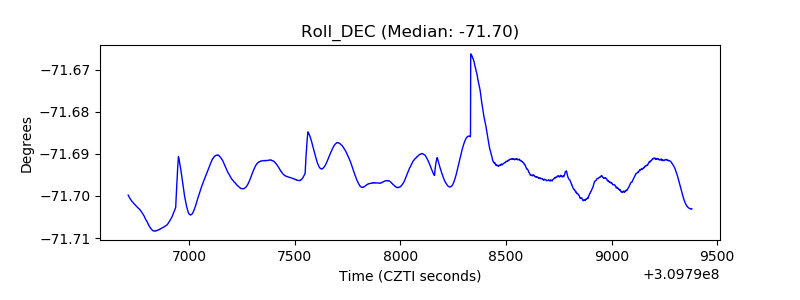 |
| _Roll_RA | 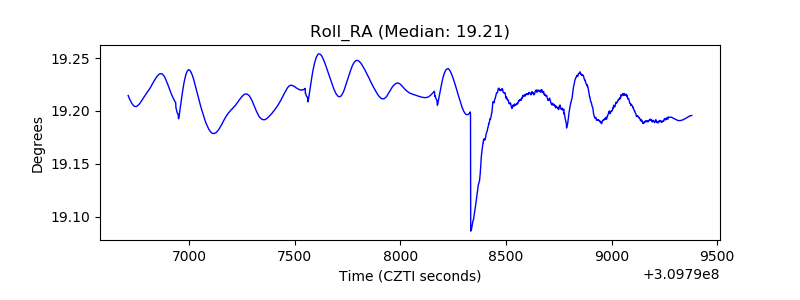 |
| Veto Counter | 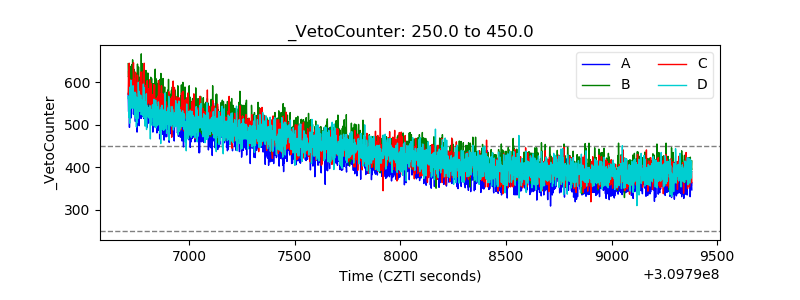 |