| Param | Original file | Final file |
|---|---|---|
| Filename | modeM0/AS1A07_167T01_9000003264_22049cztM0_level2.evt | modeM0/AS1A07_167T01_9000003264_22049cztM0_level2_quad_clean.evt |
| Size (bytes) | 374,019,840 | 73,486,080 |
| Size | 356.7 MB | 70.1 MB |
| Events in quadrant A | 2,368,845 | 478,907 |
| Events in quadrant B | 2,439,341 | 488,357 |
| Events in quadrant C | 2,361,394 | 465,387 |
| Events in quadrant D | 3,823,358 | 448,119 |
| Mode M0 | |||
|---|---|---|---|
| Quadrant | BADHDUFLAG | Total packets | Discarded packets |
| A | 0 | 10214 | 1 |
| B | 0 | 10368 | 2 |
| C | 0 | 10122 | 1 |
| D | 0 | 14700 | 1 |
| Mode M9 | |||
|---|---|---|---|
| Quadrant | BADHDUFLAG | Total packets | Discarded packets |
| A | 0 | 3 | 0 |
| B | 0 | 3 | 0 |
| C | 0 | 3 | 0 |
| D | 0 | 3 | 0 |
| Mode SS | |||
|---|---|---|---|
| Quadrant | BADHDUFLAG | Total packets | Discarded packets |
| A | 0 | 100 | 0 |
| B | 0 | 100 | 0 |
| C | 0 | 100 | 0 |
| D | 0 | 100 | 0 |
| Quadrant | Total seconds | Saturated seconds | Saturation percentage |
|---|---|---|---|
| A | 4912 | 61 | 1.241857% |
| B | 4911 | 78 | 1.588271% |
| C | 4911 | 65 | 1.323559% |
| D | 4911 | 244 | 4.968438% |
Noise dominated data is calculated using 1-second bins in cleaned event files. If a bin has >2000 counts, and if more than 50% of those come from <1% of pixels, then it is considered to be noise-dominated and hence unusable.
| Quadrant | # 1 sec bins | Bins with >0 counts | Bins with >2000 counts | High rate bins dominated by noise | Noise dominated (total time) | Noise dominated (detector-on time) | Marked lightcurve |
|---|---|---|---|---|---|---|---|
| A | 5212 | 4913 | 8 | 8 | 0.15% | 0.16% | 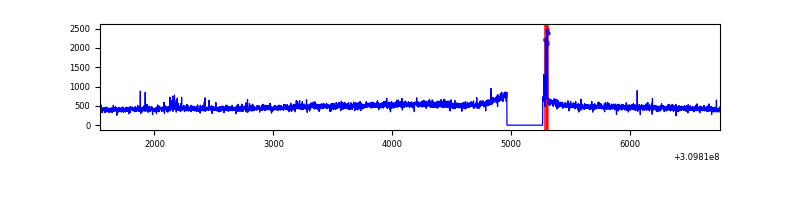 |
| B | 5211 | 4912 | 5 | 5 | 0.10% | 0.10% | 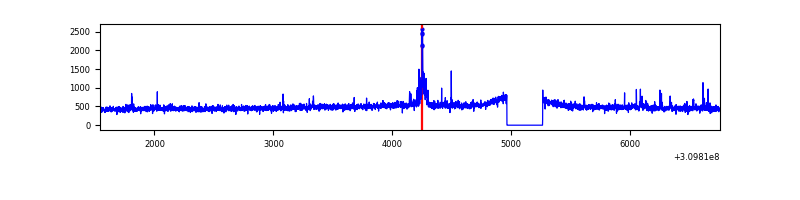 |
| C | 5211 | 4911 | 0 | 0 | 0.00% | 0.00% | 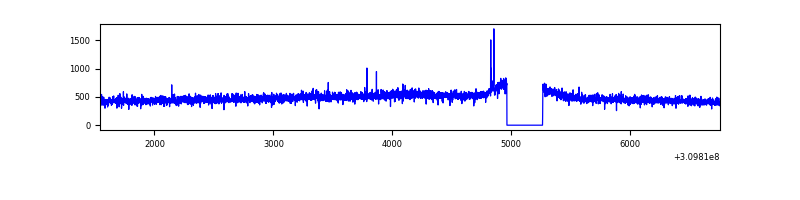 |
| D | 5211 | 4912 | 201 | 201 | 3.86% | 4.09% | 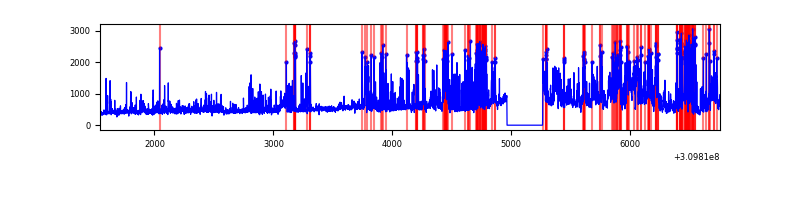 |
Top three noisy pixels from each quadrant. If the there are fewer than three noisy pixels in the level2.evt file, extra rows are filled as -1
| Pixel properties | Quadrant properties | ||||||
|---|---|---|---|---|---|---|---|
| Quadrant | DetID | PixID | Counts | Sigma | Mean | Median | Sigma |
| A | 15 | 236 | 28474 | 227.44 | 603 | 589 | 122.6 |
| A | 5 | 16 | 10308 | 79.27 | 603 | 589 | 122.6 |
| A | 13 | 254 | 8415 | 63.83 | 603 | 589 | 122.6 |
| B | 3 | 64 | 32616 | 277.94 | 601 | 587 | 115.2 |
| B | 0 | 197 | 23145 | 195.76 | 601 | 587 | 115.2 |
| B | 12 | 111 | 13497 | 112.03 | 601 | 587 | 115.2 |
| C | 14 | 238 | 90799 | 658.55 | 580 | 581 | 137.0 |
| C | 5 | 4 | 6448 | 42.83 | 580 | 581 | 137.0 |
| C | 13 | 61 | 4030 | 25.18 | 580 | 581 | 137.0 |
| D | 1 | 52 | 1150518 | 8023.62 | 582 | 564 | 143.3 |
| D | 12 | 233 | 125348 | 870.66 | 582 | 564 | 143.3 |
| D | 13 | 249 | 49781 | 343.4 | 582 | 564 | 143.3 |
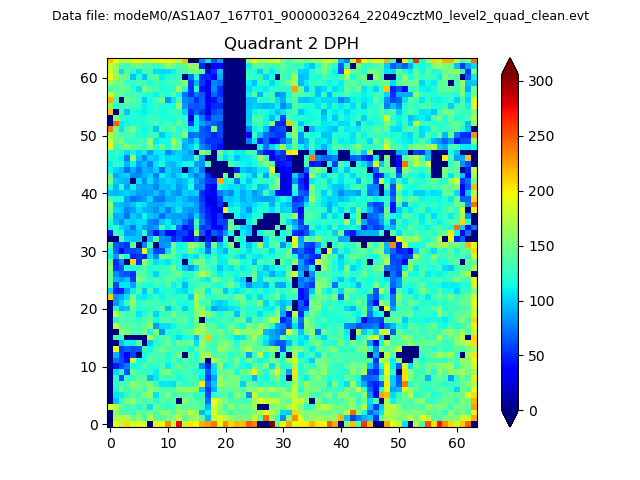
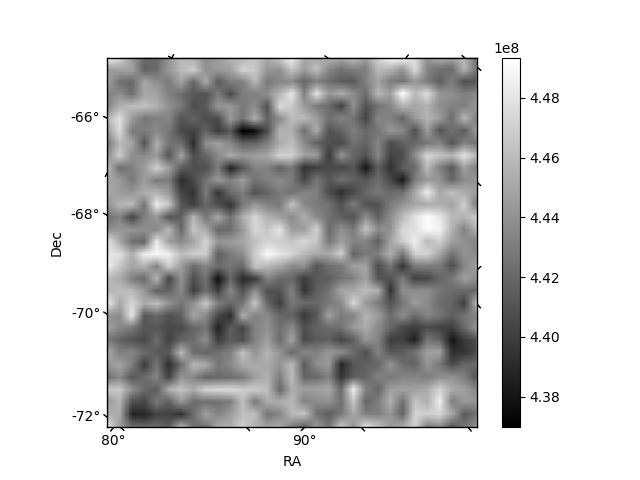
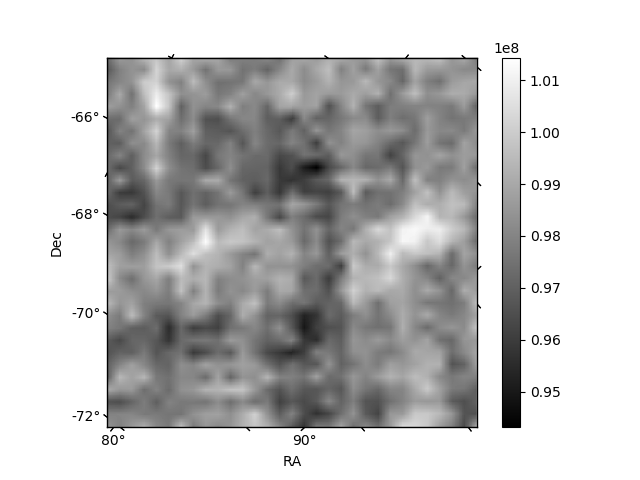
Histogram calculated using DETX and DETY for each event in the final _common_clean file
| Quadrant A | 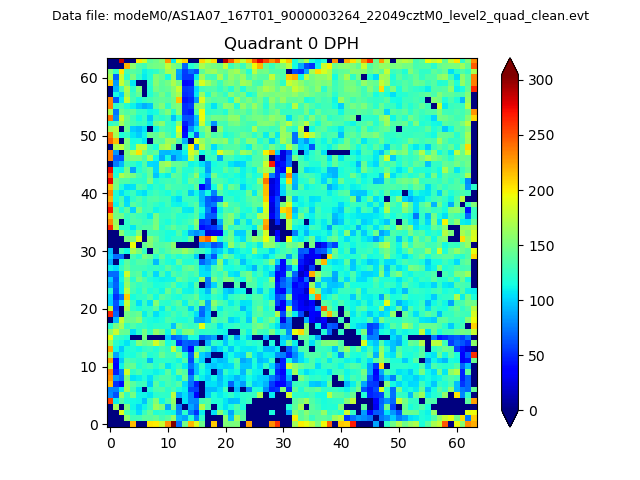 |
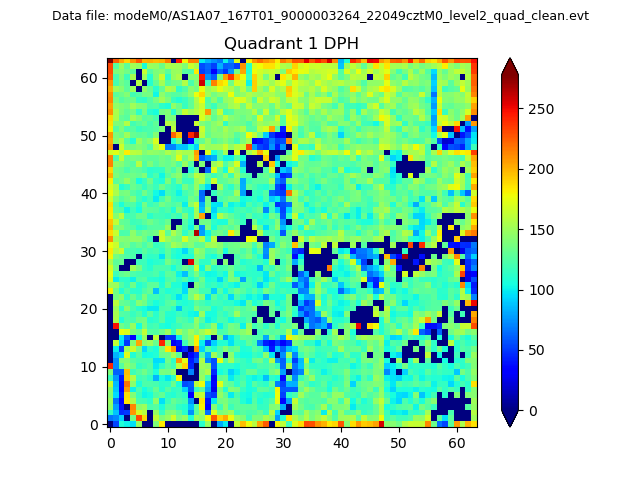 |
Quadrant B |
|---|---|---|---|
| Quadrant D | 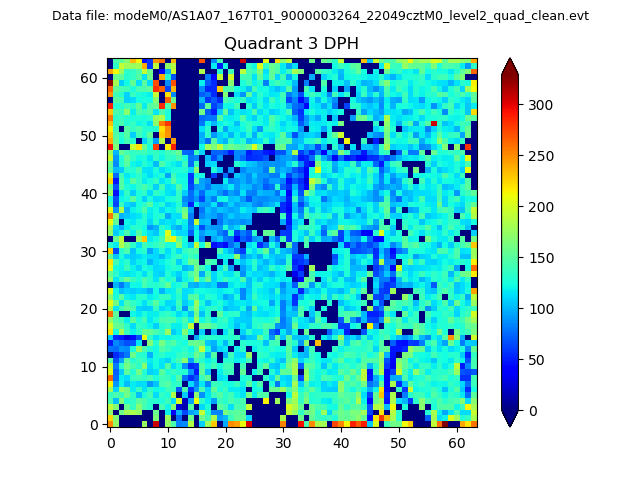 |
 |
Quadrant C |
| Plot type | Count rate plots | Images |
|---|---|---|
| Comparison with Poisson distribution Blue bars denote a histogram of data divided into 1 sec bins. Red curve is a Poisson curve with rate = median count rate of data. |
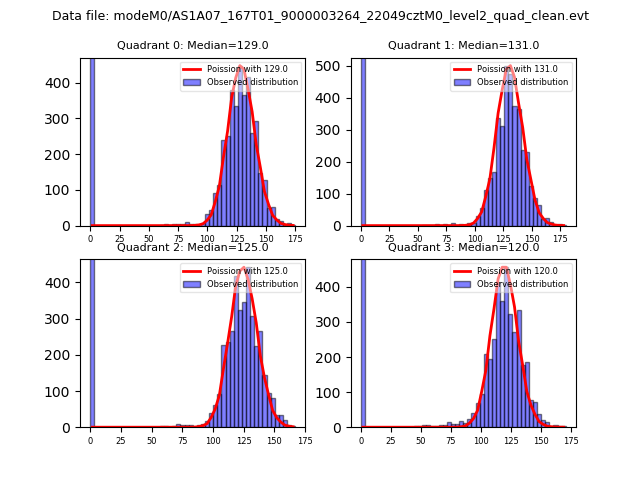 |
 |
| Quadrant-wise count rates Data is divided into 100 sec bins |
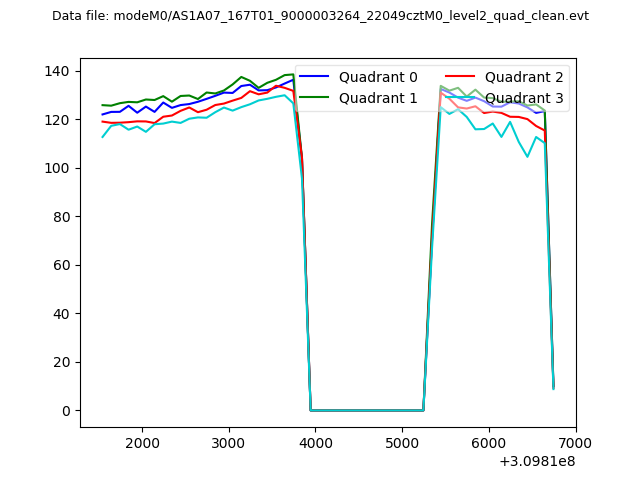 |
|
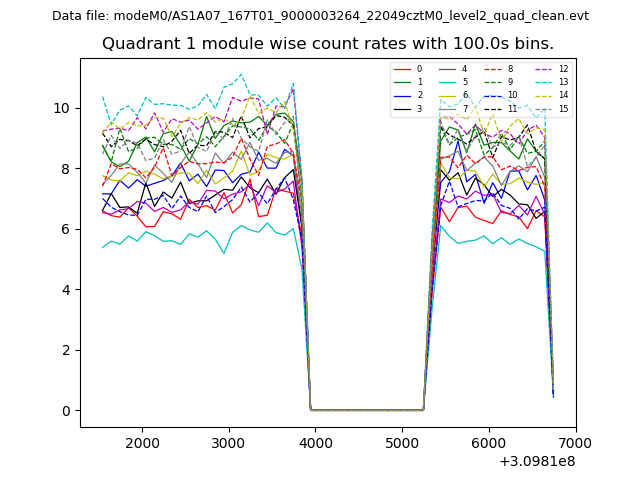
| Module-wise count rates for Quadrant A Data is divided into 100 sec bins |
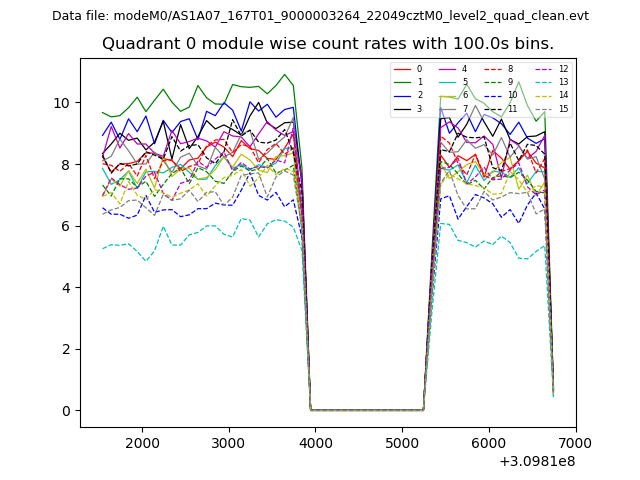 |
 |
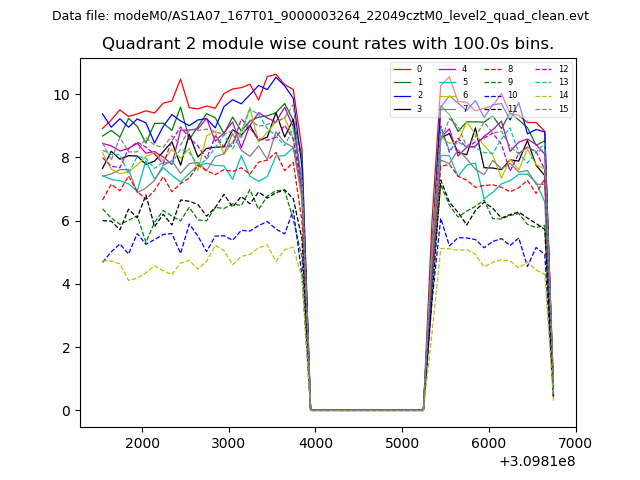
| Module-wise count rates for Quadrant B Data is divided into 100 sec bins |
 |
 |
| Module-wise count rates for Quadrant C Data is divided into 100 sec bins |
 |
 |
| Module-wise count rates for Quadrant D Data is divided into 100 sec bins |
 |
 |
| Parameter | Plot |
|---|---|
| CZT HV Monitor | 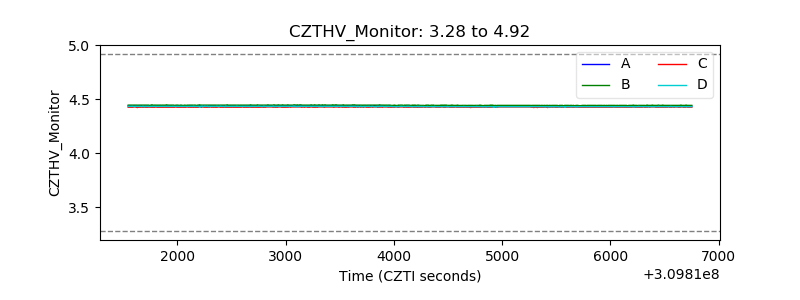 |
| D_VDD | 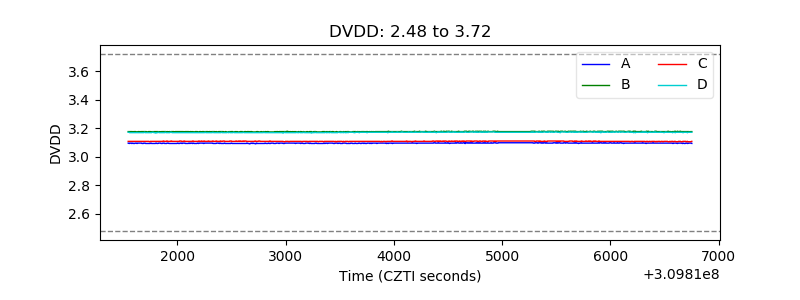 |
| Temperature 1 | 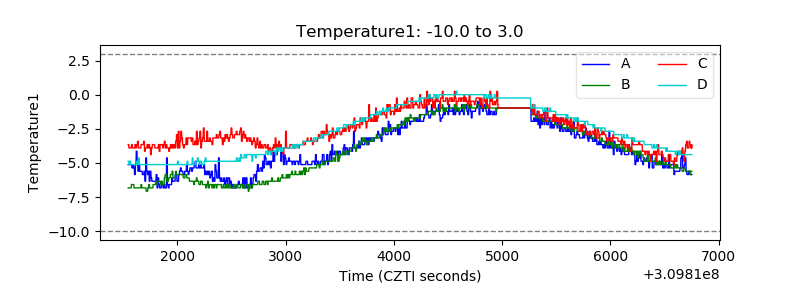 |
| Veto HV Monitor | 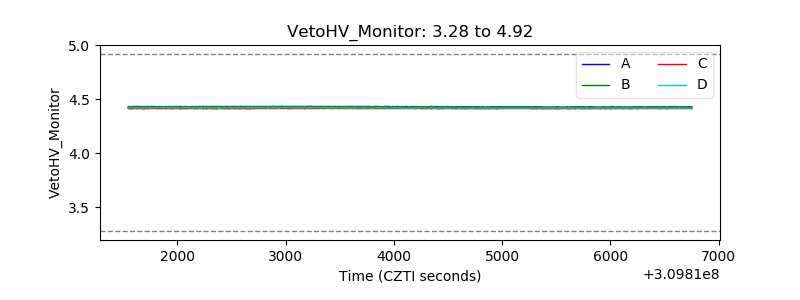 |
| Veto LLD | 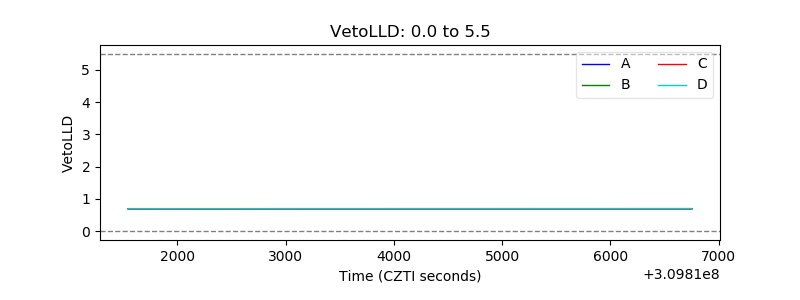 |
| Alpha Counter | 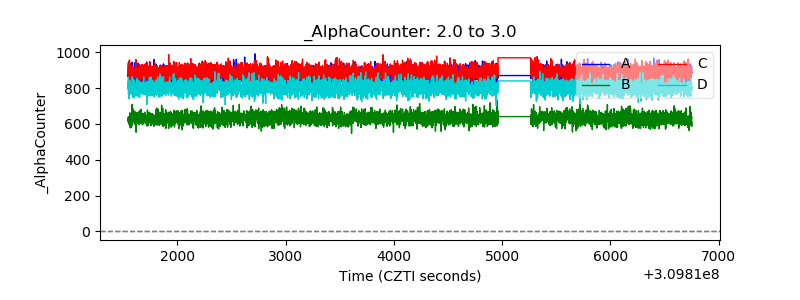 |
| _CPM_Rate | 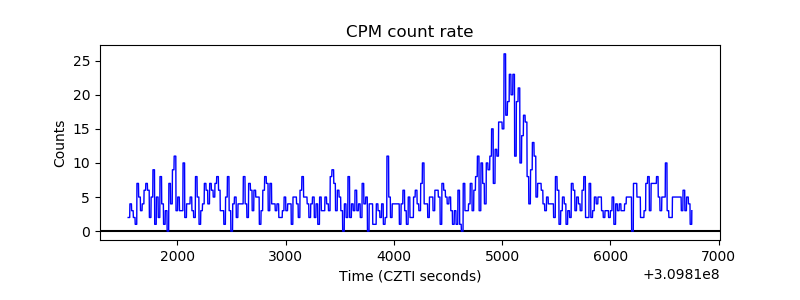 |
| CZT Counter | 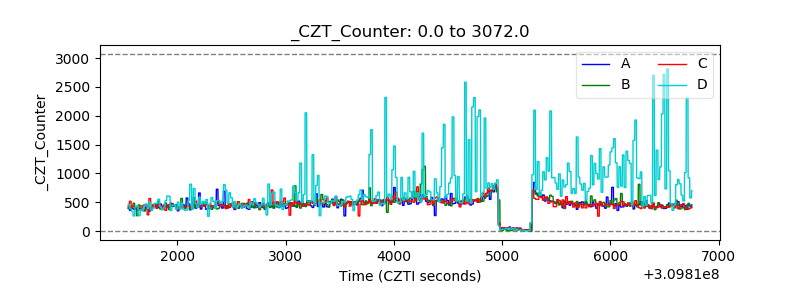 |
| +2.5 Volts monitor |  |
| +5 Volts monitor | 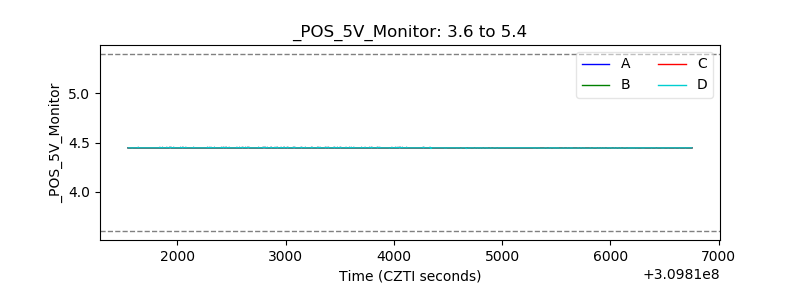 |
| _ROLL_ROT | 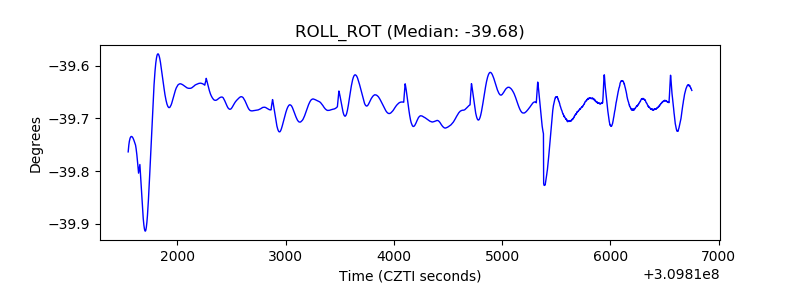 |
| _Roll_DEC | 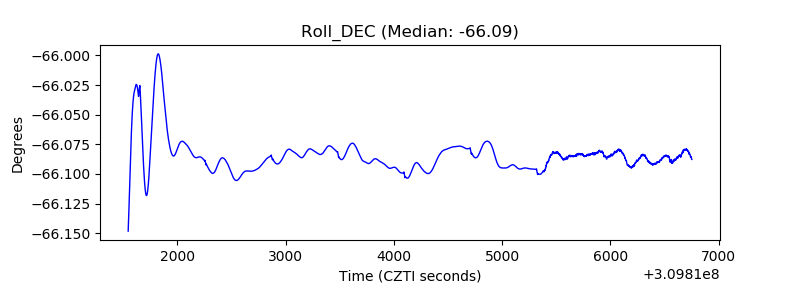 |
| _Roll_RA | 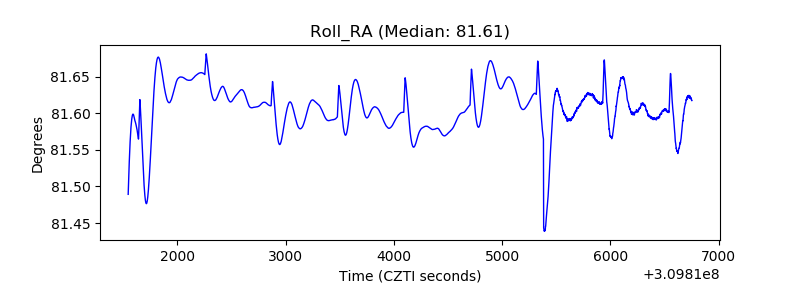 |
| Veto Counter | 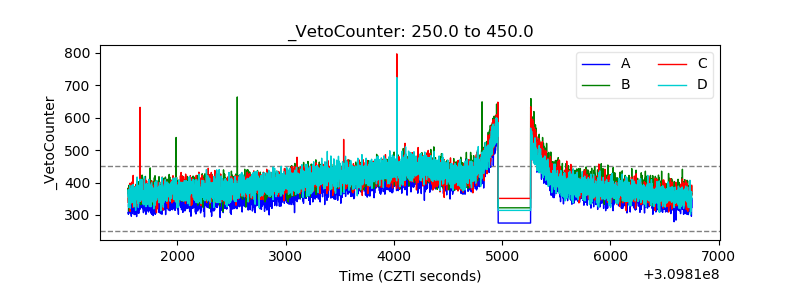 |