| Param | Original file | Final file |
|---|---|---|
| Filename | modeM0/AS1A07_167T01_9000003264_22050cztM0_level2.evt | modeM0/AS1A07_167T01_9000003264_22050cztM0_level2_quad_clean.evt |
| Size (bytes) | 626,443,200 | 115,583,040 |
| Size | 597.4 MB | 110.2 MB |
| Events in quadrant A | 3,954,422 | 746,482 |
| Events in quadrant B | 4,137,387 | 759,044 |
| Events in quadrant C | 3,937,877 | 722,721 |
| Events in quadrant D | 6,376,154 | 692,289 |
| Mode M0 | |||
|---|---|---|---|
| Quadrant | BADHDUFLAG | Total packets | Discarded packets |
| A | 0 | 17303 | 2 |
| B | 0 | 17760 | 2 |
| C | 0 | 17160 | 2 |
| D | 0 | 24771 | 2 |
| Mode M9 | |||
|---|---|---|---|
| Quadrant | BADHDUFLAG | Total packets | Discarded packets |
| A | 0 | 6 | 0 |
| B | 0 | 6 | 0 |
| C | 0 | 6 | 0 |
| D | 0 | 6 | 0 |
| Mode SS | |||
|---|---|---|---|
| Quadrant | BADHDUFLAG | Total packets | Discarded packets |
| A | 0 | 172 | 0 |
| B | 0 | 172 | 0 |
| C | 0 | 172 | 0 |
| D | 0 | 172 | 0 |
| Quadrant | Total seconds | Saturated seconds | Saturation percentage |
|---|---|---|---|
| A | 8344 | 85 | 1.018696% |
| B | 8345 | 118 | 1.414020% |
| C | 8345 | 111 | 1.330138% |
| D | 8344 | 467 | 5.596836% |
Noise dominated data is calculated using 1-second bins in cleaned event files. If a bin has >2000 counts, and if more than 50% of those come from <1% of pixels, then it is considered to be noise-dominated and hence unusable.
| Quadrant | # 1 sec bins | Bins with >0 counts | Bins with >2000 counts | High rate bins dominated by noise | Noise dominated (total time) | Noise dominated (detector-on time) | Marked lightcurve |
|---|---|---|---|---|---|---|---|
| A | 8929 | 8345 | 8 | 8 | 0.09% | 0.10% | 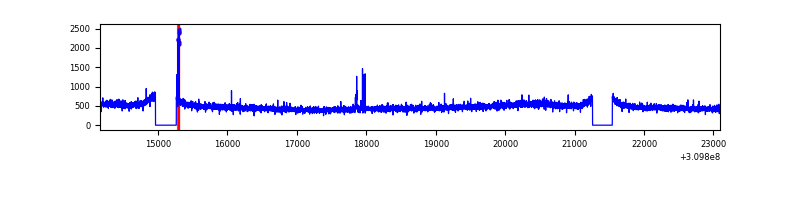 |
| B | 8930 | 8347 | 9 | 9 | 0.10% | 0.11% | 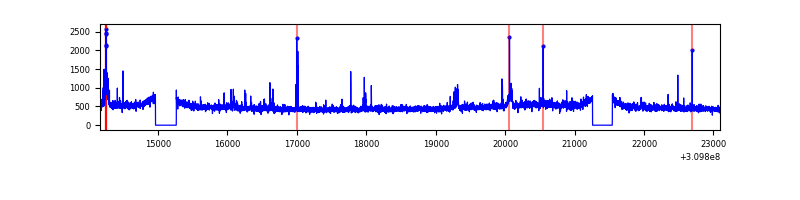 |
| C | 8930 | 8345 | 0 | 0 | 0.00% | 0.00% |  |
| D | 8929 | 8345 | 385 | 385 | 4.31% | 4.61% | 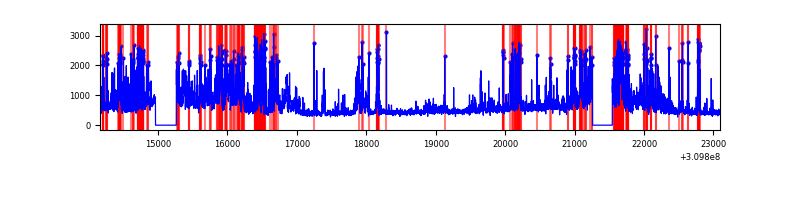 |
Top three noisy pixels from each quadrant. If the there are fewer than three noisy pixels in the level2.evt file, extra rows are filled as -1
| Pixel properties | Quadrant properties | ||||||
|---|---|---|---|---|---|---|---|
| Quadrant | DetID | PixID | Counts | Sigma | Mean | Median | Sigma |
| A | 15 | 236 | 29106 | 137.96 | 1012 | 988 | 203.8 |
| A | 5 | 16 | 17184 | 79.46 | 1012 | 988 | 203.8 |
| A | 13 | 254 | 14599 | 66.78 | 1012 | 988 | 203.8 |
| B | 3 | 64 | 52666 | 270.74 | 1011 | 984 | 190.9 |
| B | 0 | 197 | 49350 | 253.37 | 1011 | 984 | 190.9 |
| B | 0 | 230 | 30920 | 156.82 | 1011 | 984 | 190.9 |
| C | 14 | 238 | 153935 | 674.88 | 966 | 970 | 226.7 |
| C | 13 | 61 | 6750 | 25.5 | 966 | 970 | 226.7 |
| C | 5 | 4 | 6576 | 24.73 | 966 | 970 | 226.7 |
| D | 1 | 52 | 1382974 | 5901.22 | 964 | 934 | 234.2 |
| D | 12 | 233 | 296574 | 1262.36 | 964 | 934 | 234.2 |
| D | 5 | 222 | 296376 | 1261.52 | 964 | 934 | 234.2 |
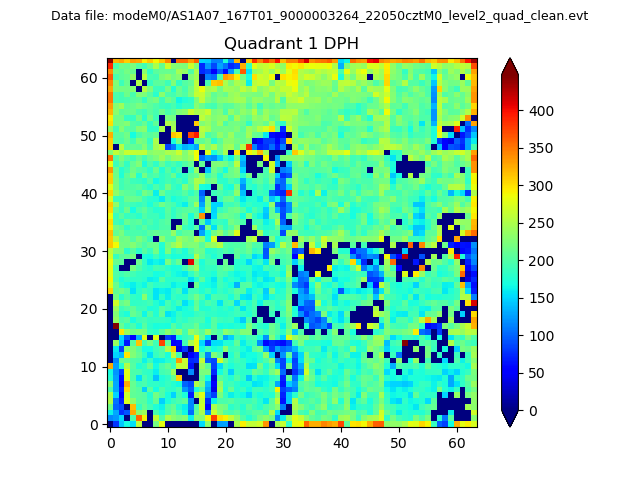
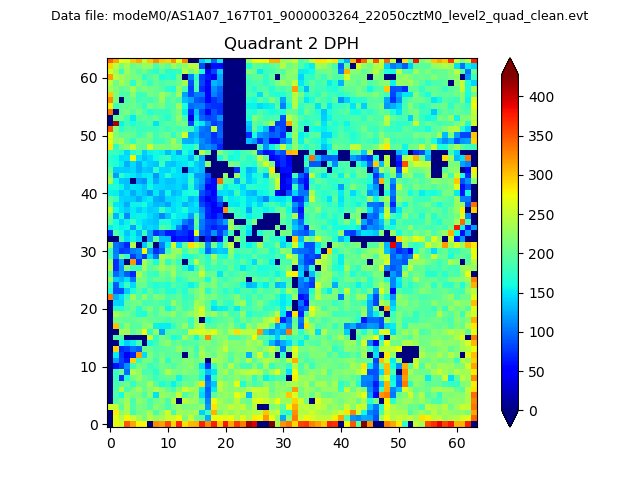
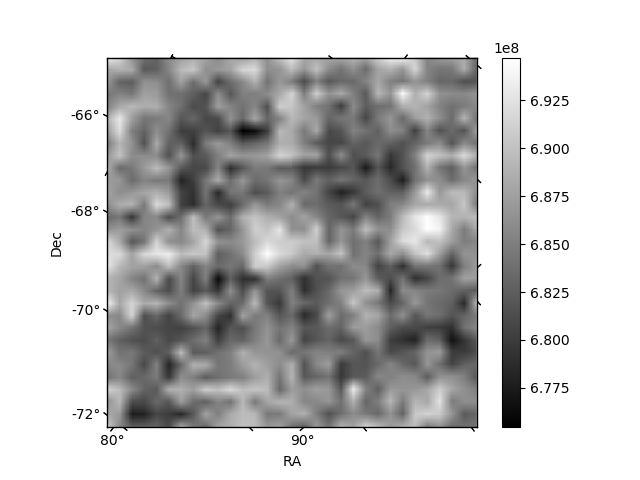
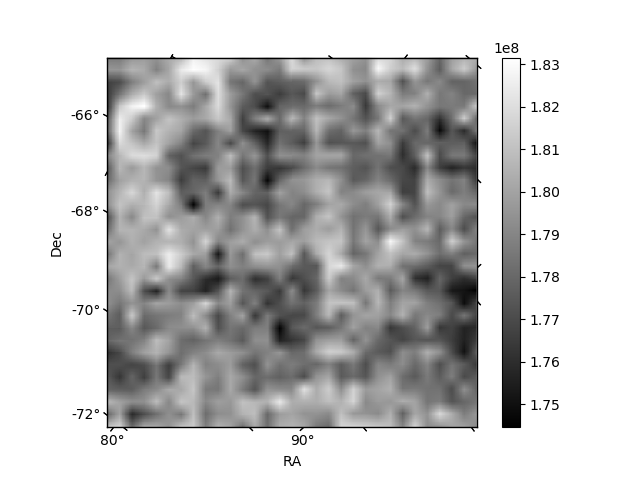
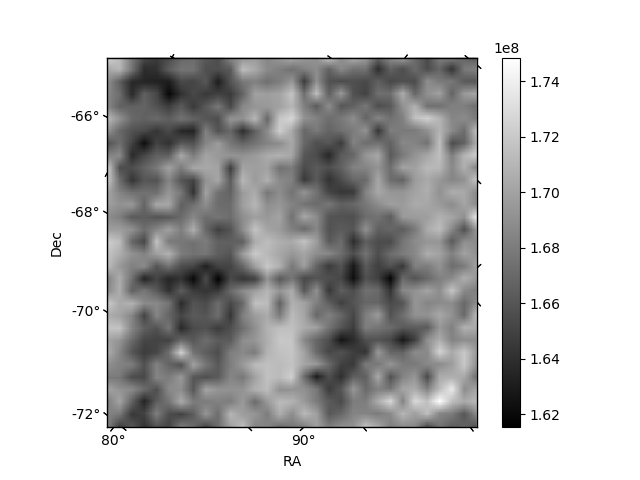
Histogram calculated using DETX and DETY for each event in the final _common_clean file
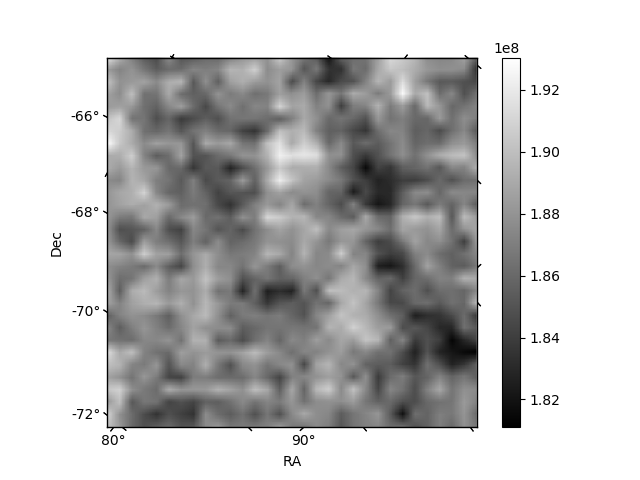
| Quadrant A | 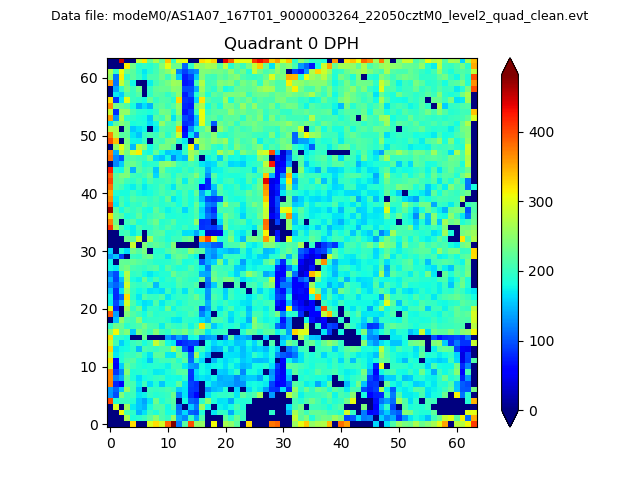 |
 |
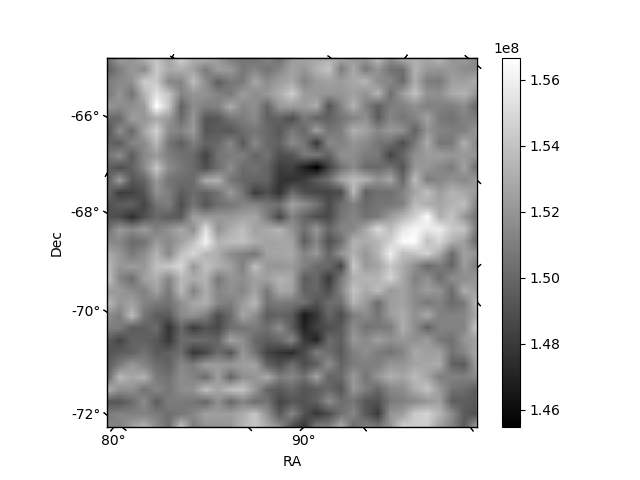
Quadrant B |
|---|---|---|---|
| Quadrant D | 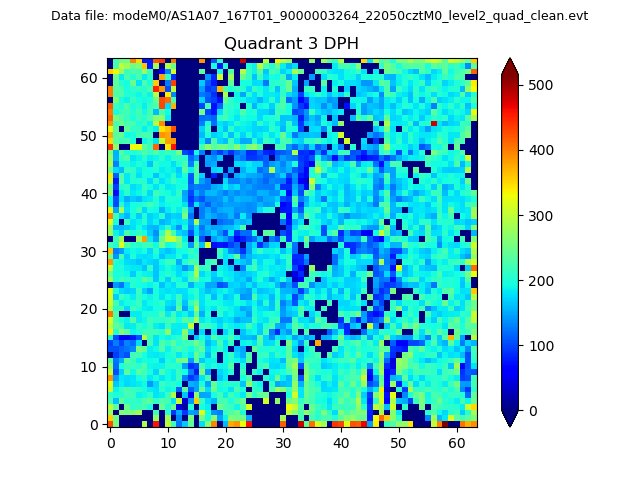 |
 |
Quadrant C |
| Plot type | Count rate plots | Images |
|---|---|---|
| Comparison with Poisson distribution Blue bars denote a histogram of data divided into 1 sec bins. Red curve is a Poisson curve with rate = median count rate of data. |
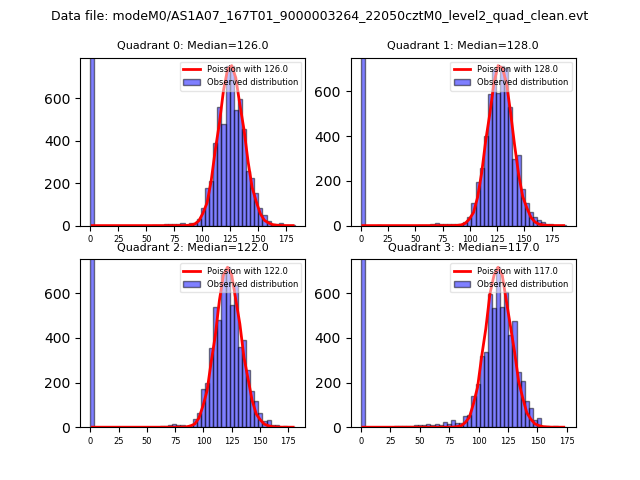 |
 |
| Quadrant-wise count rates Data is divided into 100 sec bins |
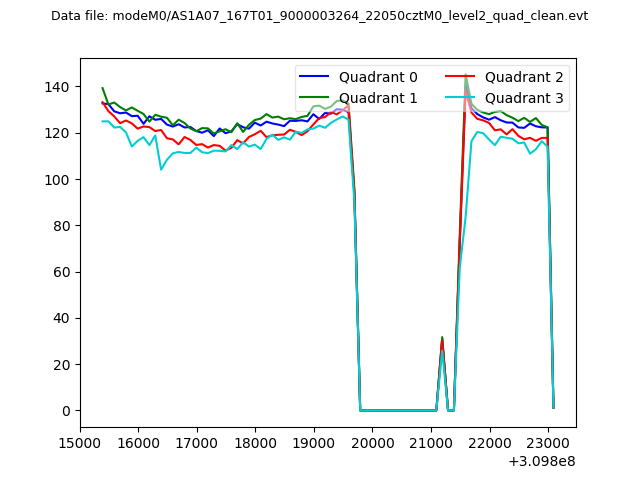 |
|
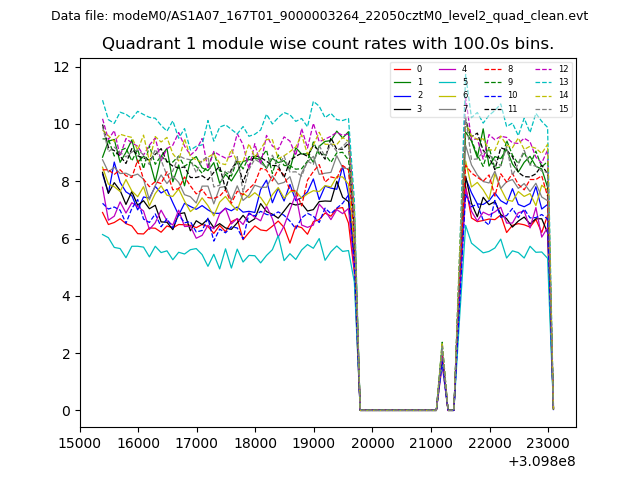
| Module-wise count rates for Quadrant A Data is divided into 100 sec bins |
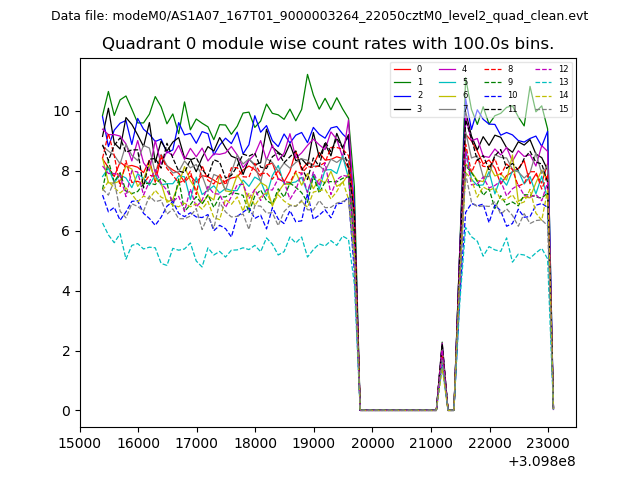 |
 |
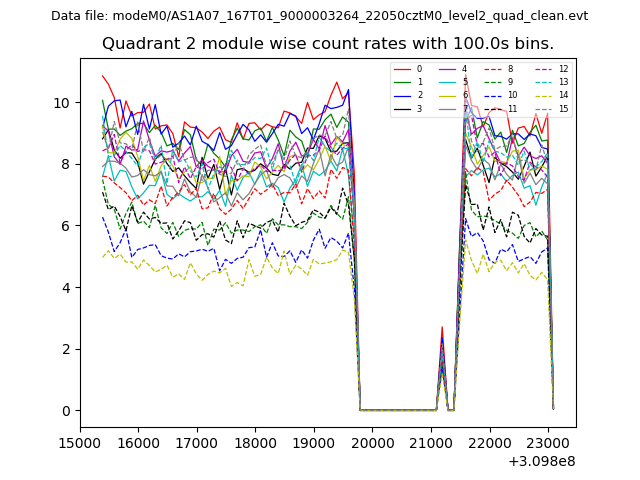
| Module-wise count rates for Quadrant B Data is divided into 100 sec bins |
 |
 |
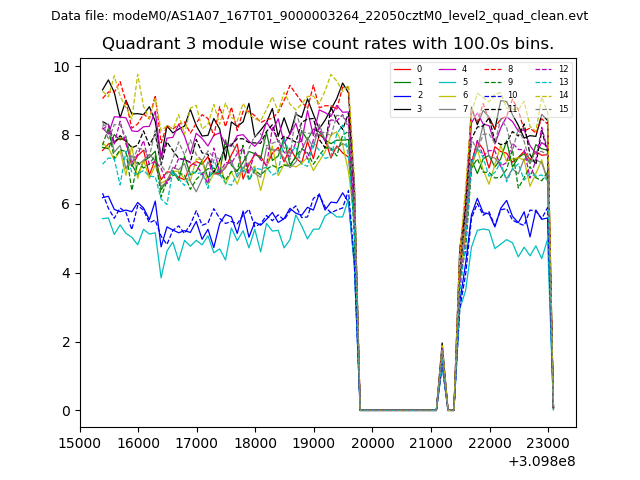
| Module-wise count rates for Quadrant C Data is divided into 100 sec bins |
 |
 |
| Module-wise count rates for Quadrant D Data is divided into 100 sec bins |
 |
 |
| Parameter | Plot |
|---|---|
| CZT HV Monitor | 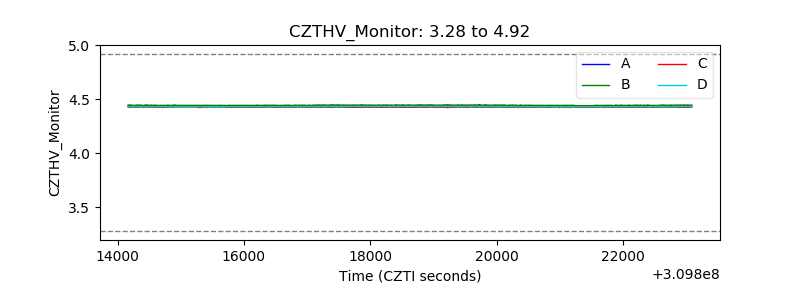 |
| D_VDD | 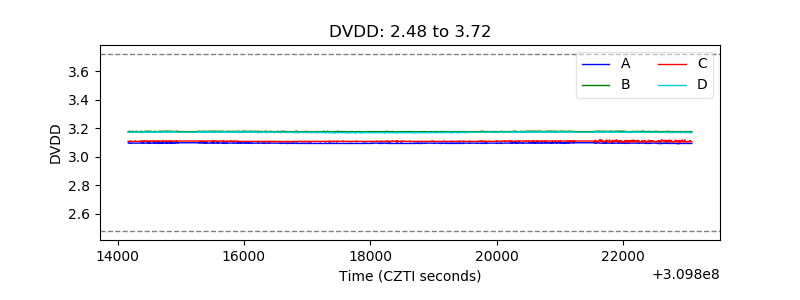 |
| Temperature 1 | 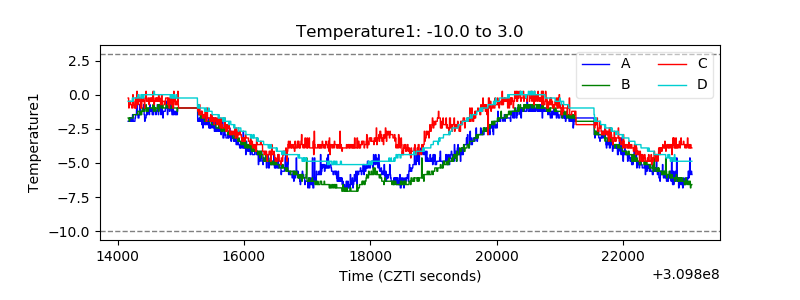 |
| Veto HV Monitor |  |
| Veto LLD | 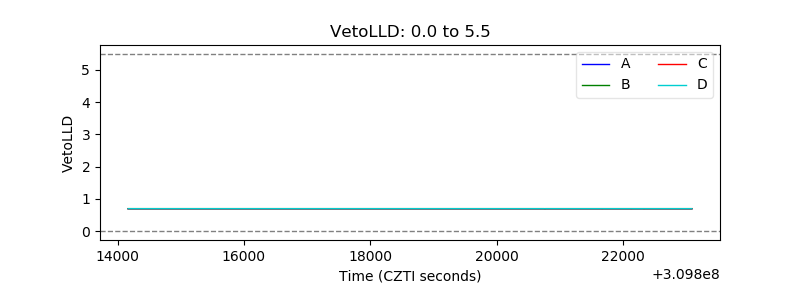 |
| Alpha Counter | 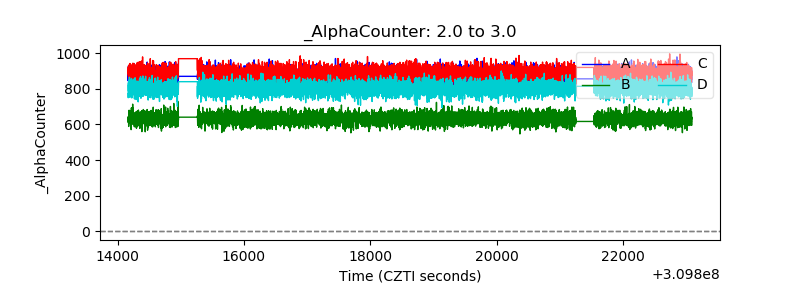 |
| _CPM_Rate | 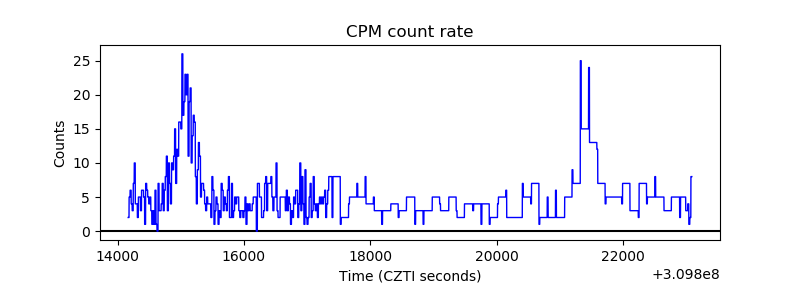 |
| CZT Counter | 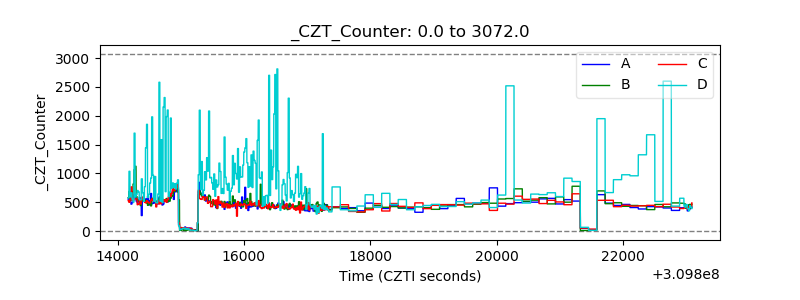 |
| +2.5 Volts monitor |  |
| +5 Volts monitor |  |
| _ROLL_ROT | 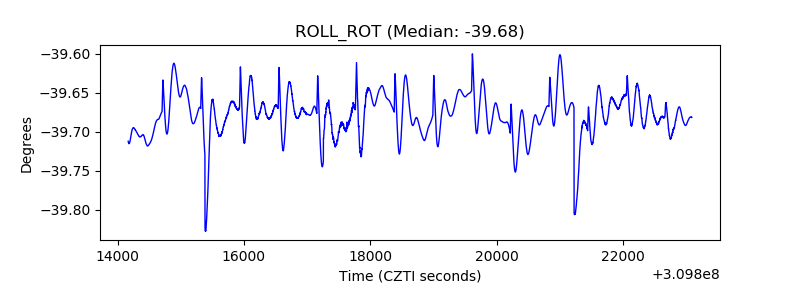 |
| _Roll_DEC |  |
| _Roll_RA | 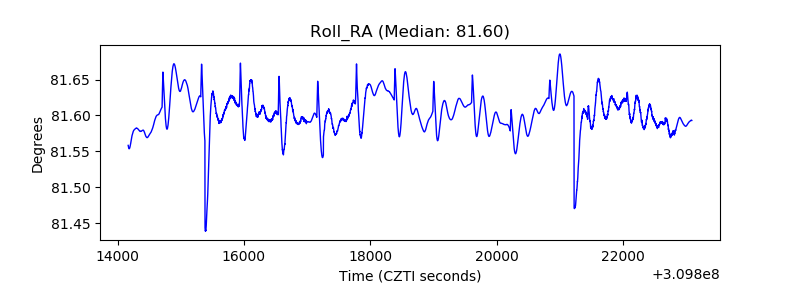 |
| Veto Counter | 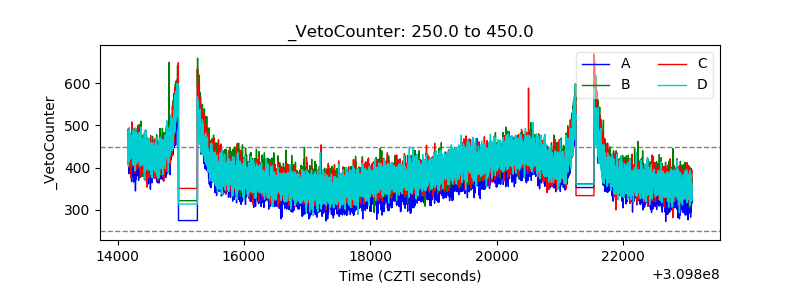 |