| Param | Original file | Final file |
|---|---|---|
| Filename | modeM0/AS1A07_167T01_9000003264_22054cztM0_level2.evt | modeM0/AS1A07_167T01_9000003264_22054cztM0_level2_quad_clean.evt |
| Size (bytes) | 1,148,529,600 | 226,702,080 |
| Size | 1.1 GB | 216.2 MB |
| Events in quadrant A | 7,395,888 | 1,469,110 |
| Events in quadrant B | 7,981,093 | 1,500,015 |
| Events in quadrant C | 7,532,002 | 1,443,150 |
| Events in quadrant D | 10,794,905 | 1,352,981 |
| Mode M0 | |||
|---|---|---|---|
| Quadrant | BADHDUFLAG | Total packets | Discarded packets |
| A | 0 | 32372 | 3 |
| B | 0 | 33931 | 3 |
| C | 0 | 32390 | 3 |
| D | 0 | 42872 | 3 |
| Mode M9 | |||
|---|---|---|---|
| Quadrant | BADHDUFLAG | Total packets | Discarded packets |
| A | 0 | 25 | 0 |
| B | 0 | 25 | 0 |
| C | 0 | 25 | 0 |
| D | 0 | 25 | 0 |
| Mode SS | |||
|---|---|---|---|
| Quadrant | BADHDUFLAG | Total packets | Discarded packets |
| A | 0 | 322 | 0 |
| B | 0 | 322 | 0 |
| C | 0 | 322 | 0 |
| D | 0 | 322 | 0 |
| Quadrant | Total seconds | Saturated seconds | Saturation percentage |
|---|---|---|---|
| A | 15973 | 37 | 0.231641% |
| B | 15973 | 147 | 0.920303% |
| C | 15973 | 137 | 0.857697% |
| D | 15973 | 961 | 6.016403% |
Noise dominated data is calculated using 1-second bins in cleaned event files. If a bin has >2000 counts, and if more than 50% of those come from <1% of pixels, then it is considered to be noise-dominated and hence unusable.
| Quadrant | # 1 sec bins | Bins with >0 counts | Bins with >2000 counts | High rate bins dominated by noise | Noise dominated (total time) | Noise dominated (detector-on time) | Marked lightcurve |
|---|---|---|---|---|---|---|---|
| A | 18318 | 15976 | 1 | 1 | 0.01% | 0.01% | 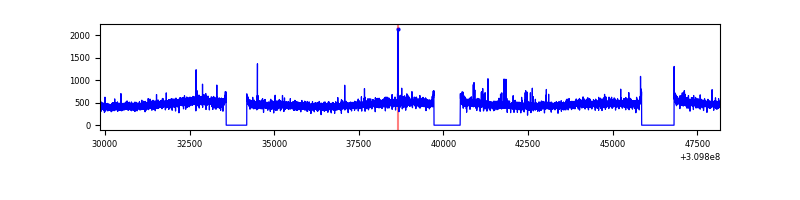 |
| B | 18318 | 15973 | 63 | 63 | 0.34% | 0.39% | 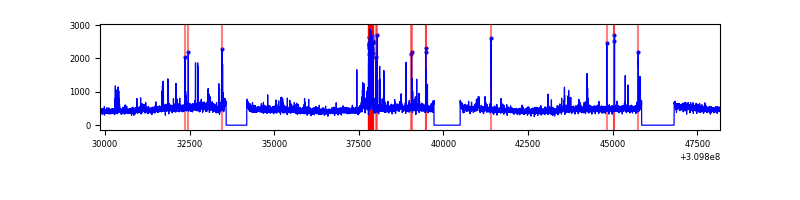 |
| C | 18318 | 15973 | 0 | 0 | 0.00% | 0.00% | 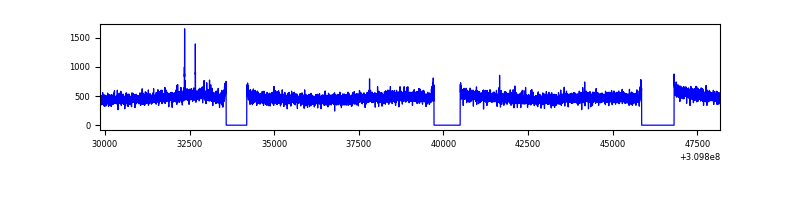 |
| D | 18317 | 15972 | 832 | 832 | 4.54% | 5.21% | 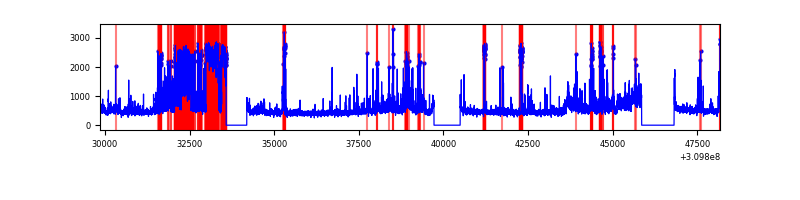 |
Top three noisy pixels from each quadrant. If the there are fewer than three noisy pixels in the level2.evt file, extra rows are filled as -1
| Pixel properties | Quadrant properties | ||||||
|---|---|---|---|---|---|---|---|
| Quadrant | DetID | PixID | Counts | Sigma | Mean | Median | Sigma |
| A | 5 | 16 | 43452 | 109.27 | 1907 | 1866 | 380.6 |
| A | 13 | 254 | 24422 | 59.27 | 1907 | 1866 | 380.6 |
| A | 3 | 137 | 16229 | 37.74 | 1907 | 1866 | 380.6 |
| B | 3 | 64 | 216631 | 601.0 | 1901 | 1851 | 357.4 |
| B | 0 | 197 | 96620 | 265.18 | 1901 | 1851 | 357.4 |
| B | 0 | 230 | 82539 | 225.78 | 1901 | 1851 | 357.4 |
| C | 14 | 238 | 293768 | 675.89 | 1851 | 1866 | 431.9 |
| C | 10 | 22 | 15550 | 31.69 | 1851 | 1866 | 431.9 |
| C | 13 | 61 | 12886 | 25.52 | 1851 | 1866 | 431.9 |
| D | 1 | 52 | 1410842 | 3232.43 | 1815 | 1761 | 435.9 |
| D | 7 | 38 | 1183314 | 2710.48 | 1815 | 1761 | 435.9 |
| D | 7 | 238 | 890791 | 2039.43 | 1815 | 1761 | 435.9 |
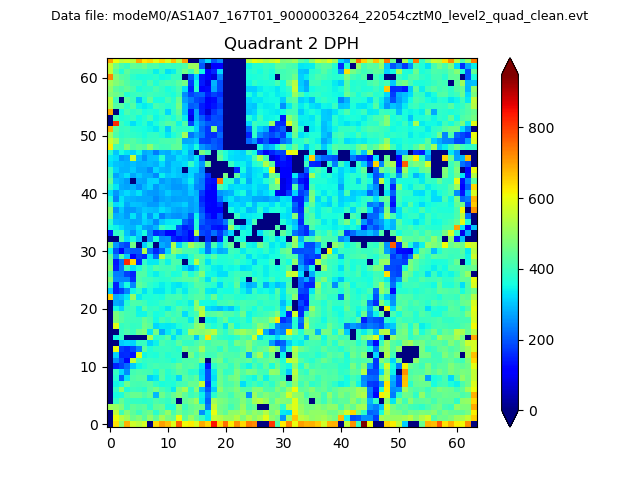
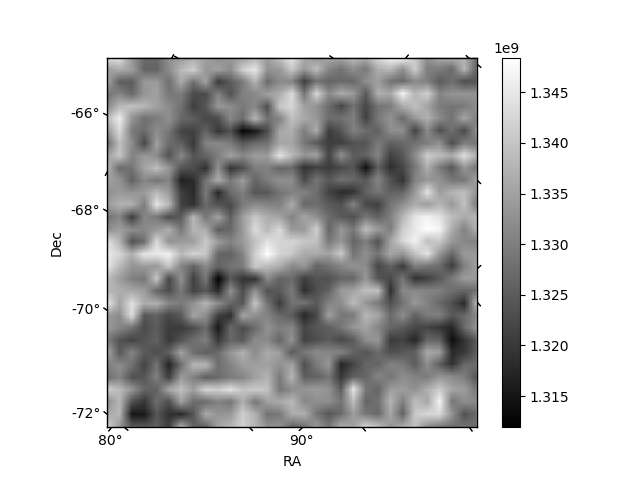
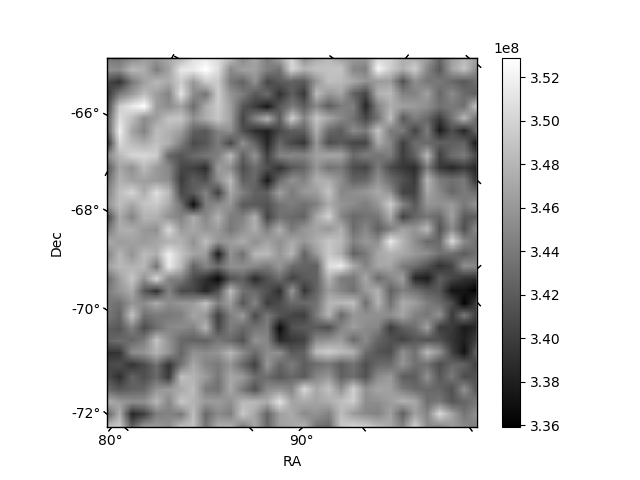
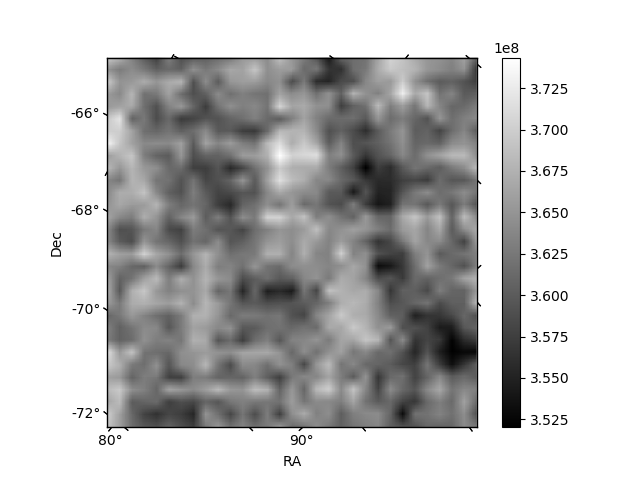
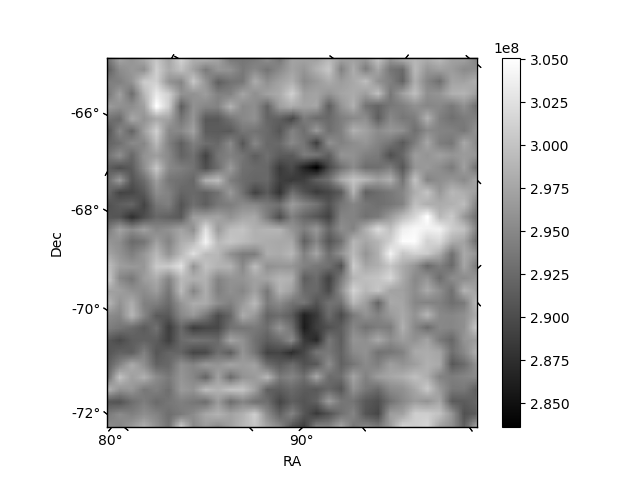
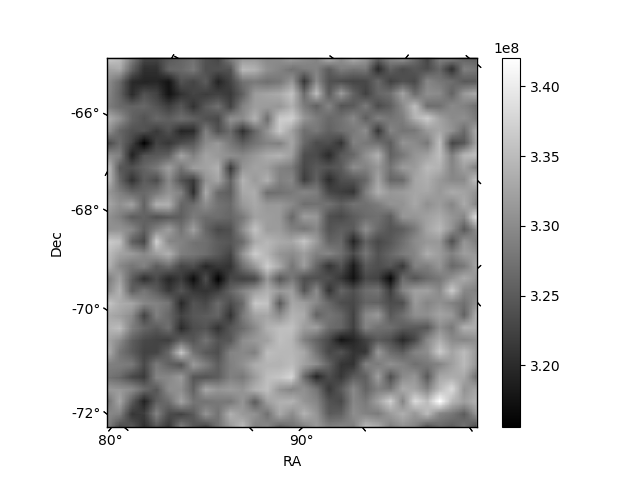
Histogram calculated using DETX and DETY for each event in the final _common_clean file
| Quadrant A | 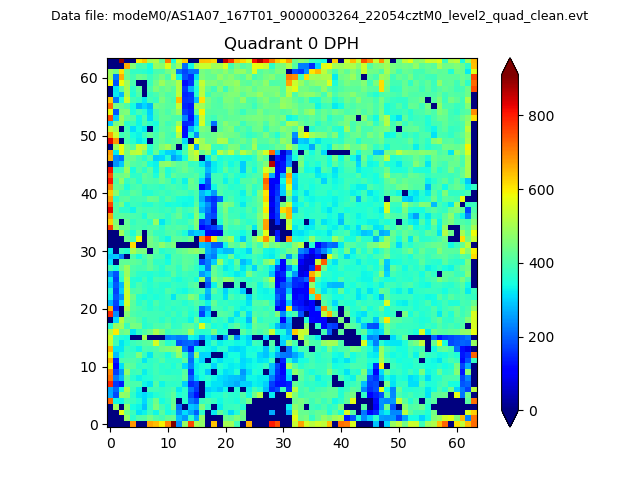 |
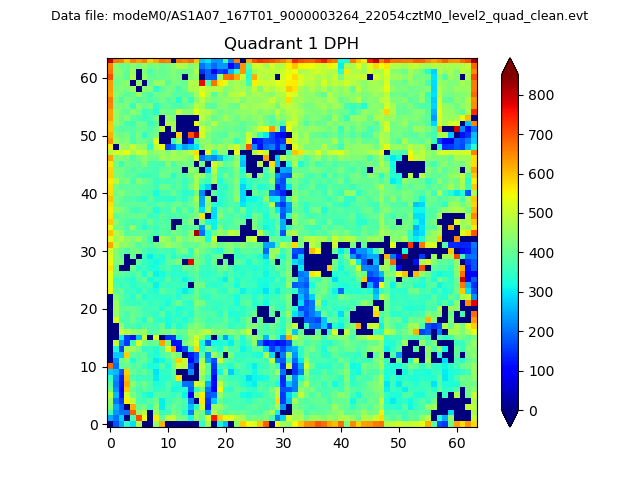 |
Quadrant B |
|---|---|---|---|
| Quadrant D | 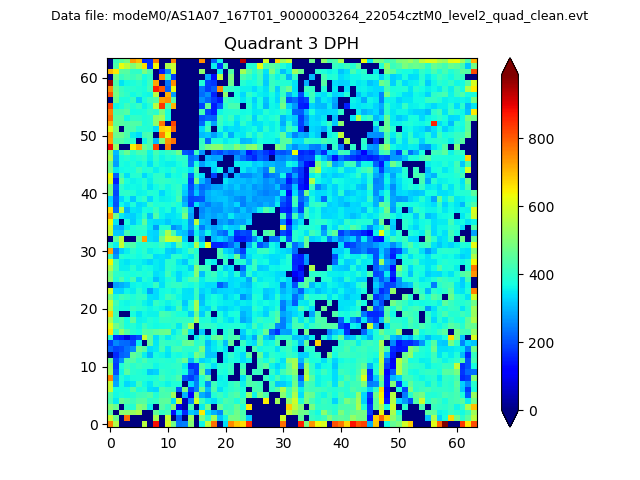 |
 |
Quadrant C |
| Plot type | Count rate plots | Images |
|---|---|---|
| Comparison with Poisson distribution Blue bars denote a histogram of data divided into 1 sec bins. Red curve is a Poisson curve with rate = median count rate of data. |
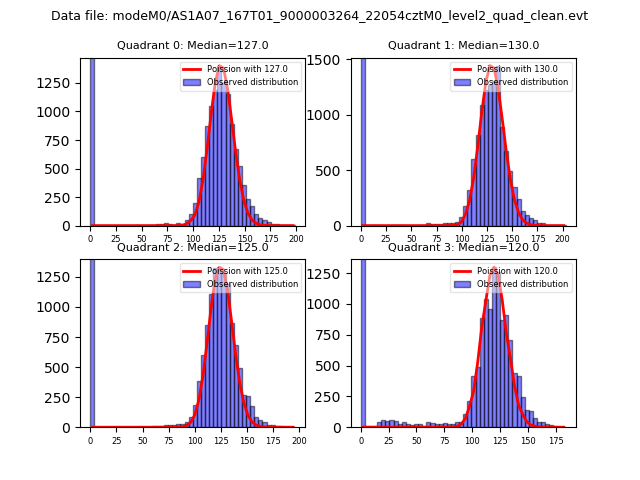 |
 |
| Quadrant-wise count rates Data is divided into 100 sec bins |
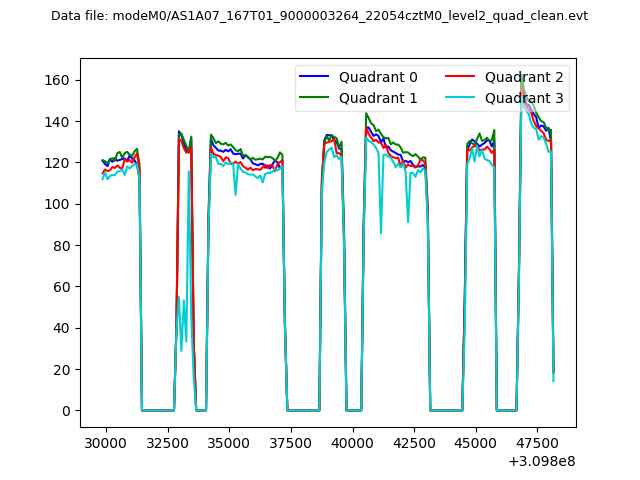 |
|
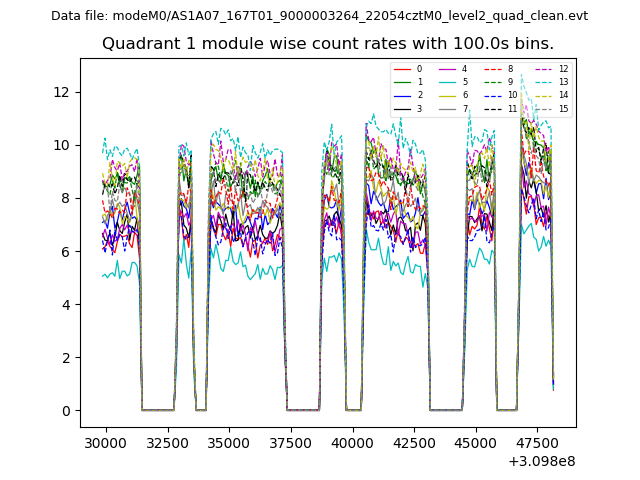
| Module-wise count rates for Quadrant A Data is divided into 100 sec bins |
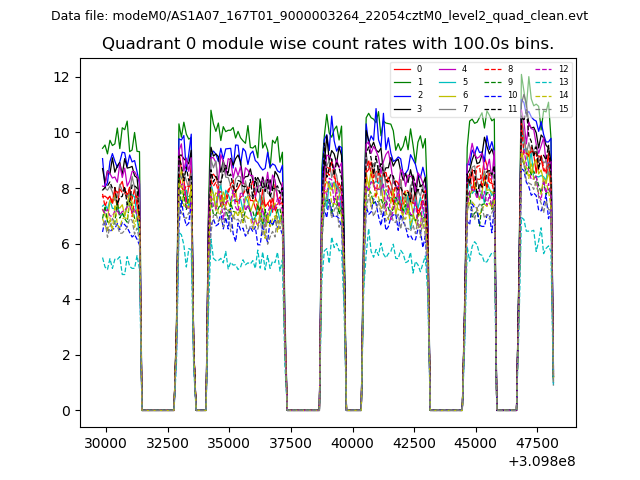 |
 |
| Module-wise count rates for Quadrant B Data is divided into 100 sec bins |
 |
 |
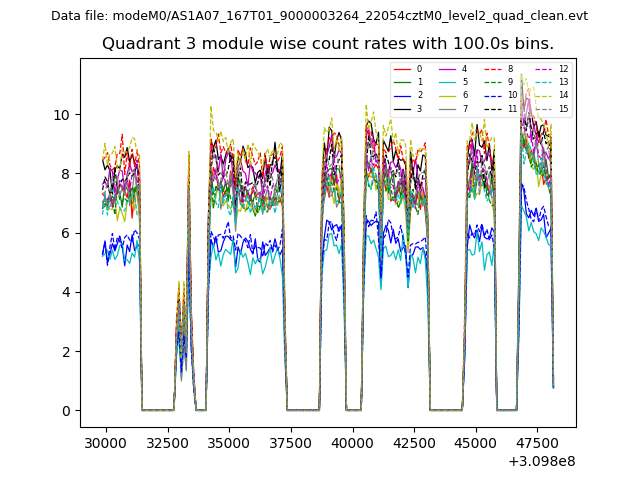
| Module-wise count rates for Quadrant C Data is divided into 100 sec bins |
 |
 |
| Module-wise count rates for Quadrant D Data is divided into 100 sec bins |
 |
 |
| Parameter | Plot |
|---|---|
| CZT HV Monitor | 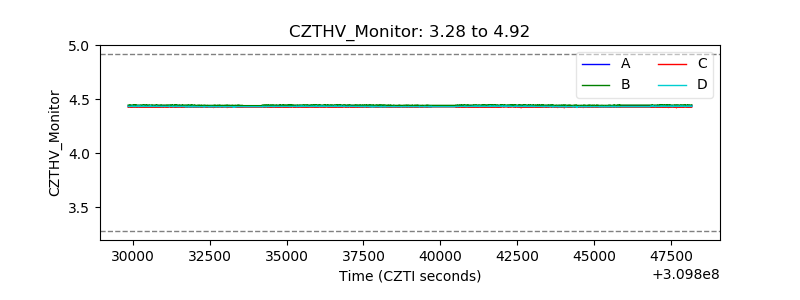 |
| D_VDD | 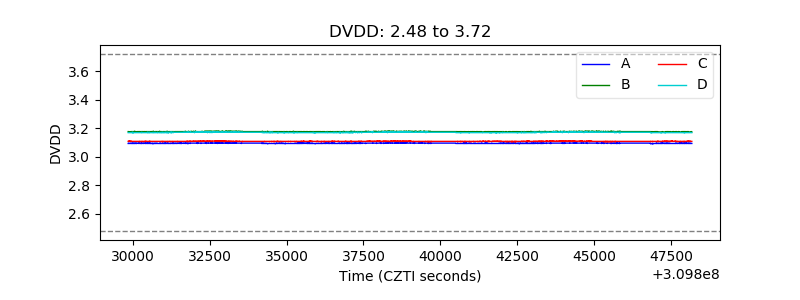 |
| Temperature 1 | 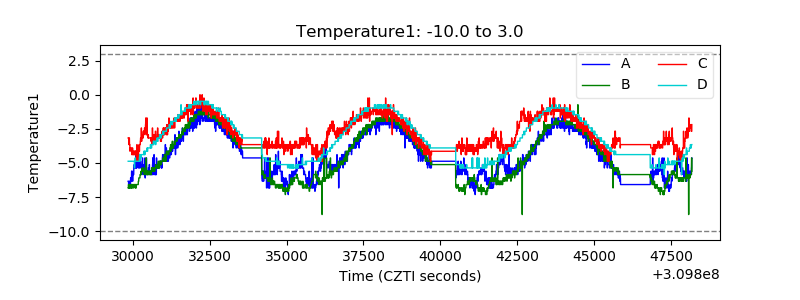 |
| Veto HV Monitor | 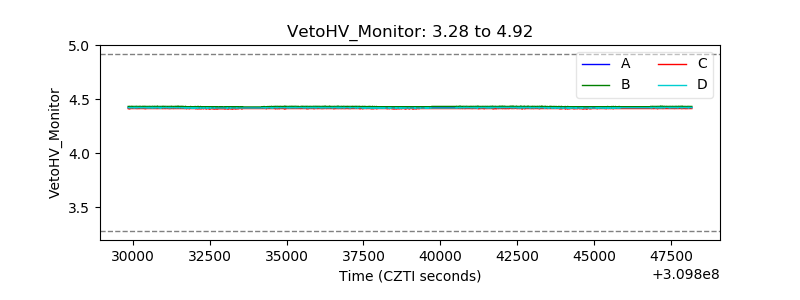 |
| Veto LLD | 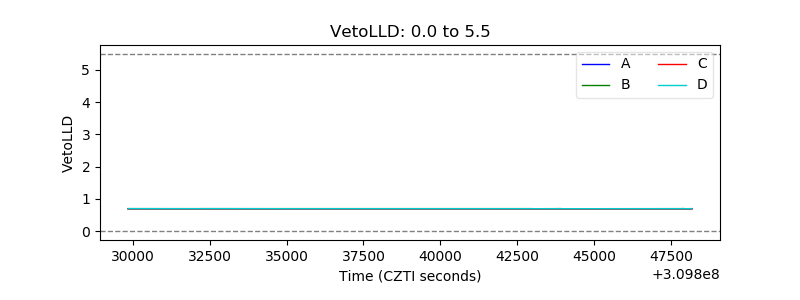 |
| Alpha Counter | 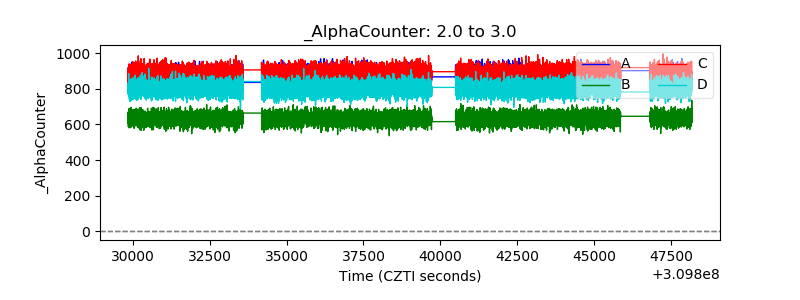 |
| _CPM_Rate | 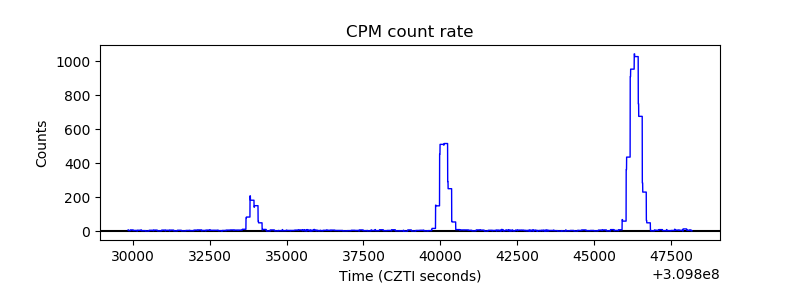 |
| CZT Counter | 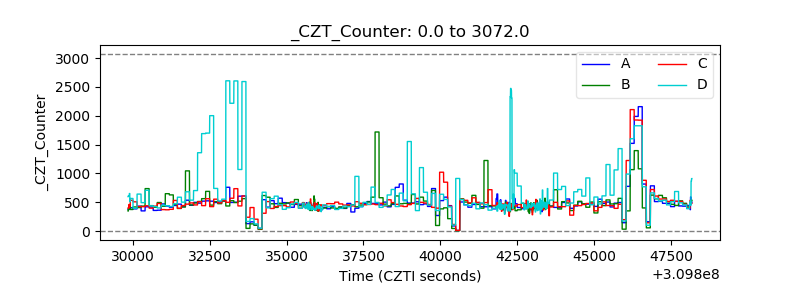 |
| +2.5 Volts monitor | 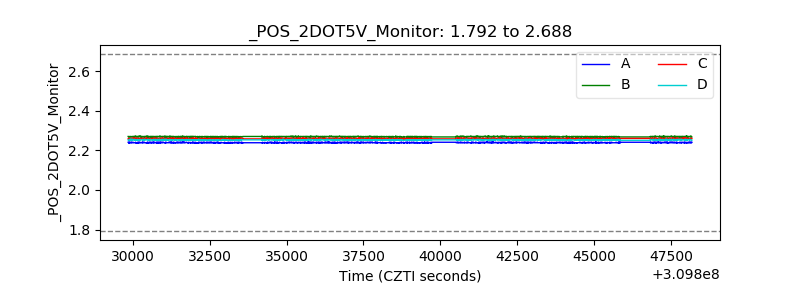 |
| +5 Volts monitor |  |
| _ROLL_ROT | 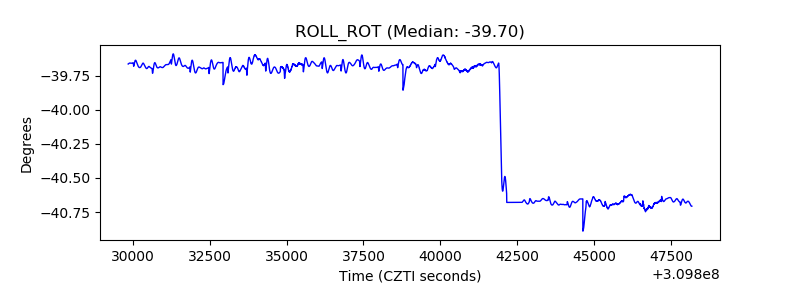 |
| _Roll_DEC | 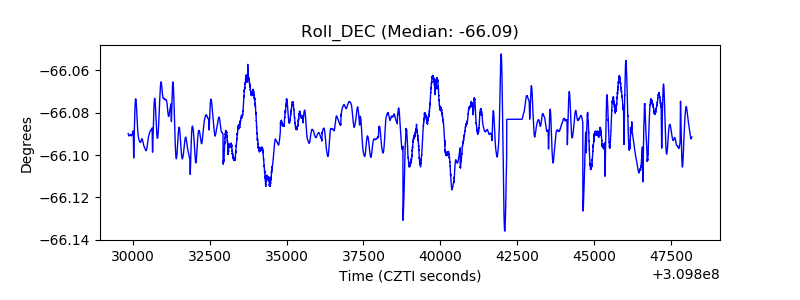 |
| _Roll_RA | 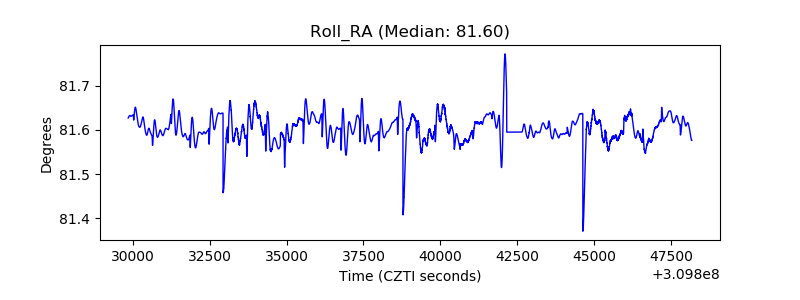 |
| Veto Counter | 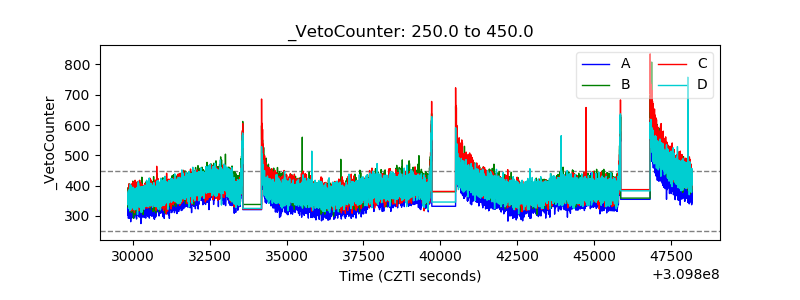 |