| Param | Original file | Final file |
|---|---|---|
| Filename | modeM0/AS1A07_167T01_9000003264_22059cztM0_level2.evt | modeM0/AS1A07_167T01_9000003264_22059cztM0_level2_quad_clean.evt |
| Size (bytes) | 469,920,960 | 86,863,680 |
| Size | 448.2 MB | 82.8 MB |
| Events in quadrant A | 3,338,457 | 565,649 |
| Events in quadrant B | 3,257,916 | 570,387 |
| Events in quadrant C | 3,229,998 | 541,893 |
| Events in quadrant D | 3,992,433 | 527,905 |
| Mode M0 | |||
|---|---|---|---|
| Quadrant | BADHDUFLAG | Total packets | Discarded packets |
| A | 0 | 13689 | 1 |
| B | 0 | 13373 | 1 |
| C | 0 | 13373 | 1 |
| D | 0 | 15911 | 1 |
| Mode M9 | |||
|---|---|---|---|
| Quadrant | BADHDUFLAG | Total packets | Discarded packets |
| A | 0 | 13 | 0 |
| B | 0 | 13 | 0 |
| C | 0 | 13 | 0 |
| D | 0 | 13 | 0 |
| Mode SS | |||
|---|---|---|---|
| Quadrant | BADHDUFLAG | Total packets | Discarded packets |
| A | 0 | 124 | 0 |
| B | 0 | 124 | 0 |
| C | 0 | 124 | 0 |
| D | 0 | 124 | 0 |
| Quadrant | Total seconds | Saturated seconds | Saturation percentage |
|---|---|---|---|
| A | 6079 | 106 | 1.743708% |
| B | 6080 | 96 | 1.578947% |
| C | 6080 | 117 | 1.924342% |
| D | 6080 | 260 | 4.276316% |
Noise dominated data is calculated using 1-second bins in cleaned event files. If a bin has >2000 counts, and if more than 50% of those come from <1% of pixels, then it is considered to be noise-dominated and hence unusable.
| Quadrant | # 1 sec bins | Bins with >0 counts | Bins with >2000 counts | High rate bins dominated by noise | Noise dominated (total time) | Noise dominated (detector-on time) | Marked lightcurve |
|---|---|---|---|---|---|---|---|
| A | 7389 | 6079 | 8 | 8 | 0.11% | 0.13% | 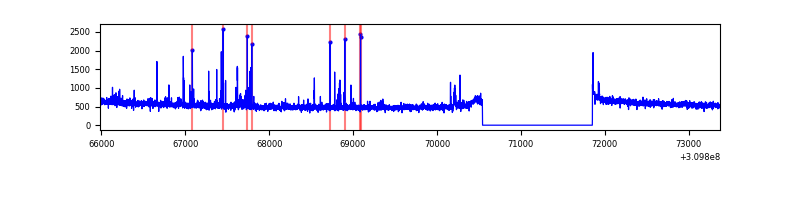 |
| B | 7389 | 6079 | 1 | 1 | 0.01% | 0.02% | 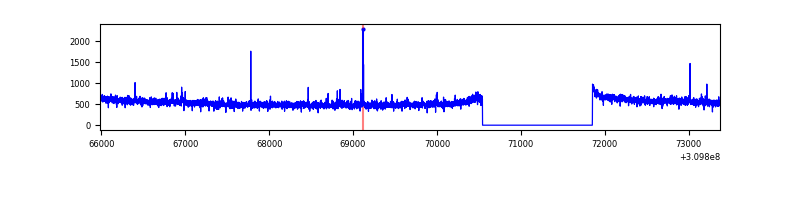 |
| C | 7390 | 6080 | 0 | 0 | 0.00% | 0.00% | 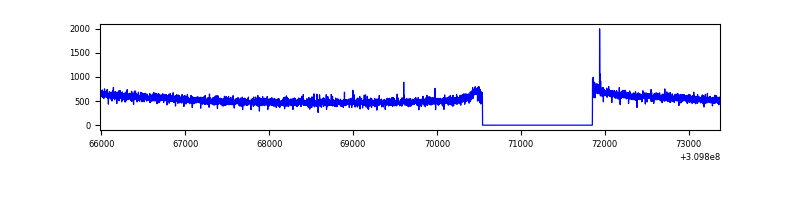 |
| D | 7390 | 6080 | 123 | 123 | 1.66% | 2.02% | 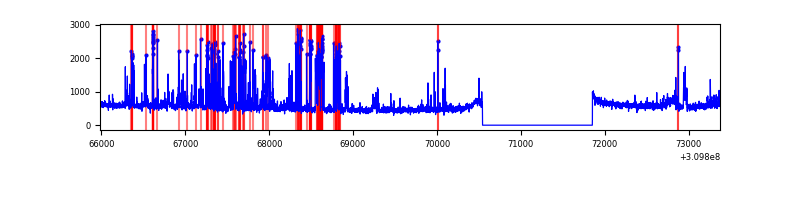 |
Top three noisy pixels from each quadrant. If the there are fewer than three noisy pixels in the level2.evt file, extra rows are filled as -1
| Pixel properties | Quadrant properties | ||||||
|---|---|---|---|---|---|---|---|
| Quadrant | DetID | PixID | Counts | Sigma | Mean | Median | Sigma |
| A | 5 | 16 | 122637 | 748.22 | 834 | 820 | 162.8 |
| A | 13 | 254 | 8954 | 49.96 | 834 | 820 | 162.8 |
| A | 0 | 226 | 7428 | 40.58 | 834 | 820 | 162.8 |
| B | 12 | 111 | 17066 | 108.48 | 822 | 804 | 149.9 |
| B | 11 | 111 | 15264 | 96.46 | 822 | 804 | 149.9 |
| B | 0 | 197 | 13903 | 87.38 | 822 | 804 | 149.9 |
| C | 14 | 238 | 129296 | 713.95 | 793 | 800 | 180.0 |
| C | 10 | 22 | 8151 | 40.84 | 793 | 800 | 180.0 |
| C | 13 | 61 | 5639 | 26.89 | 793 | 800 | 180.0 |
| D | 1 | 52 | 708865 | 3719.58 | 805 | 784 | 190.4 |
| D | 2 | 136 | 97987 | 510.61 | 805 | 784 | 190.4 |
| D | 13 | 172 | 42332 | 218.25 | 805 | 784 | 190.4 |
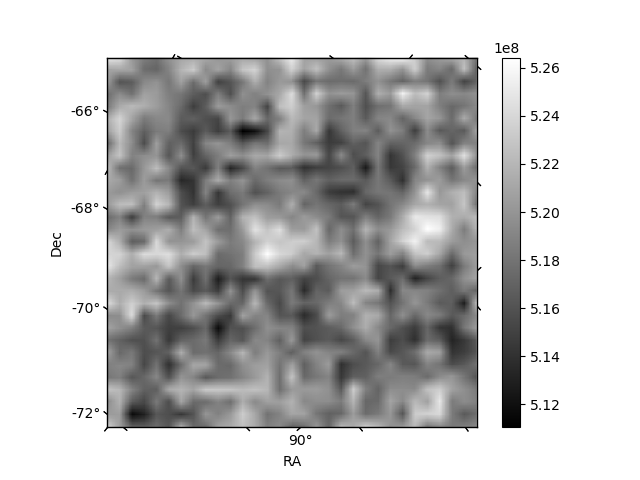
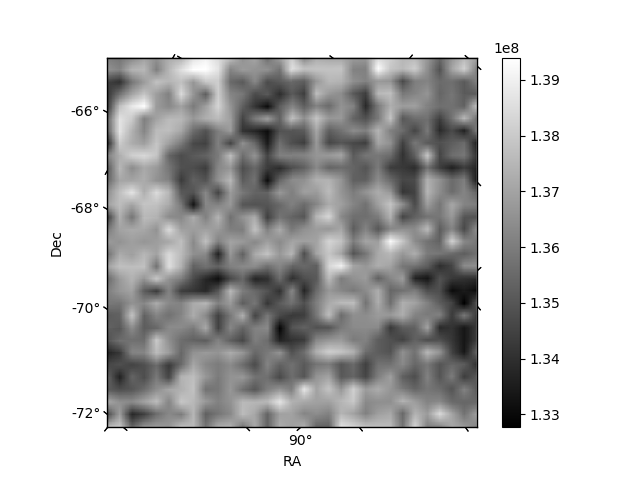
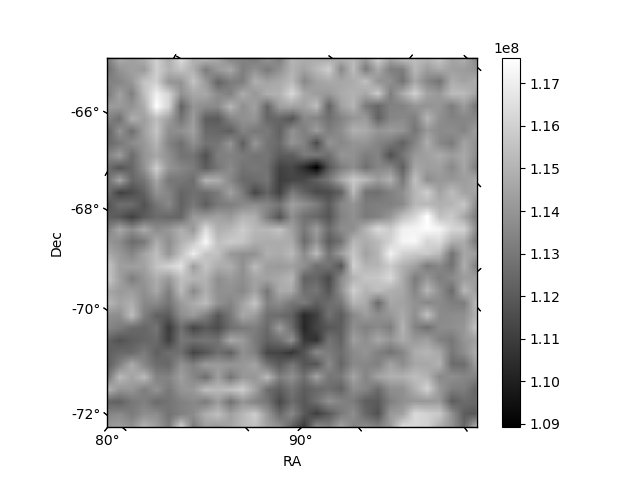
Histogram calculated using DETX and DETY for each event in the final _common_clean file
| Quadrant A | 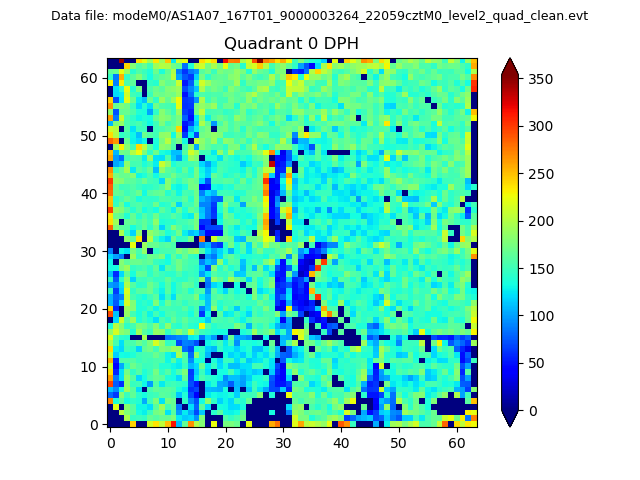 |
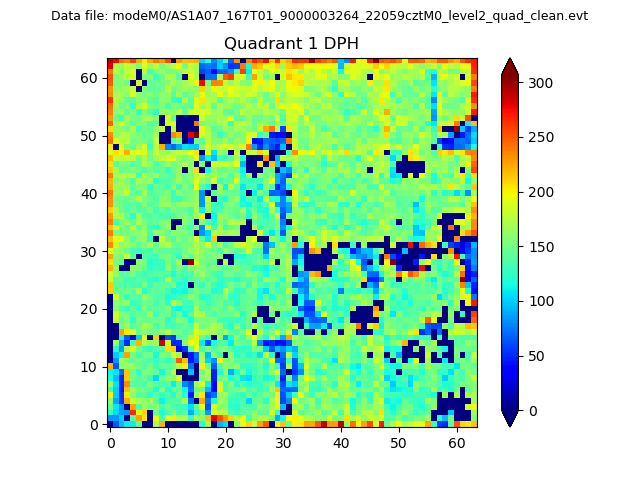 |
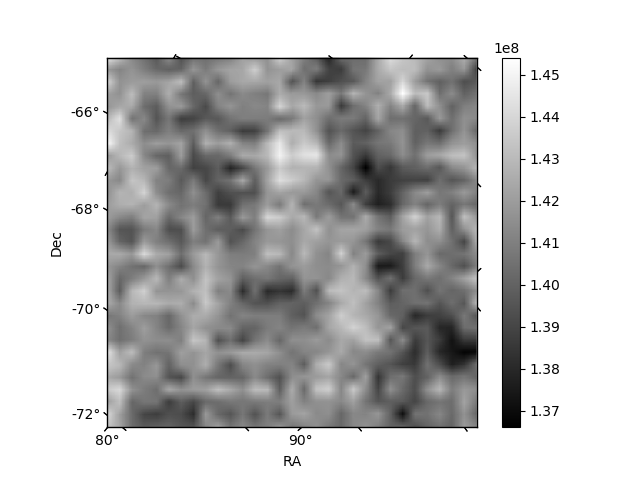
Quadrant B |
|---|---|---|---|
| Quadrant D | 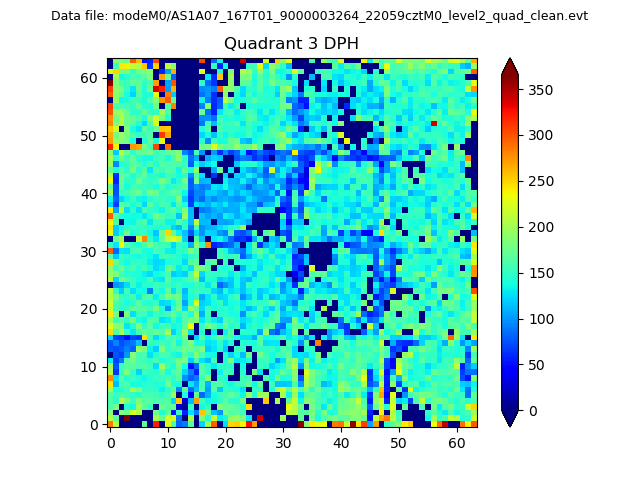 |
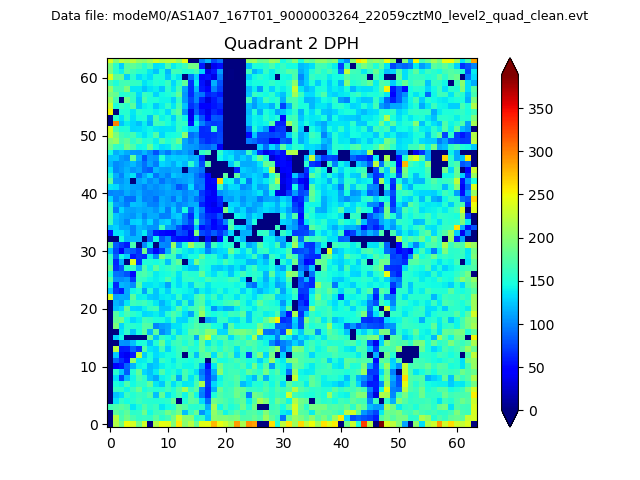 |
Quadrant C |
| Plot type | Count rate plots | Images |
|---|---|---|
| Comparison with Poisson distribution Blue bars denote a histogram of data divided into 1 sec bins. Red curve is a Poisson curve with rate = median count rate of data. |
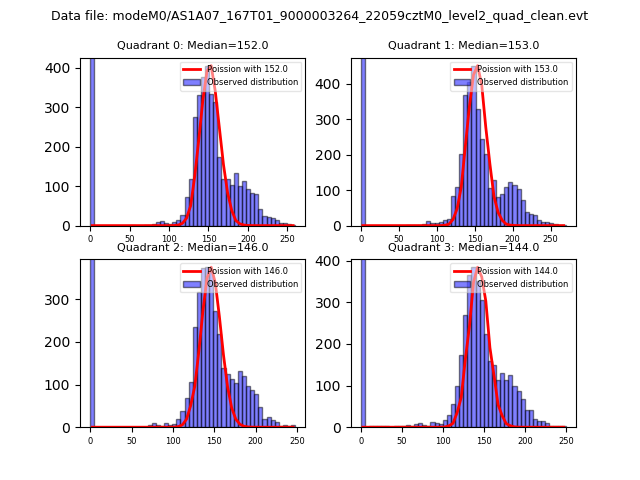 |
 |
| Quadrant-wise count rates Data is divided into 100 sec bins |
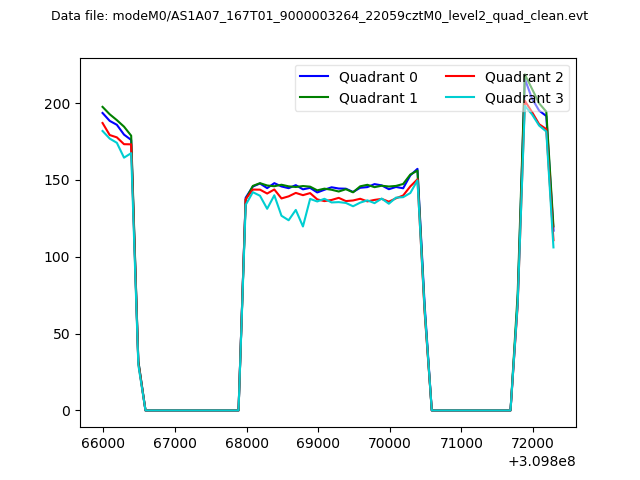 |
|
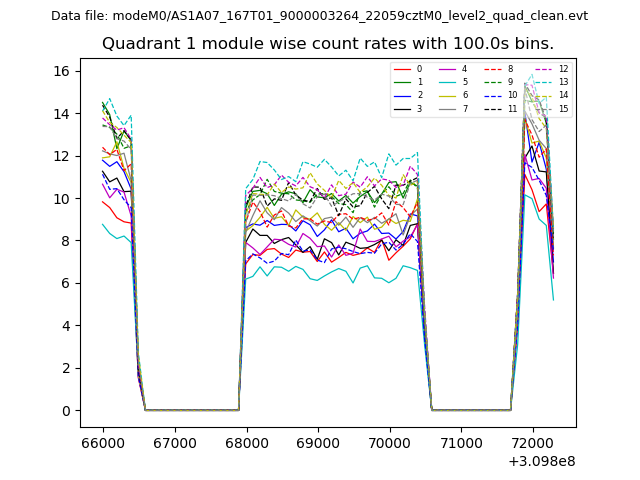
| Module-wise count rates for Quadrant A Data is divided into 100 sec bins |
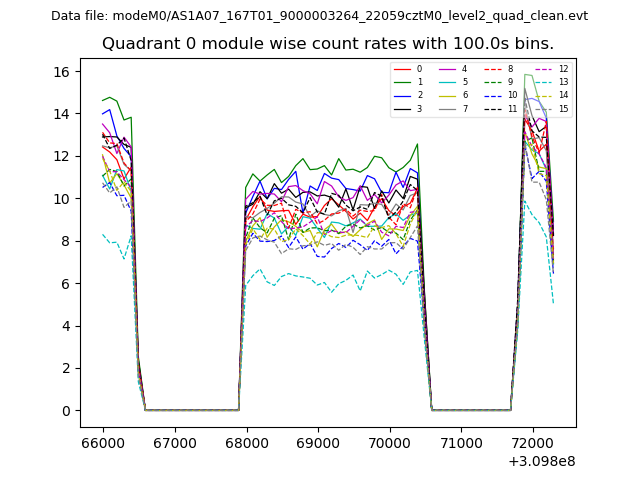 |
 |
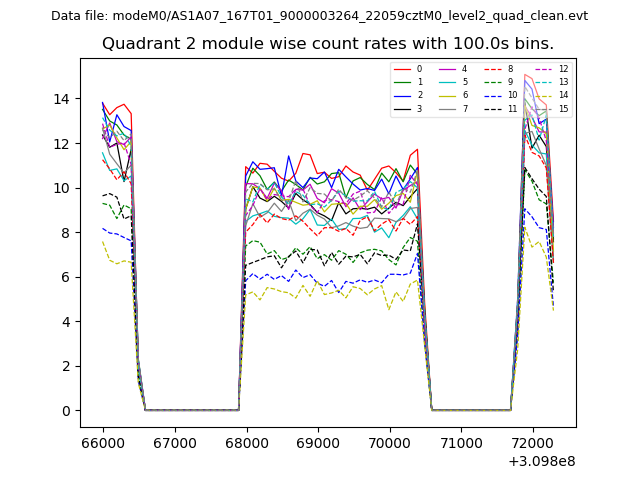
| Module-wise count rates for Quadrant B Data is divided into 100 sec bins |
 |
 |
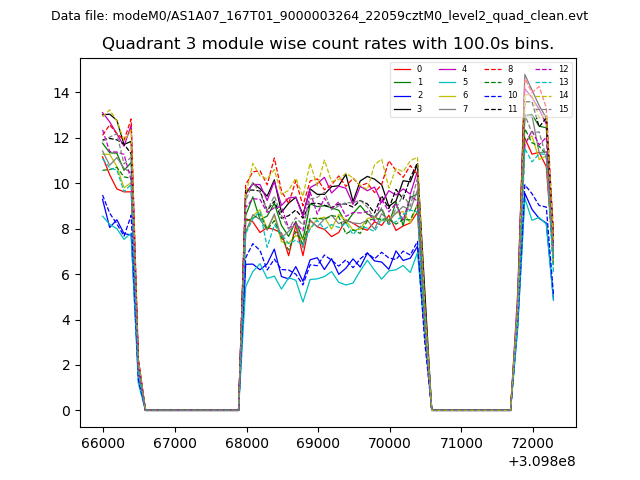
| Module-wise count rates for Quadrant C Data is divided into 100 sec bins |
 |
 |
| Module-wise count rates for Quadrant D Data is divided into 100 sec bins |
 |
 |
| Parameter | Plot |
|---|---|
| CZT HV Monitor | 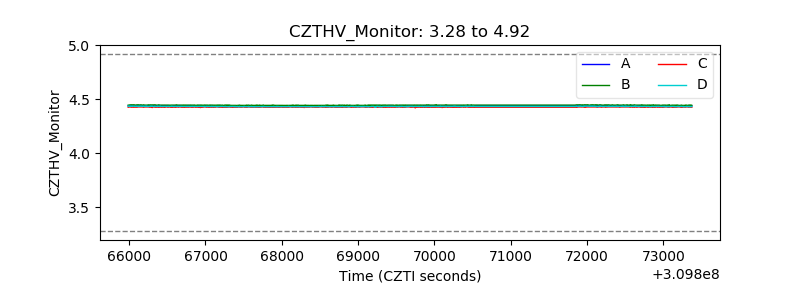 |
| D_VDD | 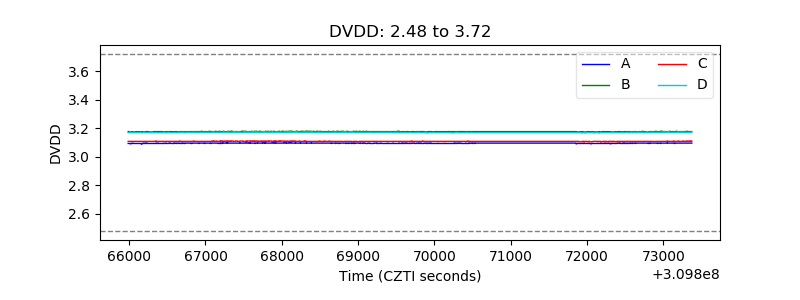 |
| Temperature 1 |  |
| Veto HV Monitor | 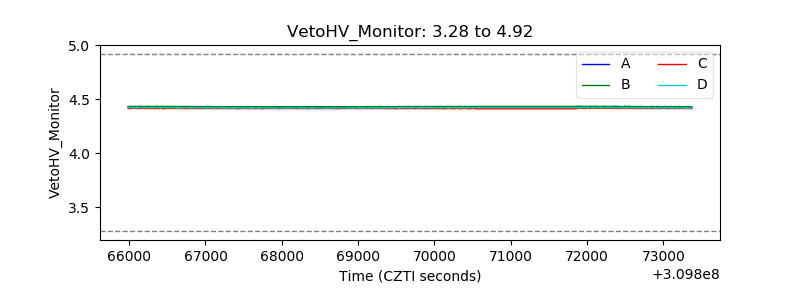 |
| Veto LLD | 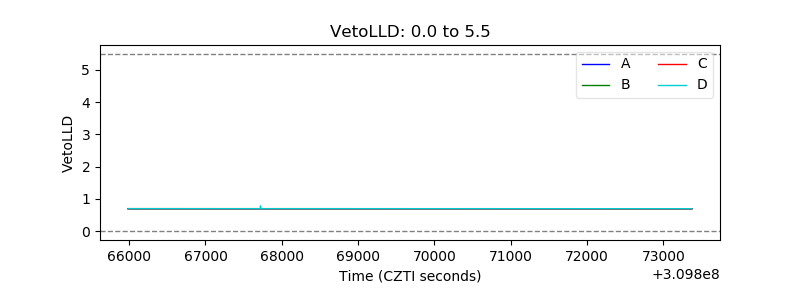 |
| Alpha Counter | 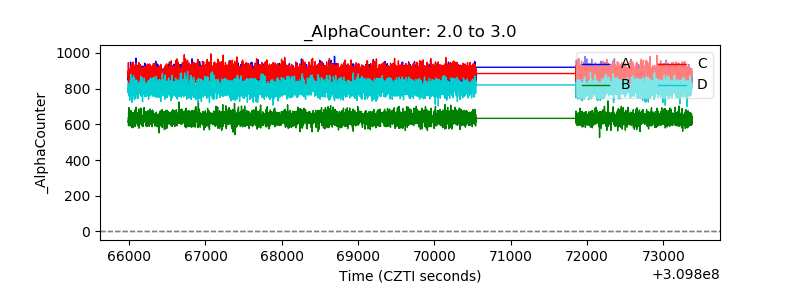 |
| _CPM_Rate | 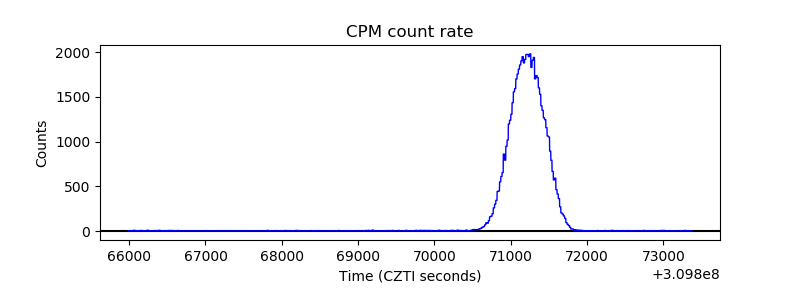 |
| CZT Counter | 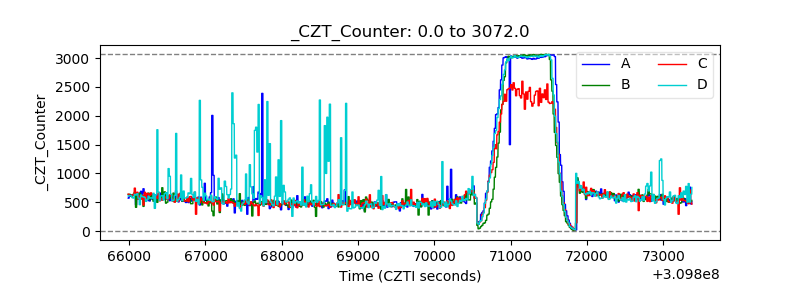 |
| +2.5 Volts monitor |  |
| +5 Volts monitor |  |
| _ROLL_ROT | 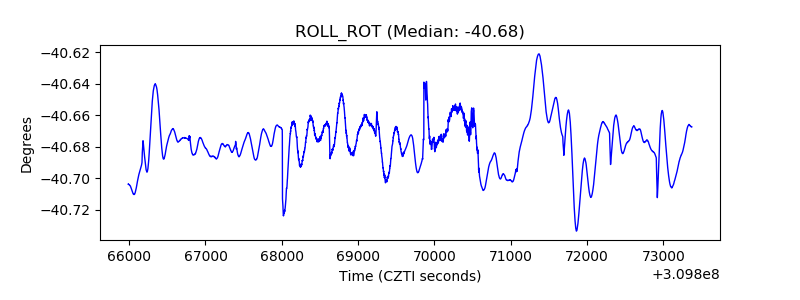 |
| _Roll_DEC | 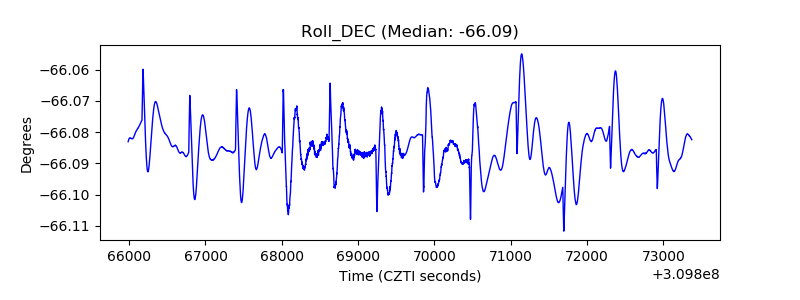 |
| _Roll_RA | 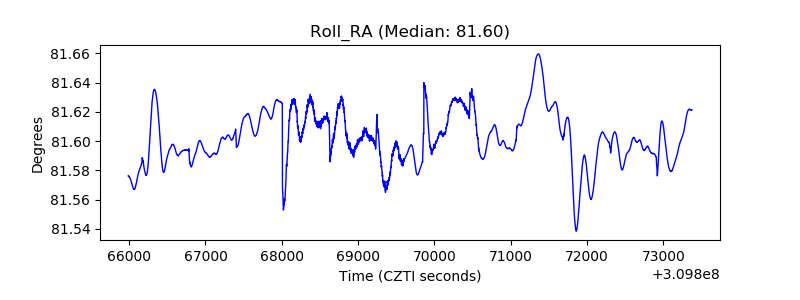 |
| Veto Counter | 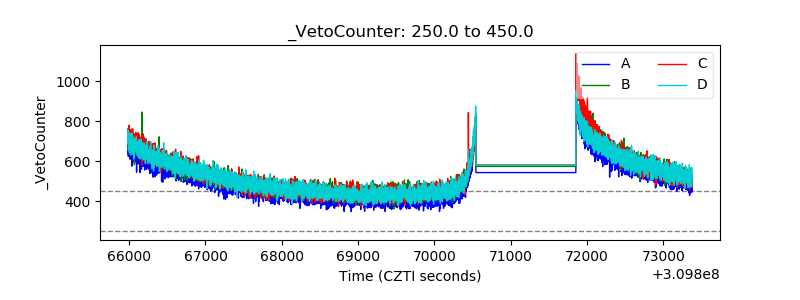 |