| Param | Original file | Final file |
|---|---|---|
| Filename | modeM0/AS1A07_167T01_9000003264_22060cztM0_level2.evt | modeM0/AS1A07_167T01_9000003264_22060cztM0_level2_quad_clean.evt |
| Size (bytes) | 282,790,080 | 54,737,280 |
| Size | 269.7 MB | 52.2 MB |
| Events in quadrant A | 1,945,380 | 358,226 |
| Events in quadrant B | 1,990,167 | 360,368 |
| Events in quadrant C | 1,933,205 | 341,188 |
| Events in quadrant D | 2,435,324 | 328,124 |
| Mode M0 | |||
|---|---|---|---|
| Quadrant | BADHDUFLAG | Total packets | Discarded packets |
| A | 0 | 8152 | 0 |
| B | 0 | 8285 | 0 |
| C | 0 | 8179 | 0 |
| D | 0 | 9765 | 0 |
| Mode SS | |||
|---|---|---|---|
| Quadrant | BADHDUFLAG | Total packets | Discarded packets |
| A | 0 | 76 | 0 |
| B | 0 | 76 | 0 |
| C | 0 | 76 | 0 |
| D | 0 | 76 | 0 |
| Quadrant | Total seconds | Saturated seconds | Saturation percentage |
|---|---|---|---|
| A | 3812 | 5 | 0.131165% |
| B | 3813 | 7 | 0.183582% |
| C | 3813 | 12 | 0.314713% |
| D | 3813 | 103 | 2.701285% |
Noise dominated data is calculated using 1-second bins in cleaned event files. If a bin has >2000 counts, and if more than 50% of those come from <1% of pixels, then it is considered to be noise-dominated and hence unusable.
| Quadrant | # 1 sec bins | Bins with >0 counts | Bins with >2000 counts | High rate bins dominated by noise | Noise dominated (total time) | Noise dominated (detector-on time) | Marked lightcurve |
|---|---|---|---|---|---|---|---|
| A | 3812 | 3812 | 0 | 0 | 0.00% | 0.00% | 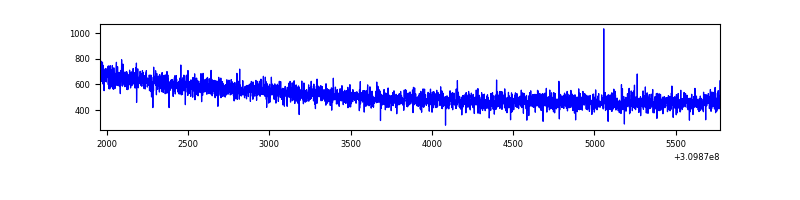 |
| B | 3813 | 3813 | 2 | 2 | 0.05% | 0.05% |  |
| C | 3813 | 3813 | 0 | 0 | 0.00% | 0.00% | 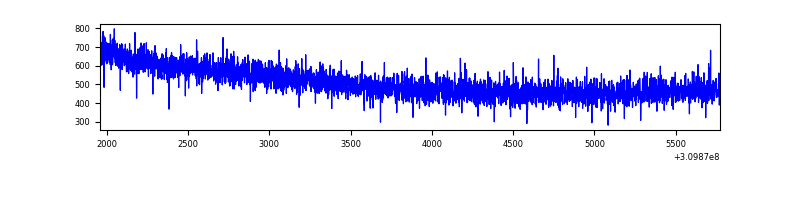 |
| D | 3813 | 3813 | 69 | 69 | 1.81% | 1.81% | 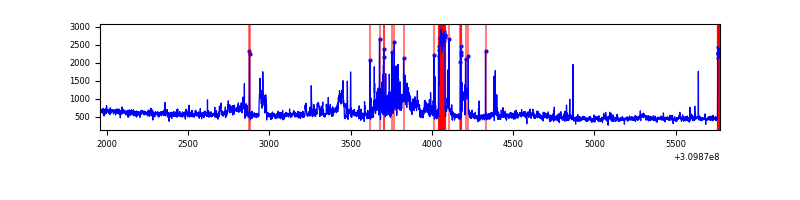 |
Top three noisy pixels from each quadrant. If the there are fewer than three noisy pixels in the level2.evt file, extra rows are filled as -1
| Pixel properties | Quadrant properties | ||||||
|---|---|---|---|---|---|---|---|
| Quadrant | DetID | PixID | Counts | Sigma | Mean | Median | Sigma |
| A | 13 | 254 | 5789 | 53.18 | 504 | 496 | 99.5 |
| A | 0 | 226 | 4306 | 38.28 | 504 | 496 | 99.5 |
| A | 12 | 194 | 3679 | 31.98 | 504 | 496 | 99.5 |
| B | 0 | 190 | 17694 | 189.46 | 497 | 488 | 90.8 |
| B | 3 | 64 | 12523 | 132.52 | 497 | 488 | 90.8 |
| B | 12 | 111 | 9961 | 104.31 | 497 | 488 | 90.8 |
| C | 14 | 238 | 78950 | 715.64 | 475 | 480 | 109.6 |
| C | 13 | 61 | 3324 | 25.94 | 475 | 480 | 109.6 |
| C | 10 | 22 | 2213 | 15.8 | 475 | 480 | 109.6 |
| D | 1 | 52 | 496900 | 4345.47 | 478 | 466 | 114.2 |
| D | 12 | 227 | 87093 | 758.28 | 478 | 466 | 114.2 |
| D | 2 | 136 | 23303 | 199.9 | 478 | 466 | 114.2 |
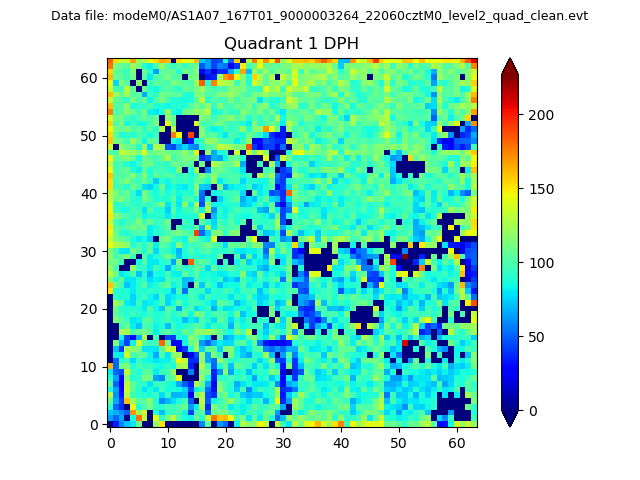
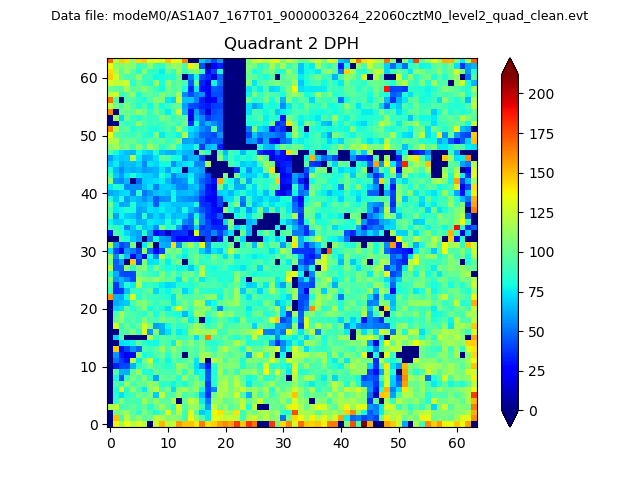
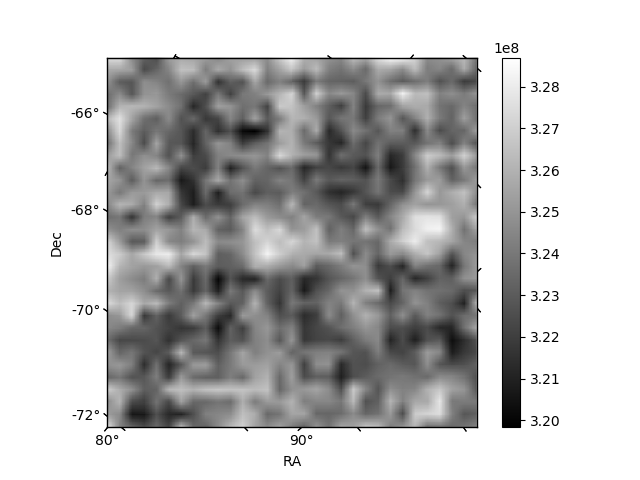
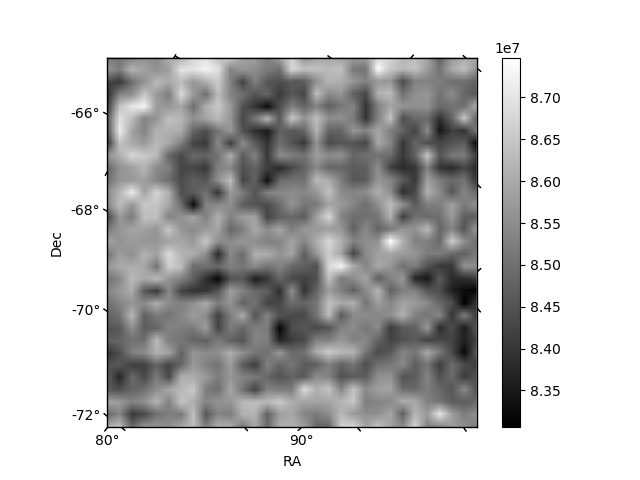
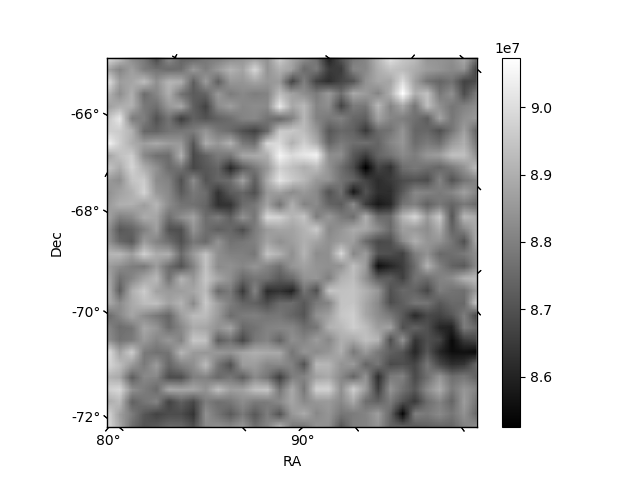
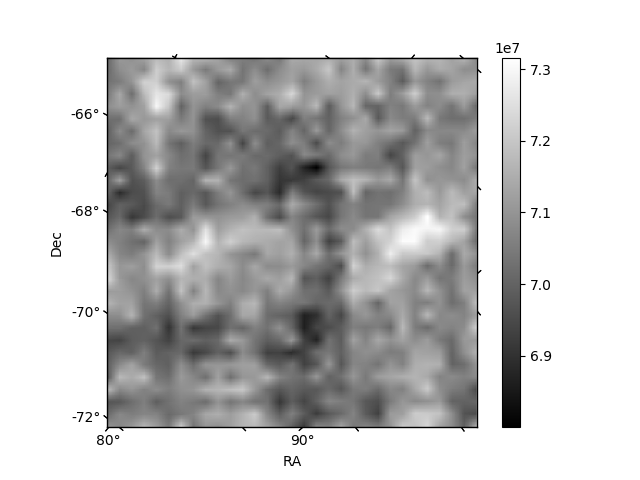
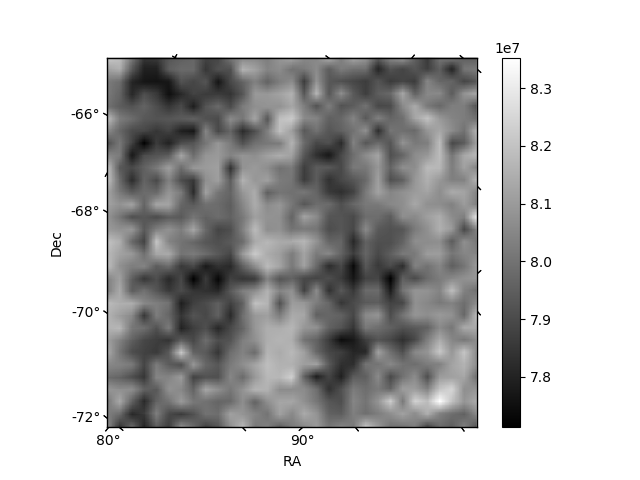
Histogram calculated using DETX and DETY for each event in the final _common_clean file
| Quadrant A | 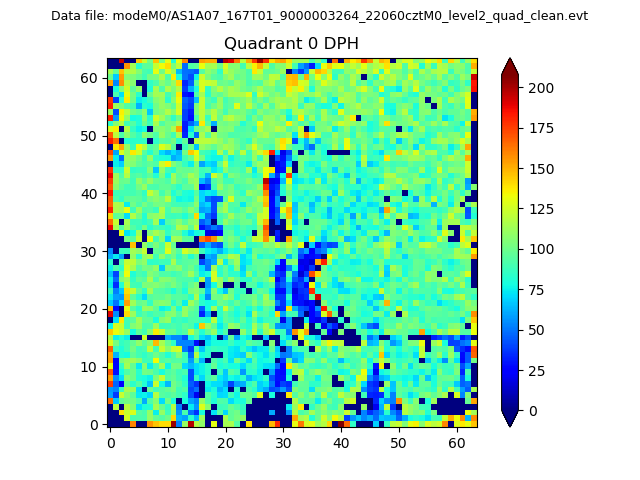 |
 |
Quadrant B |
|---|---|---|---|
| Quadrant D | 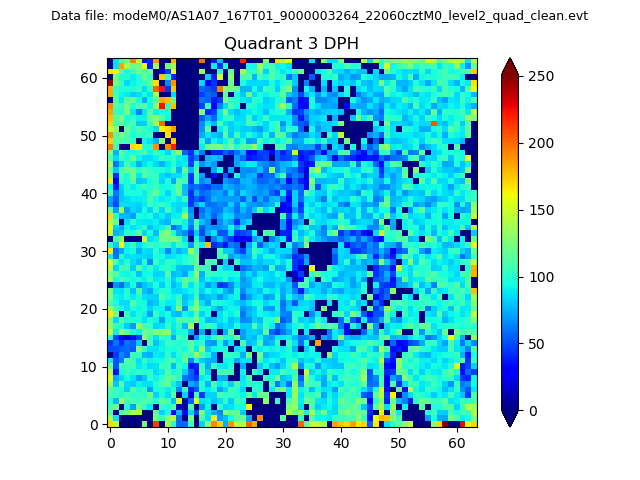 |
 |
Quadrant C |
| Plot type | Count rate plots | Images |
|---|---|---|
| Comparison with Poisson distribution Blue bars denote a histogram of data divided into 1 sec bins. Red curve is a Poisson curve with rate = median count rate of data. |
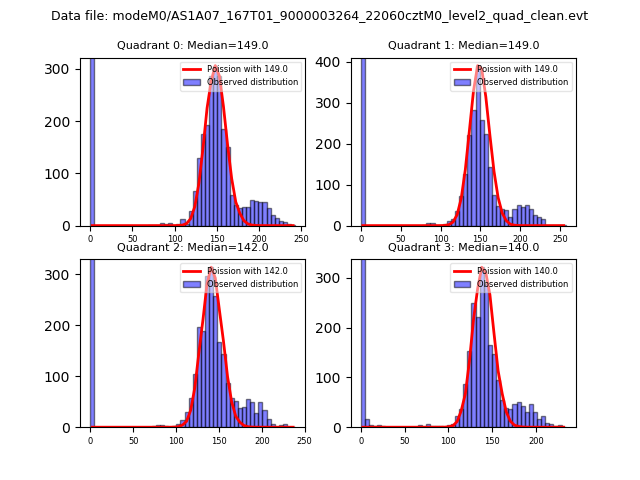 |
 |
| Quadrant-wise count rates Data is divided into 100 sec bins |
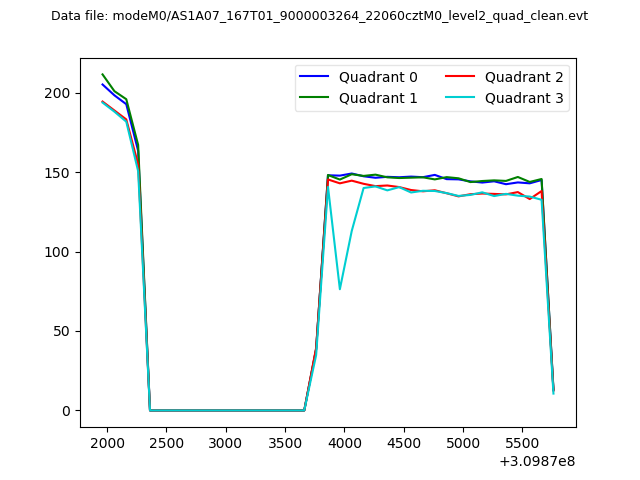 |
|
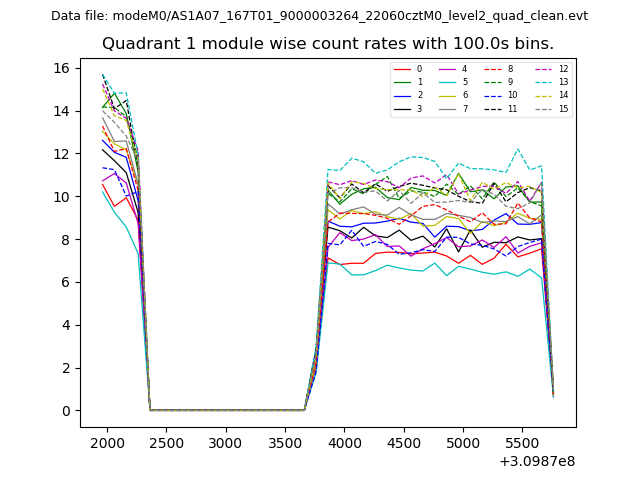
| Module-wise count rates for Quadrant A Data is divided into 100 sec bins |
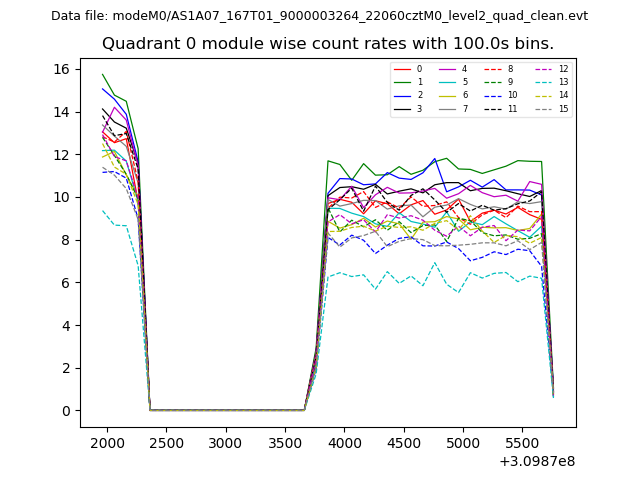 |
 |
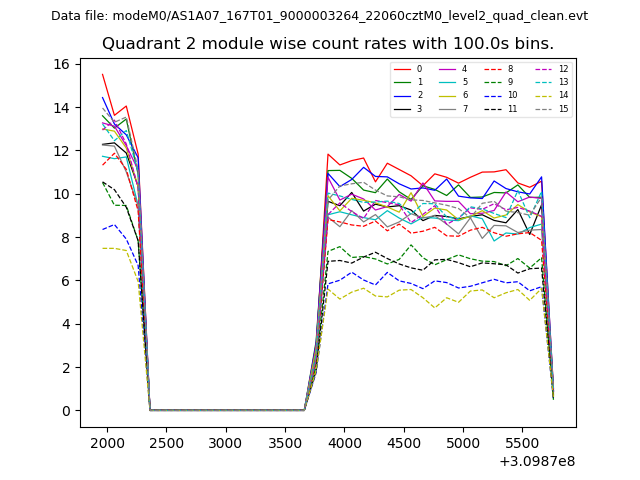
| Module-wise count rates for Quadrant B Data is divided into 100 sec bins |
 |
 |
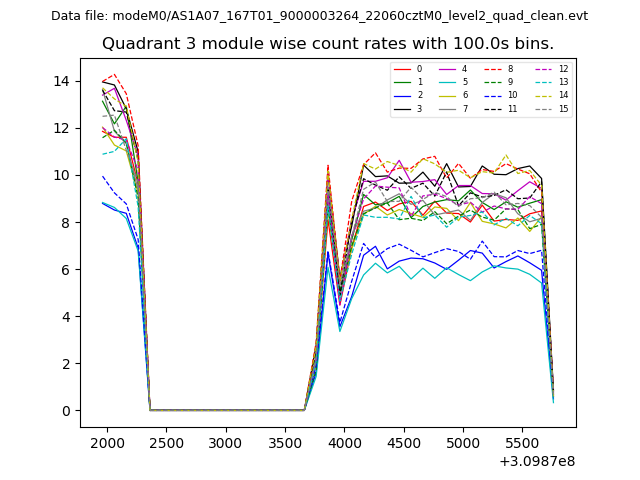
| Module-wise count rates for Quadrant C Data is divided into 100 sec bins |
 |
 |
| Module-wise count rates for Quadrant D Data is divided into 100 sec bins |
 |
 |
| Parameter | Plot |
|---|---|
| CZT HV Monitor | 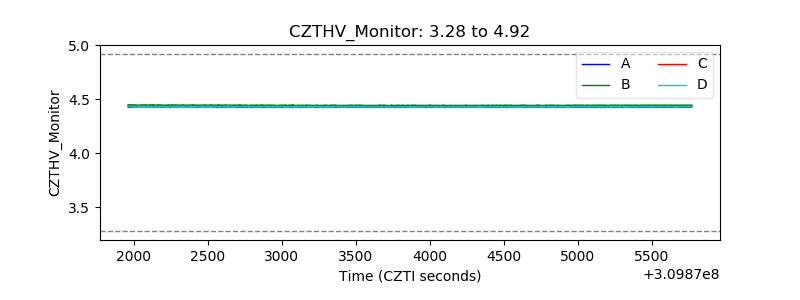 |
| D_VDD | 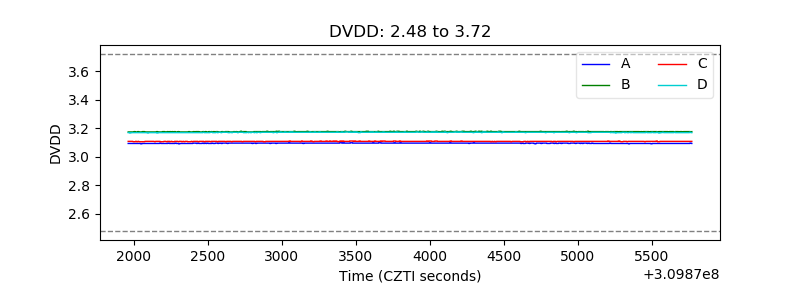 |
| Temperature 1 | 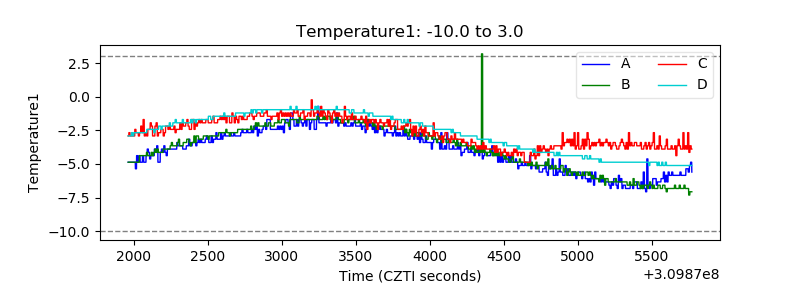 |
| Veto HV Monitor | 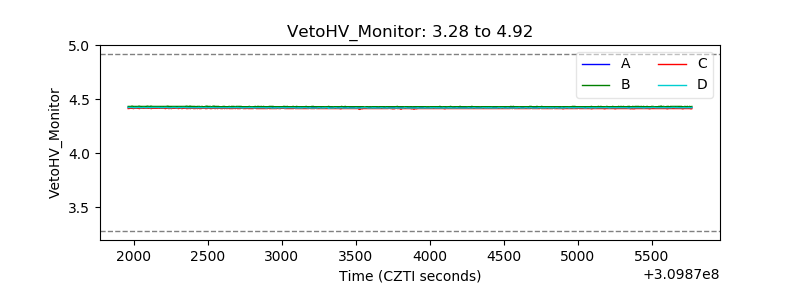 |
| Veto LLD |  |
| Alpha Counter | 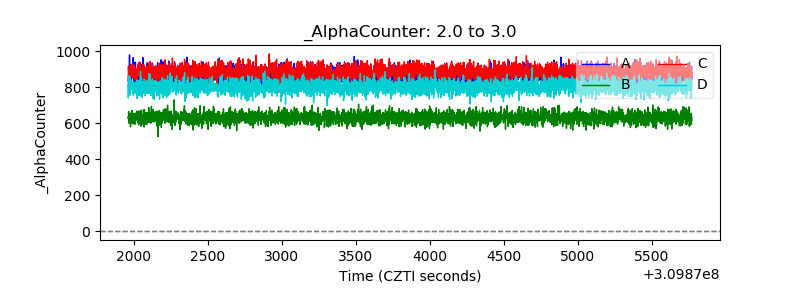 |
| _CPM_Rate | 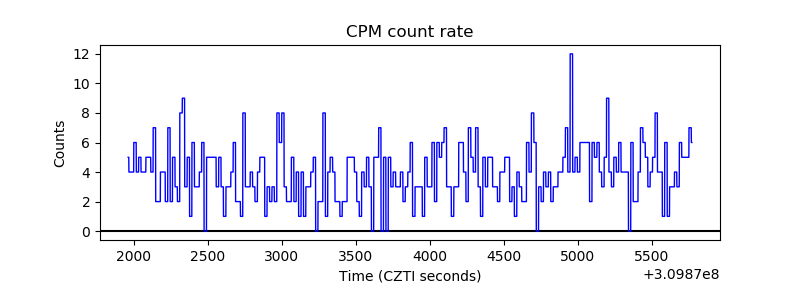 |
| CZT Counter | 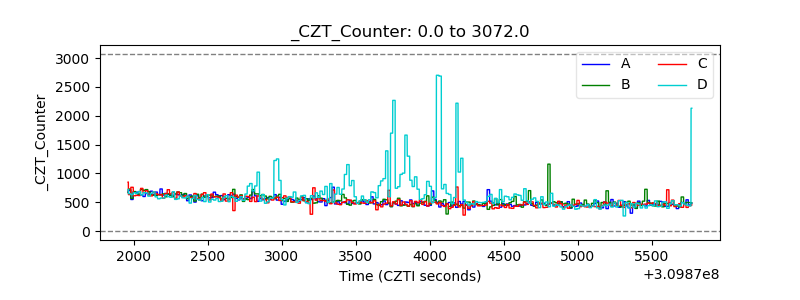 |
| +2.5 Volts monitor |  |
| +5 Volts monitor |  |
| _ROLL_ROT | 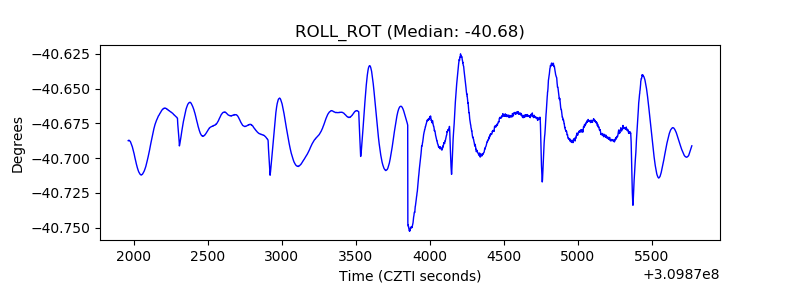 |
| _Roll_DEC | 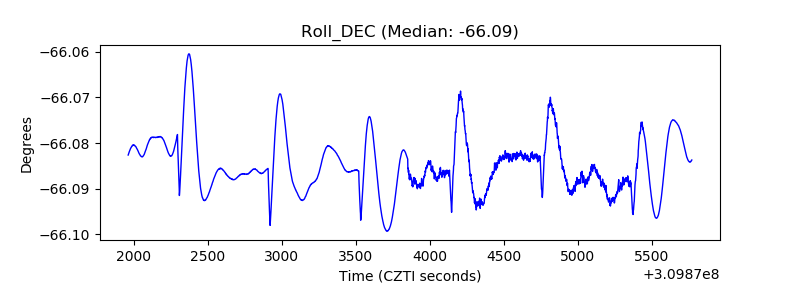 |
| _Roll_RA | 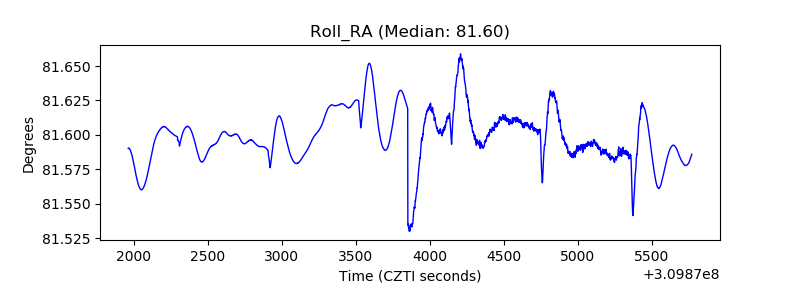 |
| Veto Counter | 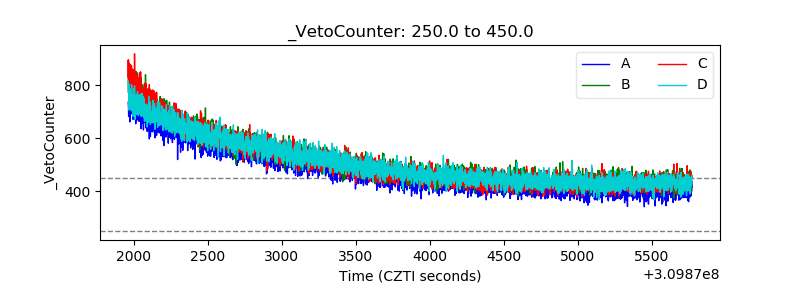 |