| Param | Original file | Final file |
|---|---|---|
| Filename | modeM0/AS1A07_149T01_9000003266_22061cztM0_level2.evt | modeM0/AS1A07_149T01_9000003266_22061cztM0_level2_quad_clean.evt |
| Size (bytes) | 481,754,880 | 107,637,120 |
| Size | 459.4 MB | 102.7 MB |
| Events in quadrant A | 3,401,171 | 713,101 |
| Events in quadrant B | 3,535,288 | 715,215 |
| Events in quadrant C | 3,385,363 | 682,389 |
| Events in quadrant D | 3,807,534 | 676,611 |
| Mode M0 | |||
|---|---|---|---|
| Quadrant | BADHDUFLAG | Total packets | Discarded packets |
| A | 0 | 14349 | 2 |
| B | 0 | 14766 | 2 |
| C | 0 | 14346 | 2 |
| D | 0 | 15737 | 2 |
| Mode SS | |||
|---|---|---|---|
| Quadrant | BADHDUFLAG | Total packets | Discarded packets |
| A | 0 | 136 | 0 |
| B | 0 | 136 | 0 |
| C | 0 | 136 | 0 |
| D | 0 | 136 | 0 |
| Mode M9 | |||
|---|---|---|---|
| Quadrant | BADHDUFLAG | Total packets | Discarded packets |
| A | 0 | 12 | 0 |
| B | 0 | 13 | 0 |
| C | 0 | 13 | 0 |
| D | 0 | 13 | 0 |
| Quadrant | Total seconds | Saturated seconds | Saturation percentage |
|---|---|---|---|
| A | 6787 | 120 | 1.768086% |
| B | 6787 | 172 | 2.534257% |
| C | 6787 | 156 | 2.298512% |
| D | 6787 | 106 | 1.561809% |
Noise dominated data is calculated using 1-second bins in cleaned event files. If a bin has >2000 counts, and if more than 50% of those come from <1% of pixels, then it is considered to be noise-dominated and hence unusable.
| Quadrant | # 1 sec bins | Bins with >0 counts | Bins with >2000 counts | High rate bins dominated by noise | Noise dominated (total time) | Noise dominated (detector-on time) | Marked lightcurve |
|---|---|---|---|---|---|---|---|
| A | 7891 | 6786 | 0 | 0 | 0.00% | 0.00% | 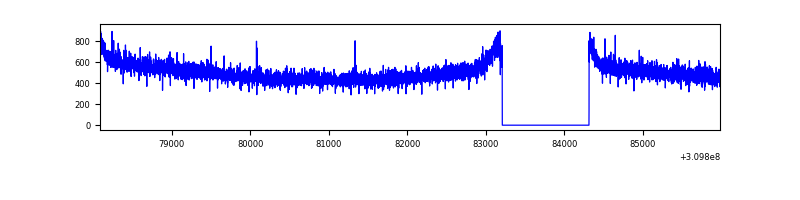 |
| B | 7891 | 6786 | 20 | 20 | 0.25% | 0.29% | 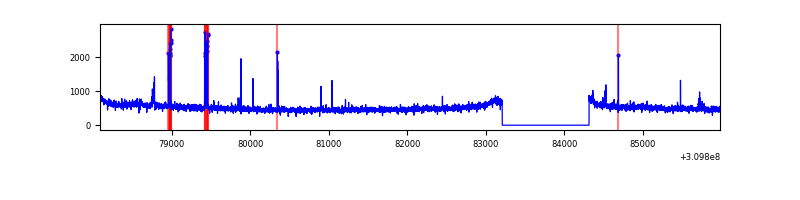 |
| C | 7891 | 6786 | 0 | 0 | 0.00% | 0.00% | 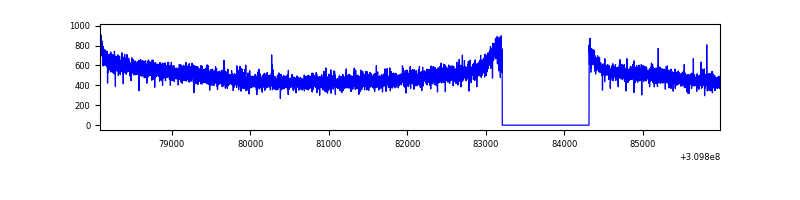 |
| D | 7891 | 6786 | 20 | 20 | 0.25% | 0.29% | 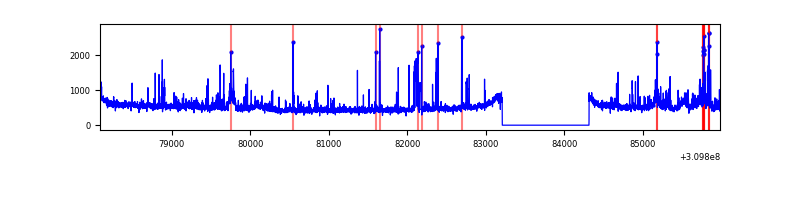 |
Top three noisy pixels from each quadrant. If the there are fewer than three noisy pixels in the level2.evt file, extra rows are filled as -1
| Pixel properties | Quadrant properties | ||||||
|---|---|---|---|---|---|---|---|
| Quadrant | DetID | PixID | Counts | Sigma | Mean | Median | Sigma |
| A | 13 | 254 | 10684 | 56.07 | 882 | 864 | 175.1 |
| A | 0 | 226 | 7613 | 38.53 | 882 | 864 | 175.1 |
| A | 3 | 137 | 7096 | 35.58 | 882 | 864 | 175.1 |
| B | 3 | 64 | 71020 | 436.65 | 872 | 852 | 160.7 |
| B | 0 | 197 | 21914 | 131.07 | 872 | 852 | 160.7 |
| B | 0 | 190 | 21645 | 129.39 | 872 | 852 | 160.7 |
| C | 14 | 238 | 135689 | 709.92 | 832 | 837 | 190.0 |
| C | 13 | 61 | 5863 | 26.46 | 832 | 837 | 190.0 |
| C | 0 | 10 | 2751 | 10.08 | 832 | 837 | 190.0 |
| D | 1 | 52 | 362238 | 1768.83 | 853 | 828 | 204.3 |
| D | 13 | 172 | 89888 | 435.88 | 853 | 828 | 204.3 |
| D | 7 | 223 | 74267 | 359.43 | 853 | 828 | 204.3 |
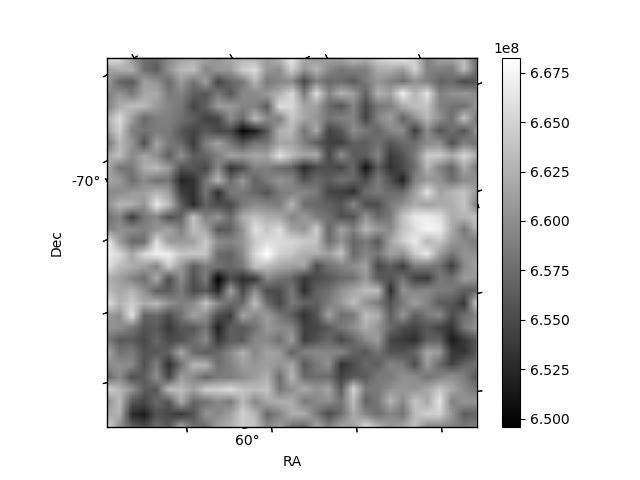
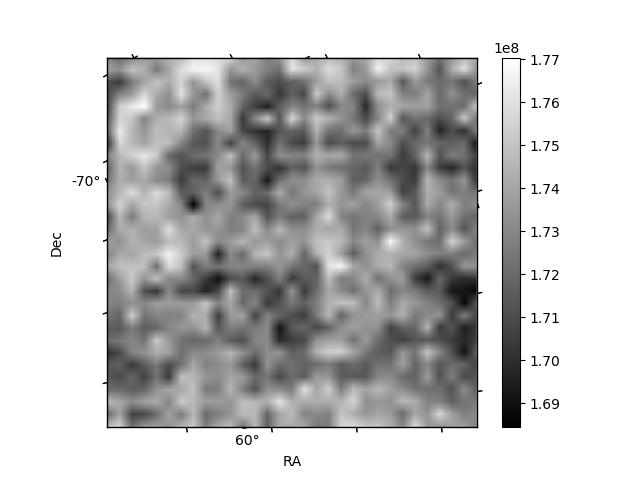
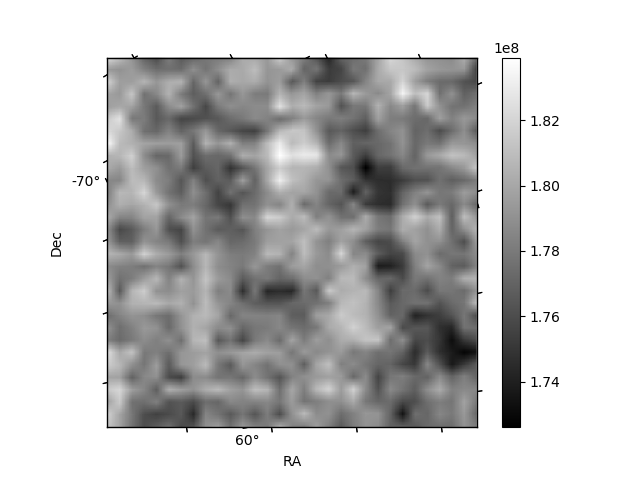
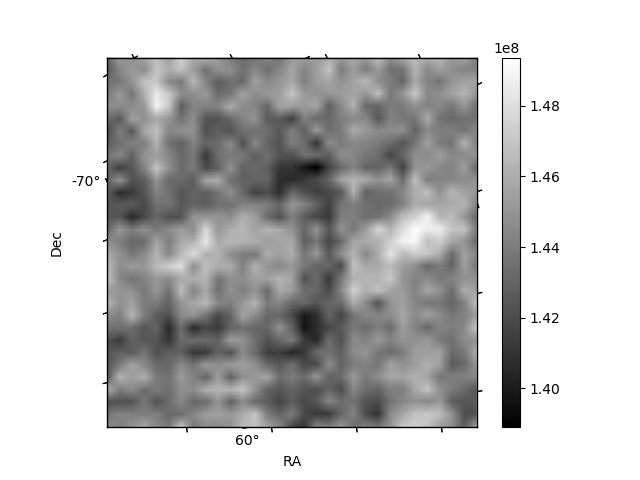
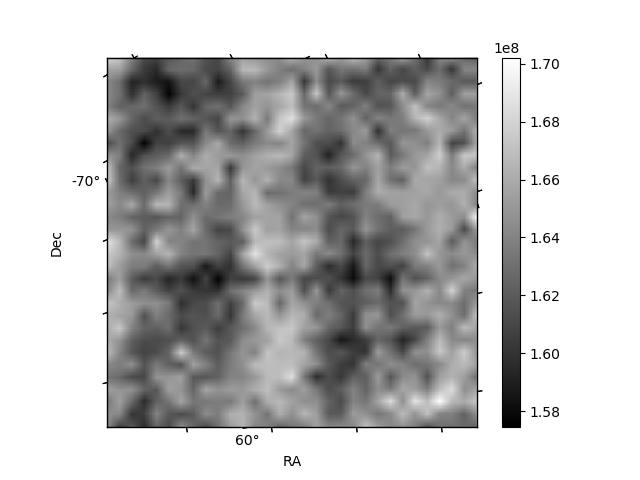
Histogram calculated using DETX and DETY for each event in the final _common_clean file
| Quadrant A | 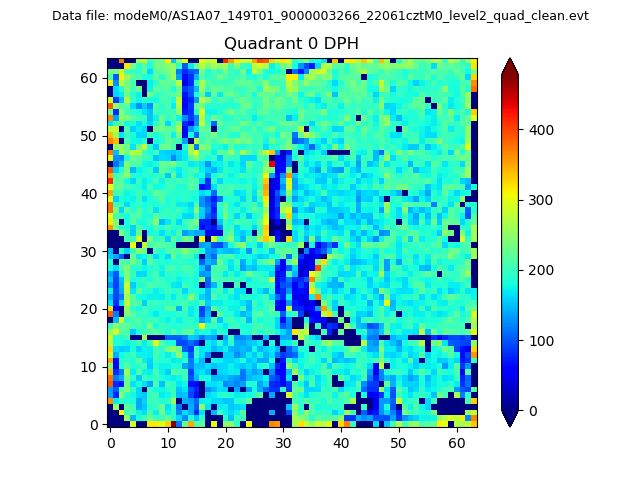 |
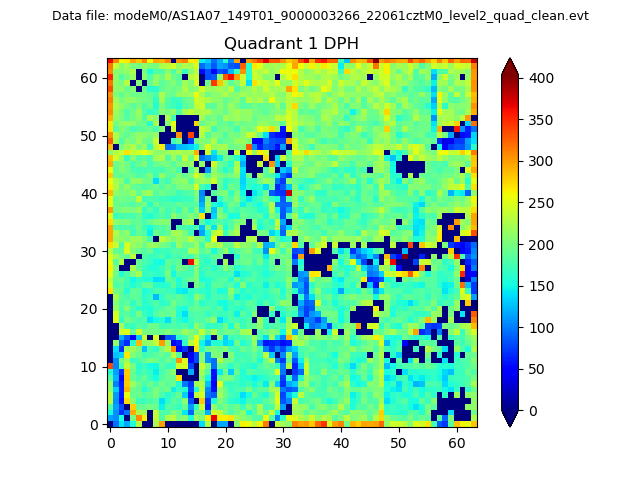 |
Quadrant B |
|---|---|---|---|
| Quadrant D | 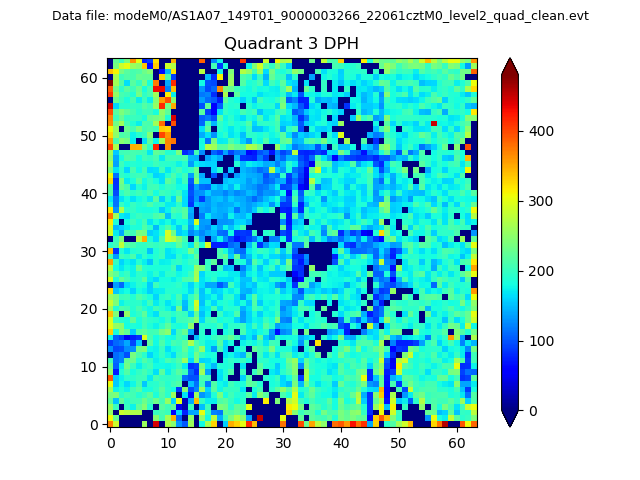 |
 |
Quadrant C |
| Plot type | Count rate plots | Images |
|---|---|---|
| Comparison with Poisson distribution Blue bars denote a histogram of data divided into 1 sec bins. Red curve is a Poisson curve with rate = median count rate of data. |
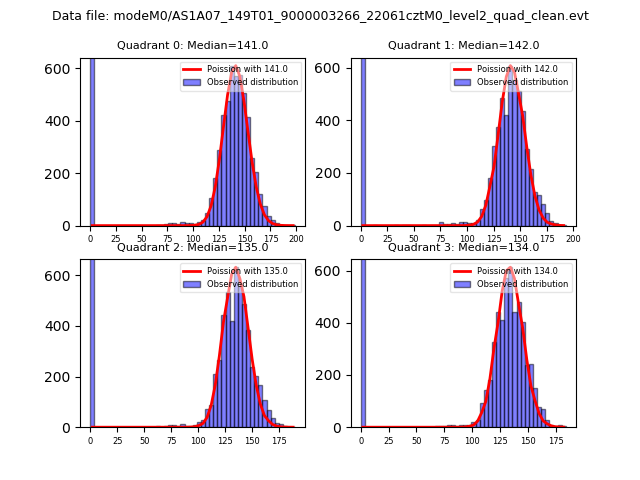 |
 |
| Quadrant-wise count rates Data is divided into 100 sec bins |
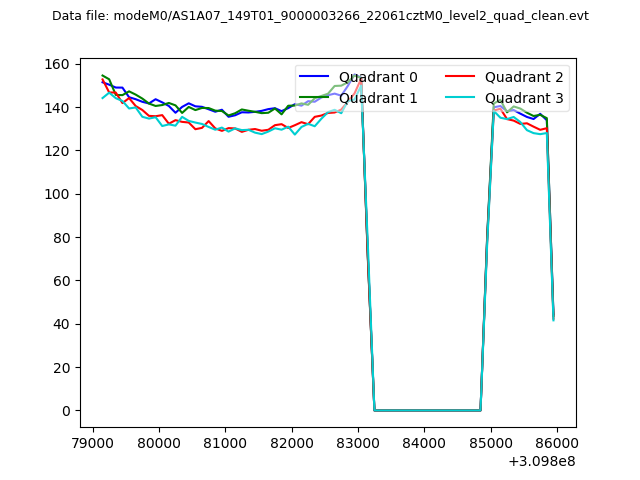 |
|
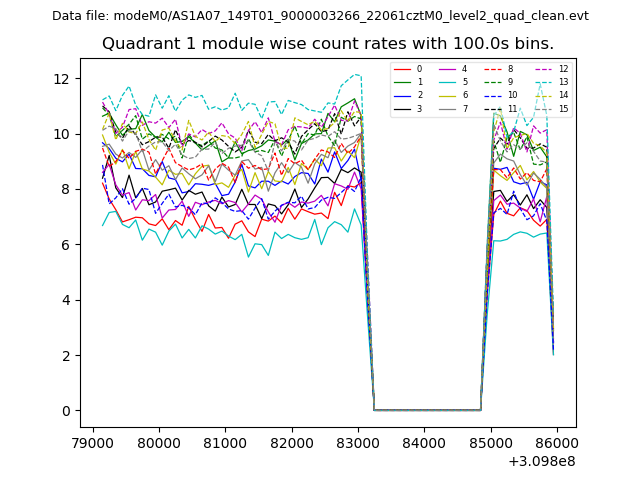
| Module-wise count rates for Quadrant A Data is divided into 100 sec bins |
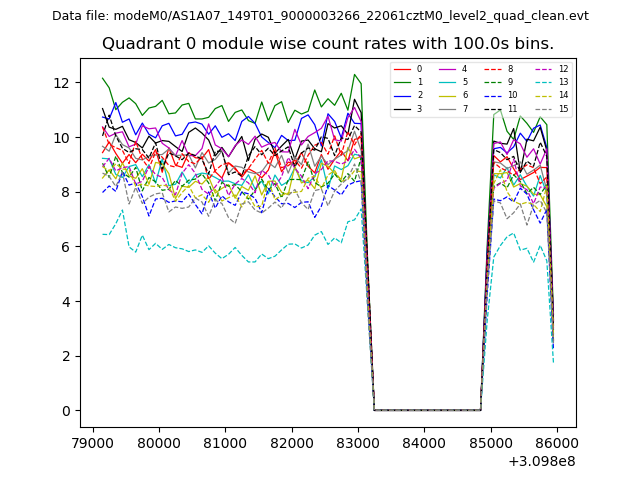 |
 |
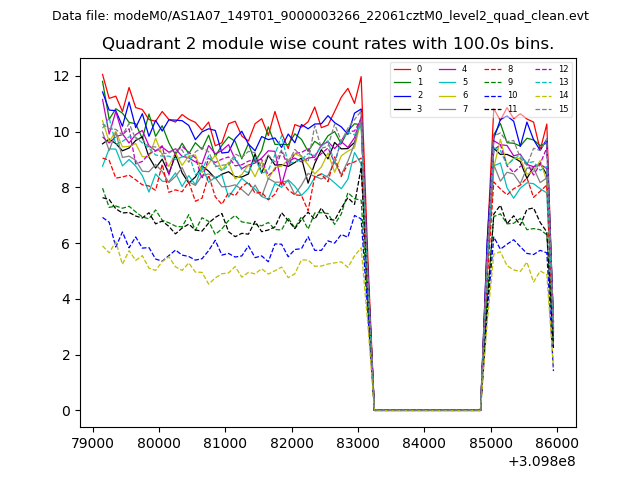
| Module-wise count rates for Quadrant B Data is divided into 100 sec bins |
 |
 |
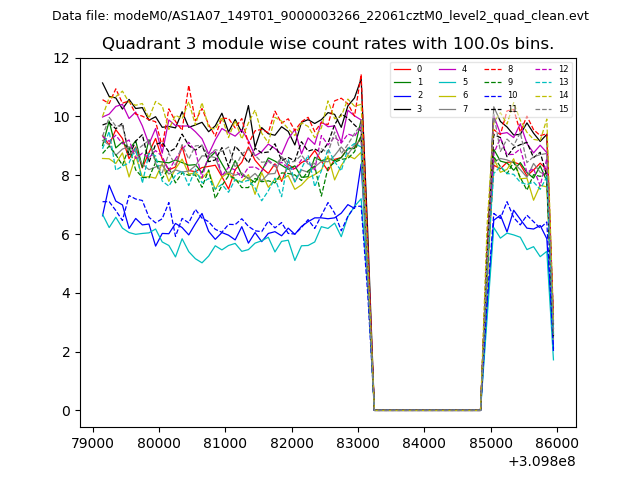
| Module-wise count rates for Quadrant C Data is divided into 100 sec bins |
 |
 |
| Module-wise count rates for Quadrant D Data is divided into 100 sec bins |
 |
 |
| Parameter | Plot |
|---|---|
| CZT HV Monitor | 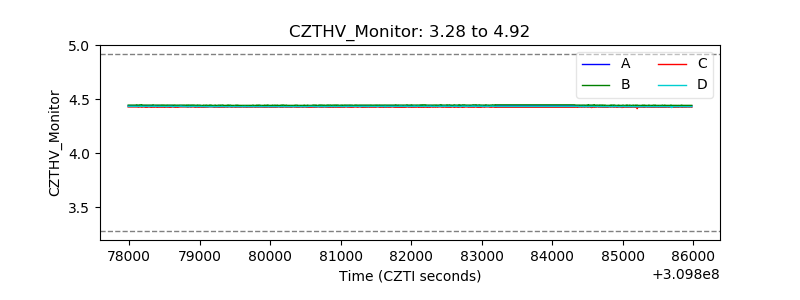 |
| D_VDD | 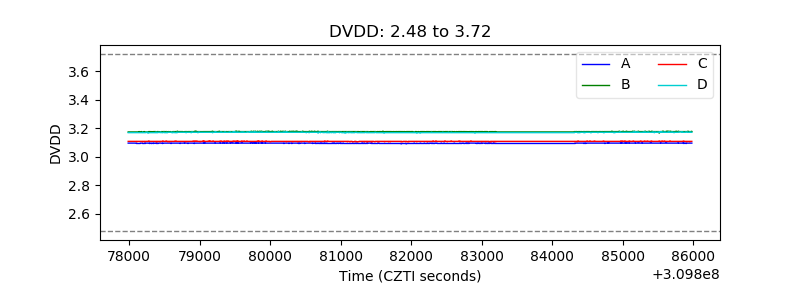 |
| Temperature 1 | 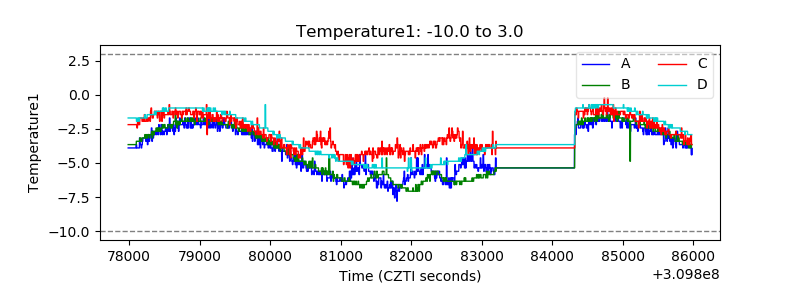 |
| Veto HV Monitor | 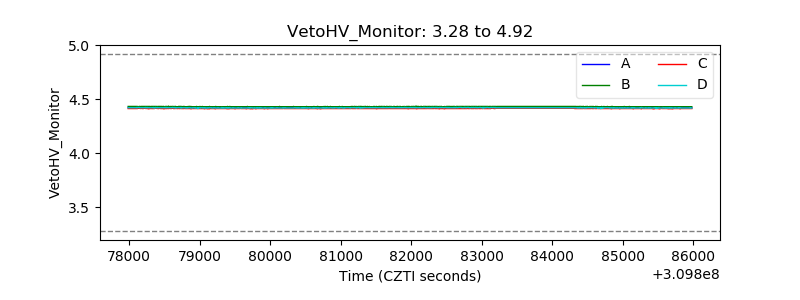 |
| Veto LLD | 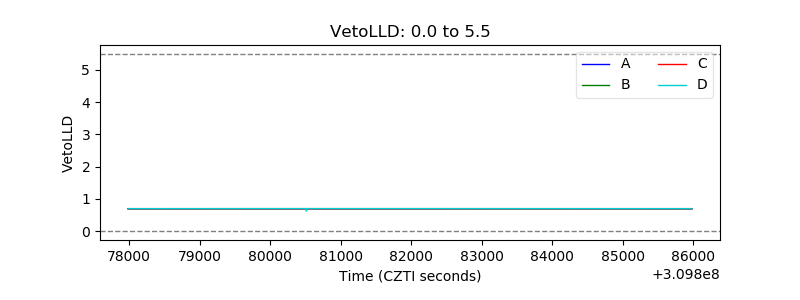 |
| Alpha Counter | 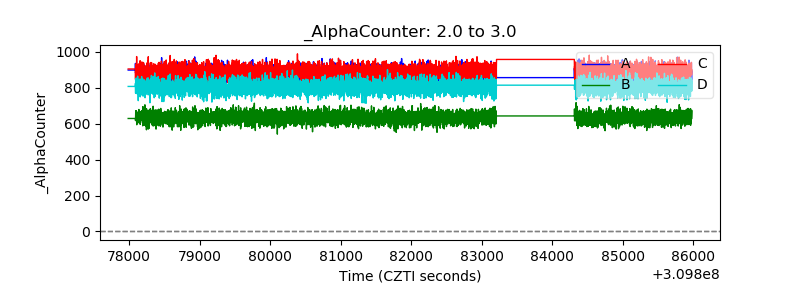 |
| _CPM_Rate | 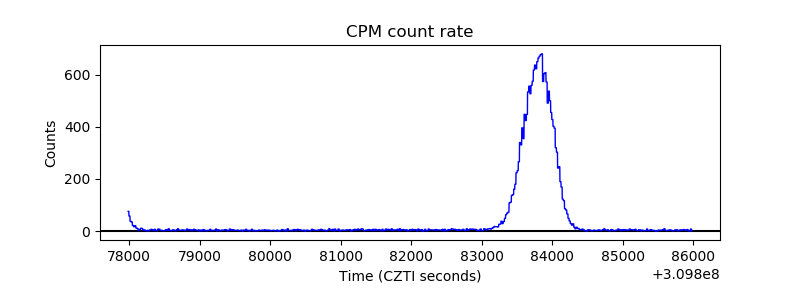 |
| CZT Counter | 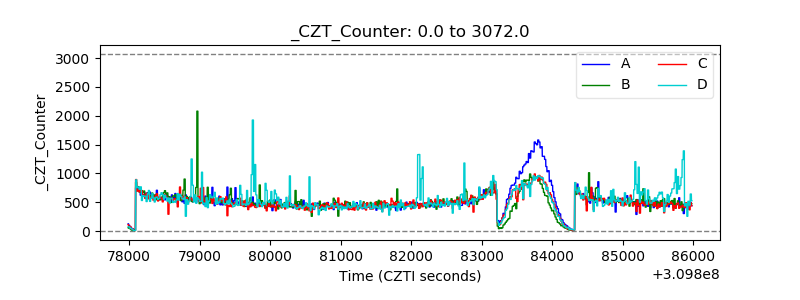 |
| +2.5 Volts monitor | 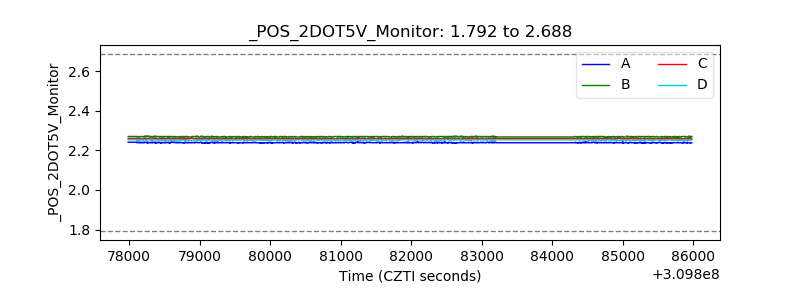 |
| +5 Volts monitor | 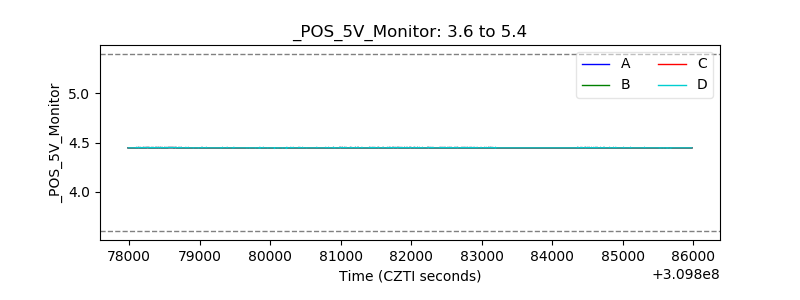 |
| _ROLL_ROT | 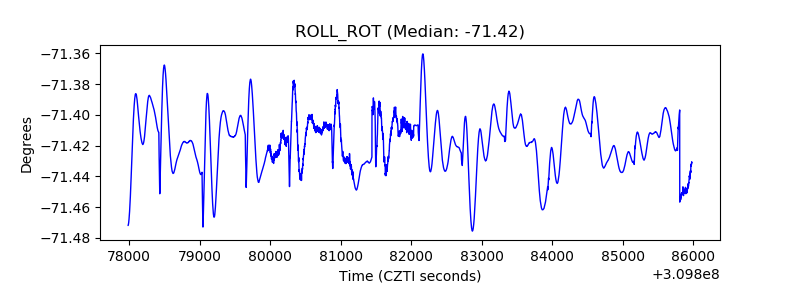 |
| _Roll_DEC | 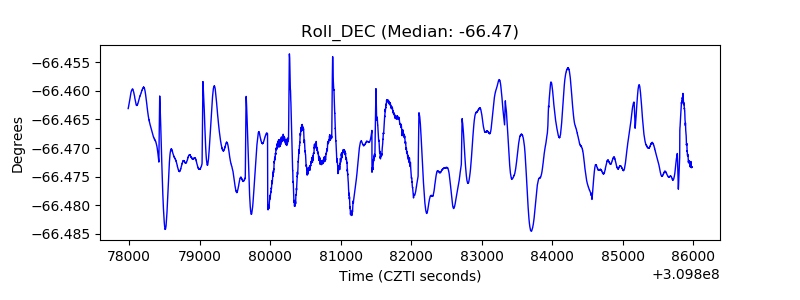 |
| _Roll_RA | 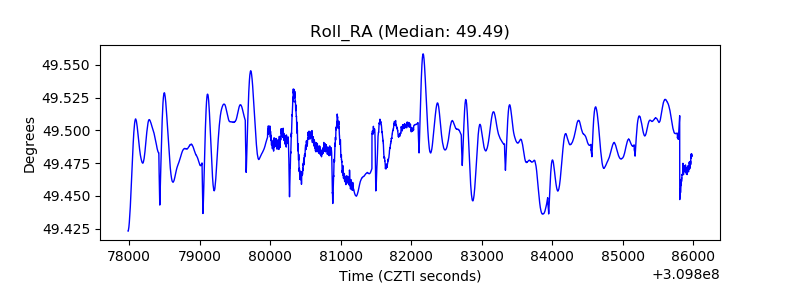 |
| Veto Counter | 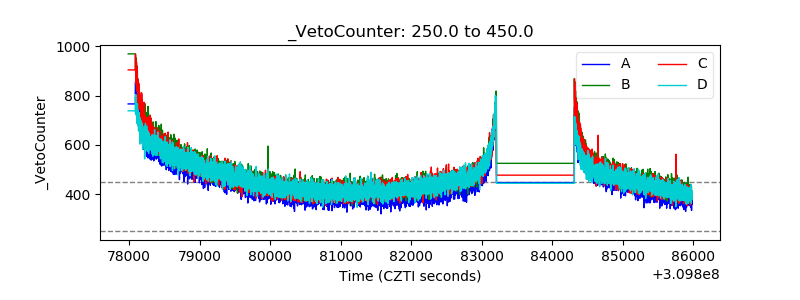 |