| Param | Original file | Final file |
|---|---|---|
| Filename | modeM0/AS1A07_149T01_9000003266_22063cztM0_level2.evt | modeM0/AS1A07_149T01_9000003266_22063cztM0_level2_quad_clean.evt |
| Size (bytes) | 533,854,080 | 118,033,920 |
| Size | 509.1 MB | 112.6 MB |
| Events in quadrant A | 3,405,899 | 783,057 |
| Events in quadrant B | 3,601,267 | 793,230 |
| Events in quadrant C | 3,458,123 | 757,400 |
| Events in quadrant D | 5,204,857 | 730,839 |
| Mode M0 | |||
|---|---|---|---|
| Quadrant | BADHDUFLAG | Total packets | Discarded packets |
| A | 0 | 15039 | 2 |
| B | 0 | 15469 | 2 |
| C | 0 | 15109 | 2 |
| D | 0 | 20538 | 2 |
| Mode SS | |||
|---|---|---|---|
| Quadrant | BADHDUFLAG | Total packets | Discarded packets |
| A | 0 | 152 | 0 |
| B | 0 | 152 | 0 |
| C | 0 | 152 | 0 |
| D | 0 | 152 | 0 |
| Mode M9 | |||
|---|---|---|---|
| Quadrant | BADHDUFLAG | Total packets | Discarded packets |
| A | 0 | 11 | 0 |
| B | 0 | 12 | 0 |
| C | 0 | 12 | 0 |
| D | 0 | 12 | 0 |
| Quadrant | Total seconds | Saturated seconds | Saturation percentage |
|---|---|---|---|
| A | 7326 | 29 | 0.395850% |
| B | 7326 | 83 | 1.132951% |
| C | 7326 | 79 | 1.078351% |
| D | 7326 | 514 | 7.016107% |
Noise dominated data is calculated using 1-second bins in cleaned event files. If a bin has >2000 counts, and if more than 50% of those come from <1% of pixels, then it is considered to be noise-dominated and hence unusable.
| Quadrant | # 1 sec bins | Bins with >0 counts | Bins with >2000 counts | High rate bins dominated by noise | Noise dominated (total time) | Noise dominated (detector-on time) | Marked lightcurve |
|---|---|---|---|---|---|---|---|
| A | 7780 | 7325 | 0 | 0 | 0.00% | 0.00% | 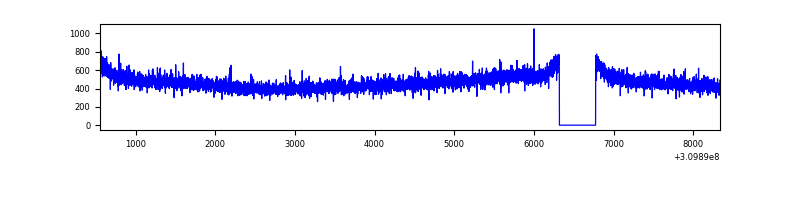 |
| B | 7780 | 7325 | 8 | 8 | 0.10% | 0.11% | 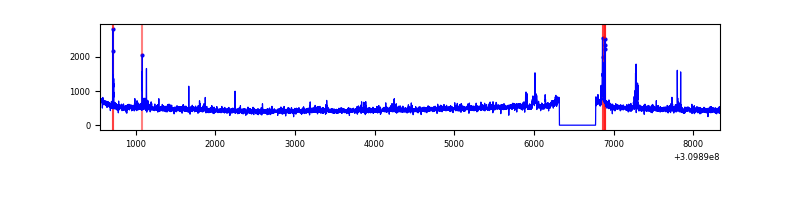 |
| C | 7780 | 7325 | 0 | 0 | 0.00% | 0.00% | 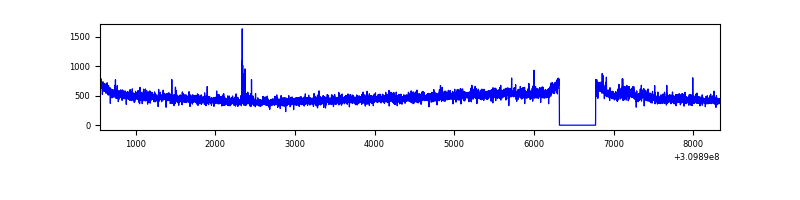 |
| D | 7780 | 7325 | 480 | 480 | 6.17% | 6.55% | 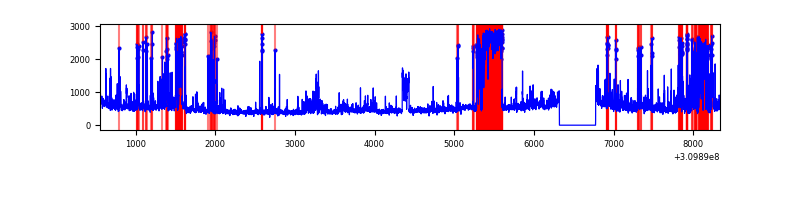 |
Top three noisy pixels from each quadrant. If the there are fewer than three noisy pixels in the level2.evt file, extra rows are filled as -1
| Pixel properties | Quadrant properties | ||||||
|---|---|---|---|---|---|---|---|
| Quadrant | DetID | PixID | Counts | Sigma | Mean | Median | Sigma |
| A | 13 | 254 | 11839 | 61.93 | 882 | 865 | 177.2 |
| A | 0 | 226 | 7652 | 38.3 | 882 | 865 | 177.2 |
| A | 3 | 137 | 7489 | 37.38 | 882 | 865 | 177.2 |
| B | 3 | 64 | 56664 | 336.84 | 880 | 857 | 165.7 |
| B | 0 | 190 | 39585 | 233.75 | 880 | 857 | 165.7 |
| B | 12 | 111 | 19645 | 113.4 | 880 | 857 | 165.7 |
| C | 14 | 238 | 133480 | 675.06 | 842 | 846 | 196.5 |
| C | 8 | 208 | 22557 | 110.5 | 842 | 846 | 196.5 |
| C | 10 | 22 | 12989 | 61.8 | 842 | 846 | 196.5 |
| D | 1 | 52 | 1331386 | 6720.6 | 824 | 800 | 198.0 |
| D | 13 | 172 | 439636 | 2216.5 | 824 | 800 | 198.0 |
| D | 13 | 104 | 102464 | 513.49 | 824 | 800 | 198.0 |
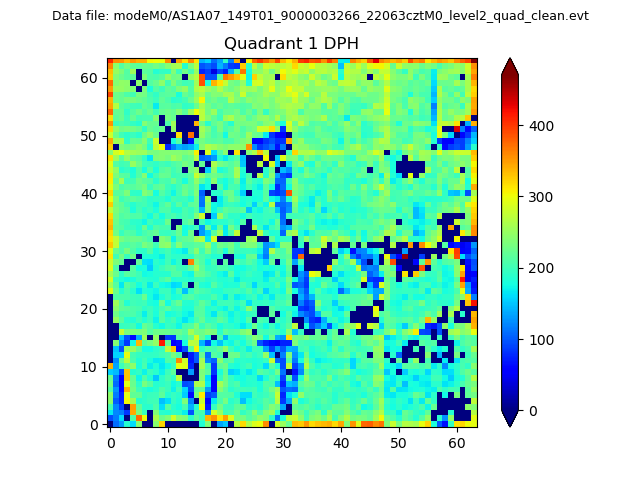
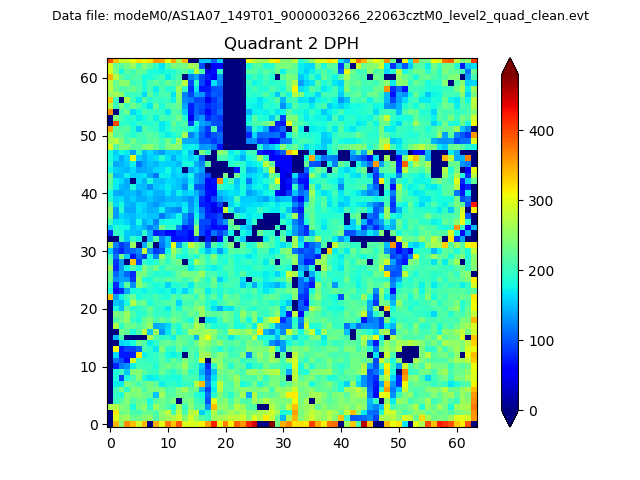
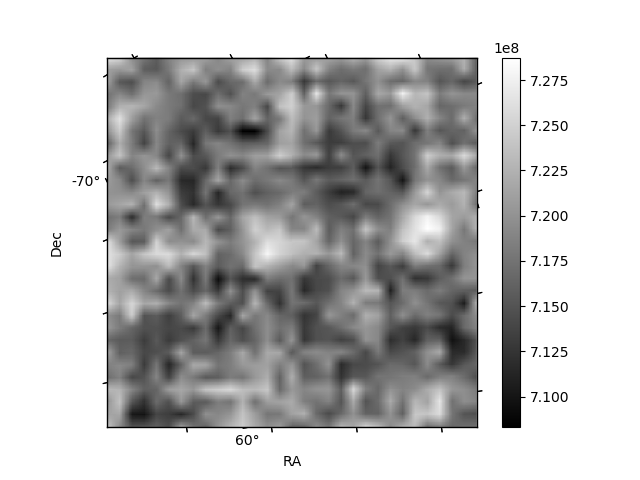
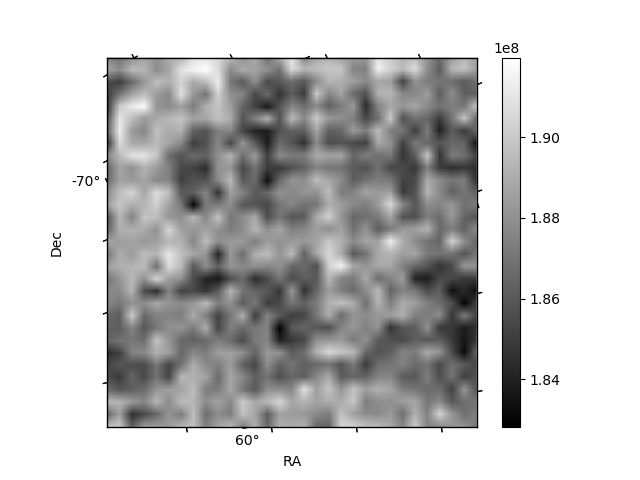
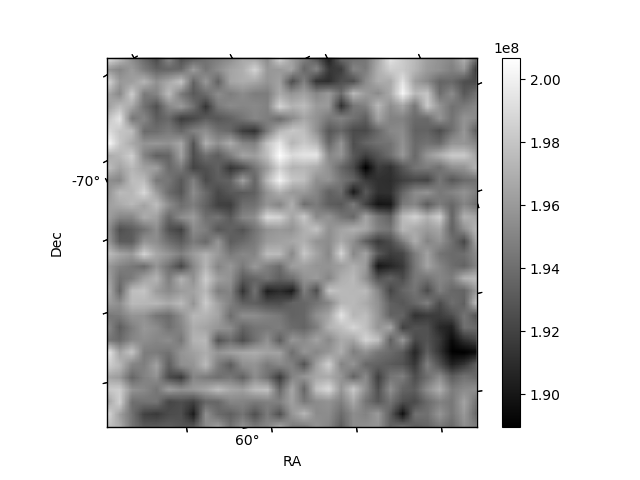
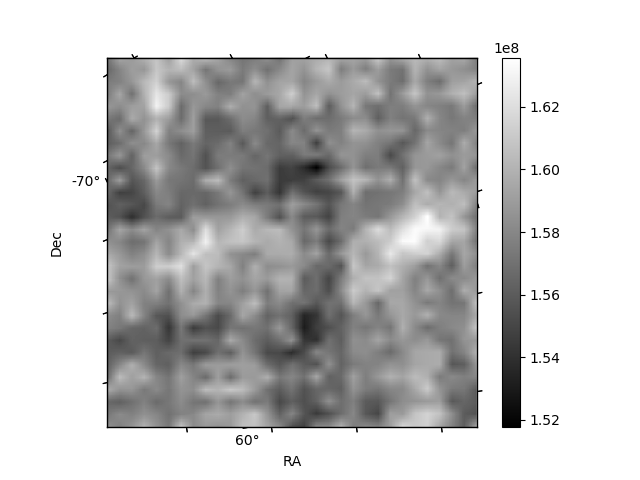
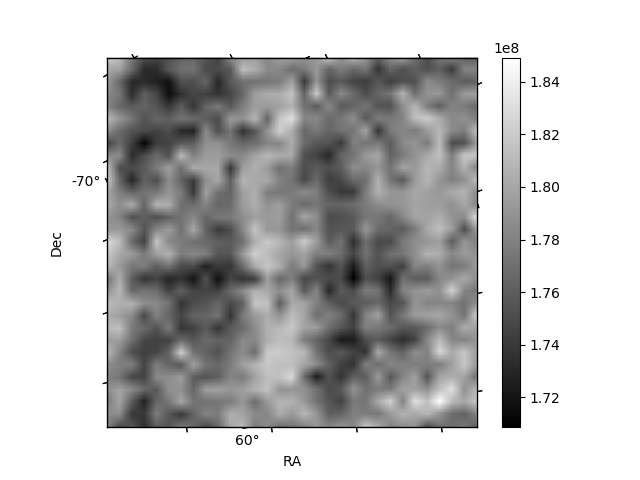
Histogram calculated using DETX and DETY for each event in the final _common_clean file
| Quadrant A |  |
 |
Quadrant B |
|---|---|---|---|
| Quadrant D | 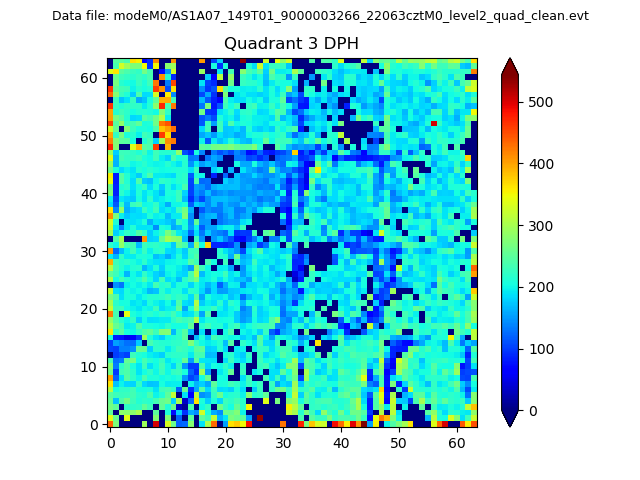 |
 |
Quadrant C |
| Plot type | Count rate plots | Images |
|---|---|---|
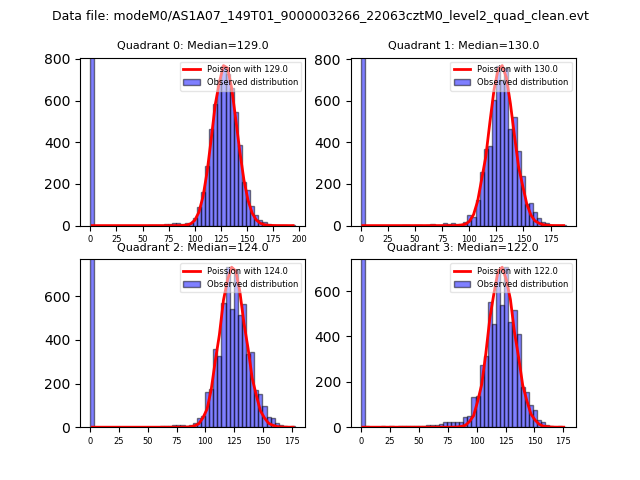
| Comparison with Poisson distribution Blue bars denote a histogram of data divided into 1 sec bins. Red curve is a Poisson curve with rate = median count rate of data. |
 |
 |
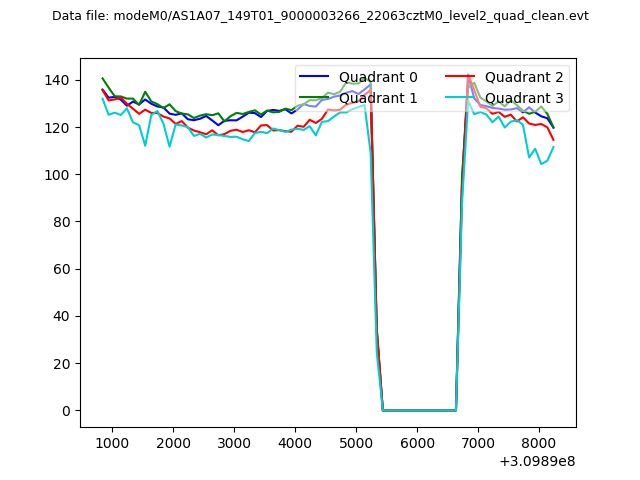
| Quadrant-wise count rates Data is divided into 100 sec bins |
 |
|
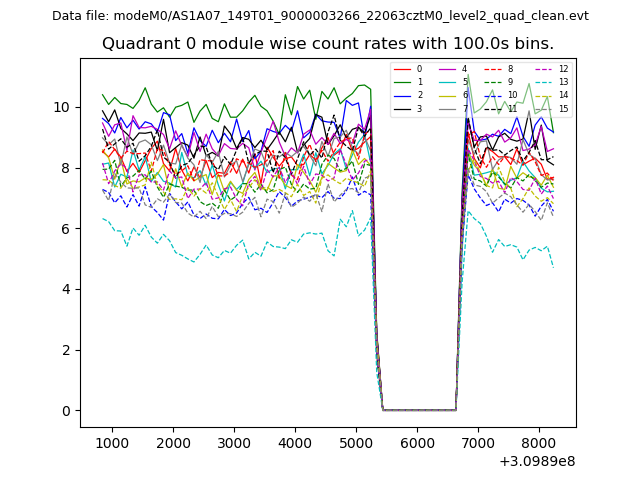
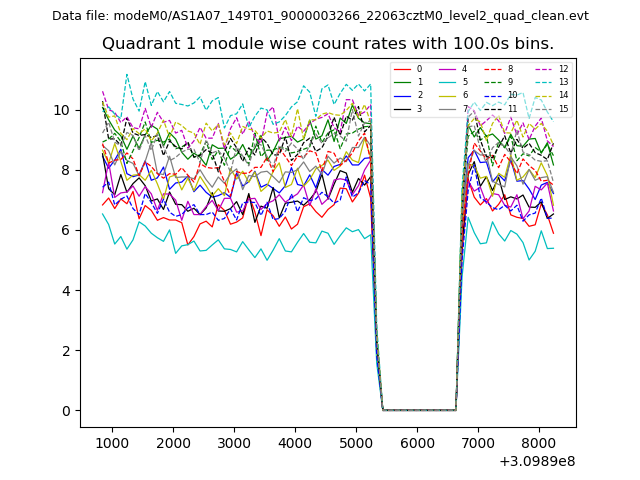
| Module-wise count rates for Quadrant A Data is divided into 100 sec bins |
 |
 |
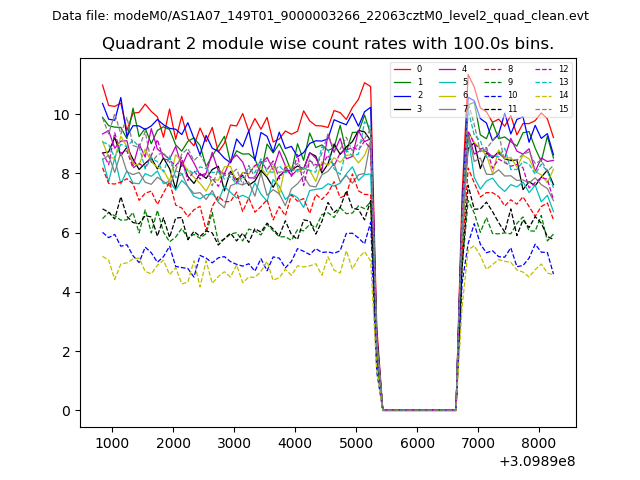
| Module-wise count rates for Quadrant B Data is divided into 100 sec bins |
 |
 |
| Module-wise count rates for Quadrant C Data is divided into 100 sec bins |
 |
 |
| Module-wise count rates for Quadrant D Data is divided into 100 sec bins |
 |
 |
| Parameter | Plot |
|---|---|
| CZT HV Monitor | 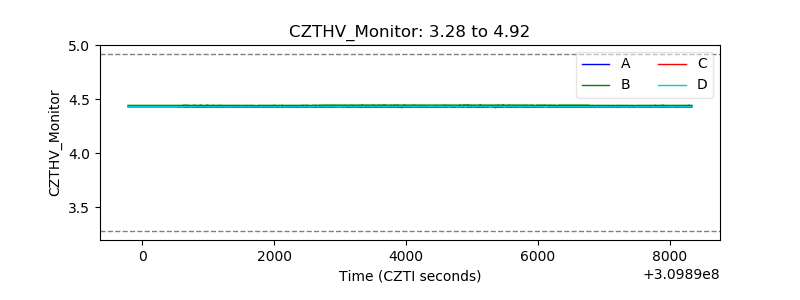 |
| D_VDD | 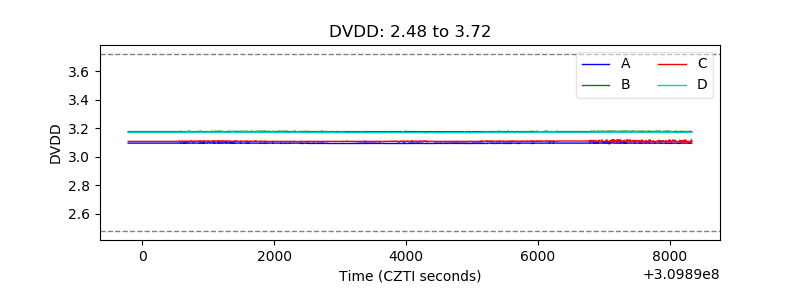 |
| Temperature 1 | 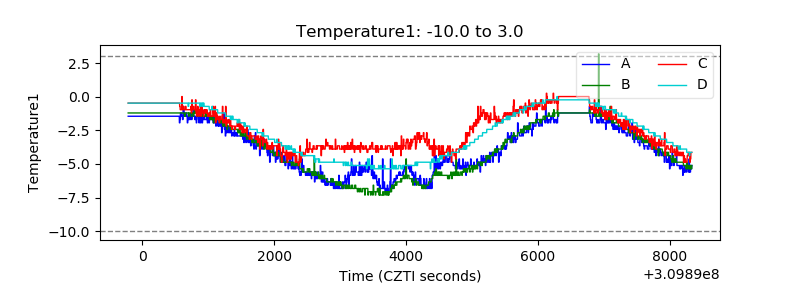 |
| Veto HV Monitor | 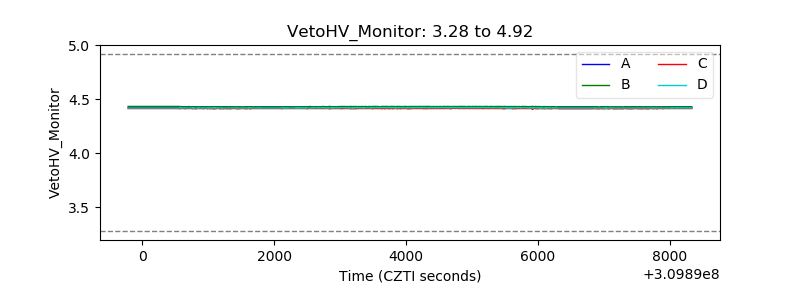 |
| Veto LLD |  |
| Alpha Counter | 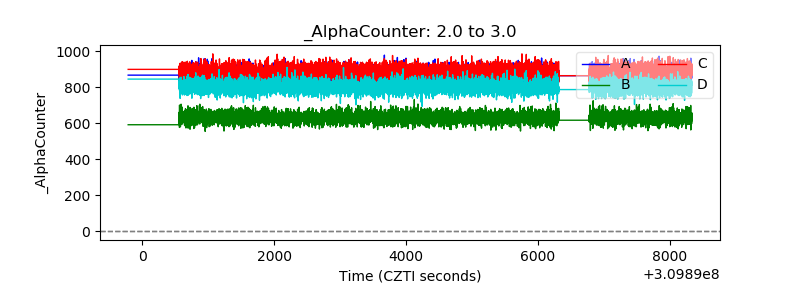 |
| _CPM_Rate | 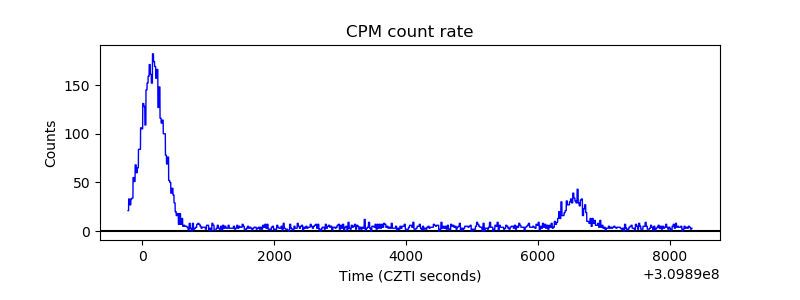 |
| CZT Counter | 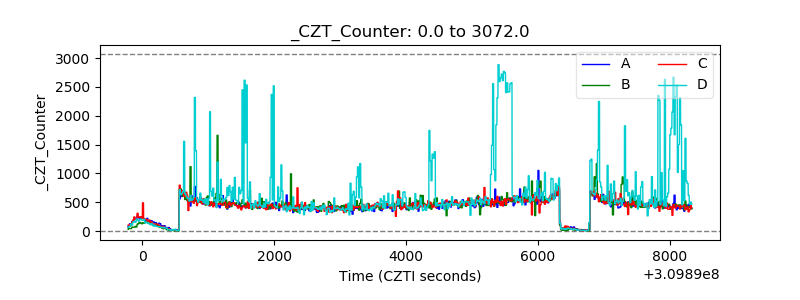 |
| +2.5 Volts monitor |  |
| +5 Volts monitor | 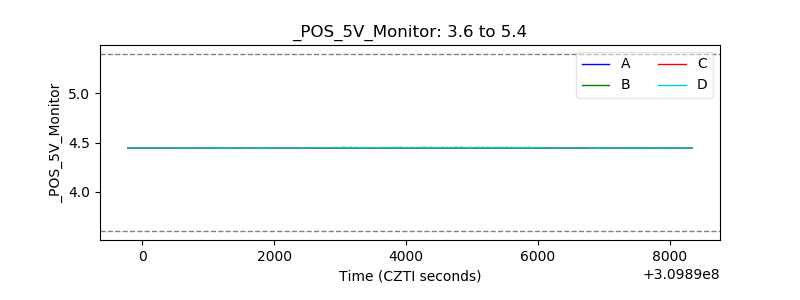 |
| _ROLL_ROT | 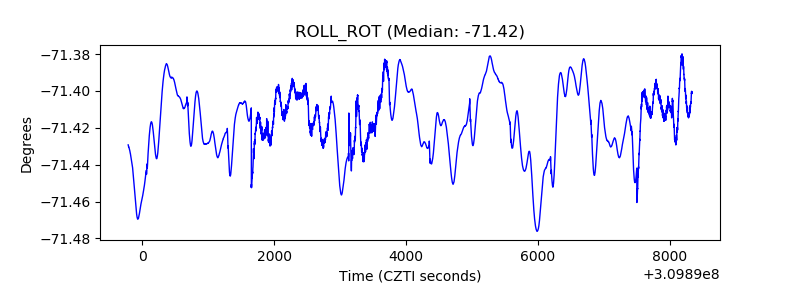 |
| _Roll_DEC | 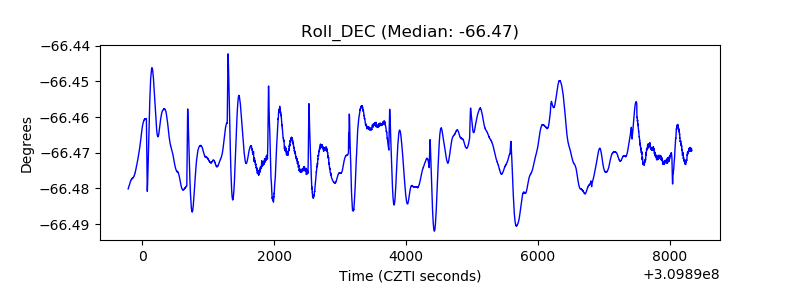 |
| _Roll_RA | 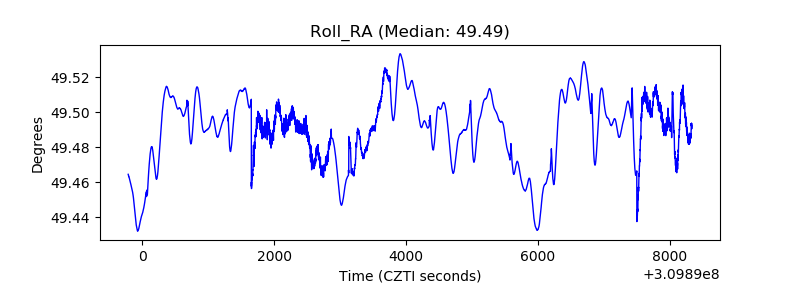 |
| Veto Counter |  |