| Param | Original file | Final file |
|---|---|---|
| Filename | modeM0/AS1A07_149T01_9000003266_22065cztM0_level2.evt | modeM0/AS1A07_149T01_9000003266_22065cztM0_level2_quad_clean.evt |
| Size (bytes) | 585,815,040 | 119,335,680 |
| Size | 558.7 MB | 113.8 MB |
| Events in quadrant A | 3,533,196 | 794,066 |
| Events in quadrant B | 3,714,783 | 802,549 |
| Events in quadrant C | 3,536,806 | 767,918 |
| Events in quadrant D | 6,436,012 | 715,698 |
| Mode M0 | |||
|---|---|---|---|
| Quadrant | BADHDUFLAG | Total packets | Discarded packets |
| A | 0 | 15765 | 2 |
| B | 0 | 16105 | 2 |
| C | 0 | 15698 | 2 |
| D | 0 | 24597 | 2 |
| Mode SS | |||
|---|---|---|---|
| Quadrant | BADHDUFLAG | Total packets | Discarded packets |
| A | 0 | 160 | 0 |
| B | 0 | 160 | 0 |
| C | 0 | 160 | 0 |
| D | 0 | 160 | 0 |
| Mode M9 | |||
|---|---|---|---|
| Quadrant | BADHDUFLAG | Total packets | Discarded packets |
| A | 0 | 5 | 0 |
| B | 0 | 5 | 0 |
| C | 0 | 5 | 0 |
| D | 0 | 5 | 0 |
| Quadrant | Total seconds | Saturated seconds | Saturation percentage |
|---|---|---|---|
| A | 7667 | 50 | 0.652146% |
| B | 7666 | 99 | 1.291417% |
| C | 7666 | 102 | 1.330550% |
| D | 7667 | 995 | 12.977697% |
Noise dominated data is calculated using 1-second bins in cleaned event files. If a bin has >2000 counts, and if more than 50% of those come from <1% of pixels, then it is considered to be noise-dominated and hence unusable.
| Quadrant | # 1 sec bins | Bins with >0 counts | Bins with >2000 counts | High rate bins dominated by noise | Noise dominated (total time) | Noise dominated (detector-on time) | Marked lightcurve |
|---|---|---|---|---|---|---|---|
| A | 8257 | 7667 | 0 | 0 | 0.00% | 0.00% |  |
| B | 8256 | 7667 | 12 | 12 | 0.15% | 0.16% | 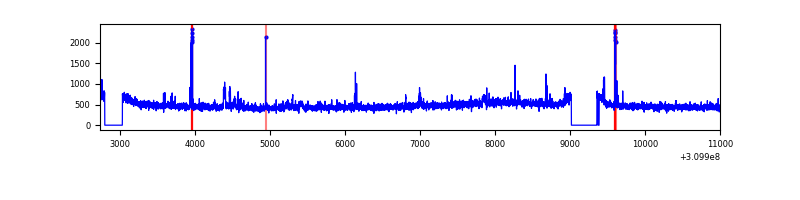 |
| C | 8255 | 7666 | 0 | 0 | 0.00% | 0.00% | 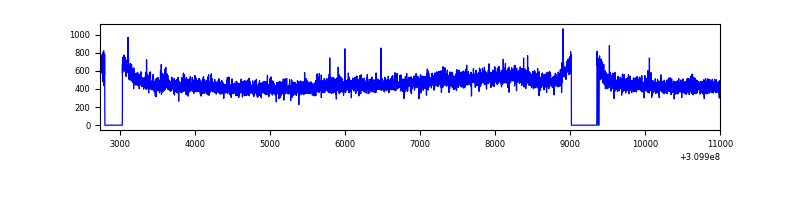 |
| D | 8257 | 7668 | 718 | 718 | 8.70% | 9.36% | 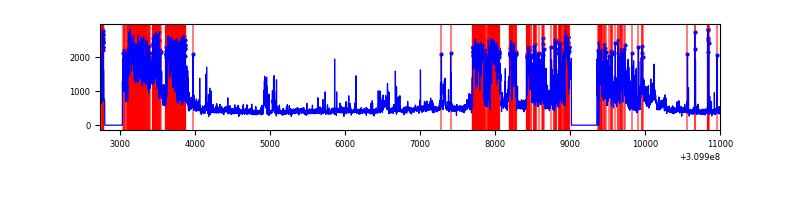 |
Top three noisy pixels from each quadrant. If the there are fewer than three noisy pixels in the level2.evt file, extra rows are filled as -1
| Pixel properties | Quadrant properties | ||||||
|---|---|---|---|---|---|---|---|
| Quadrant | DetID | PixID | Counts | Sigma | Mean | Median | Sigma |
| A | 3 | 1 | 12174 | 61.66 | 910 | 888 | 183.0 |
| A | 2 | 79 | 11392 | 57.39 | 910 | 888 | 183.0 |
| A | 13 | 254 | 11232 | 56.51 | 910 | 888 | 183.0 |
| B | 3 | 64 | 54166 | 303.88 | 910 | 885 | 175.3 |
| B | 0 | 230 | 33461 | 185.8 | 910 | 885 | 175.3 |
| B | 6 | 36 | 31454 | 174.35 | 910 | 885 | 175.3 |
| C | 14 | 238 | 137461 | 669.63 | 870 | 874 | 204.0 |
| C | 13 | 61 | 6030 | 25.28 | 870 | 874 | 204.0 |
| C | 8 | 222 | 5969 | 24.98 | 870 | 874 | 204.0 |
| D | 1 | 52 | 893591 | 4427.17 | 834 | 807 | 201.7 |
| D | 13 | 249 | 556057 | 2753.39 | 834 | 807 | 201.7 |
| D | 7 | 38 | 538502 | 2666.34 | 834 | 807 | 201.7 |
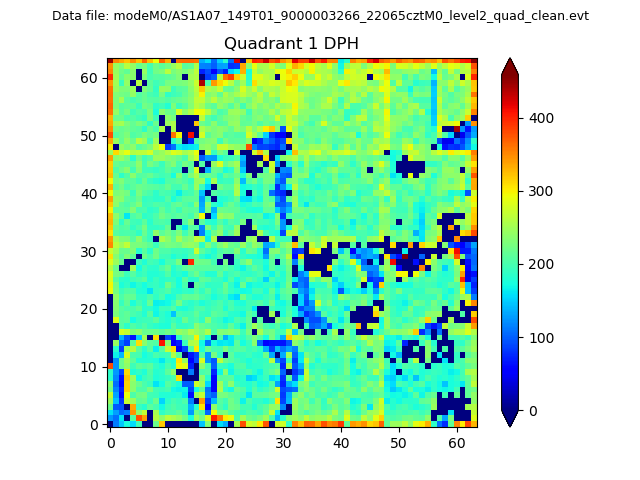
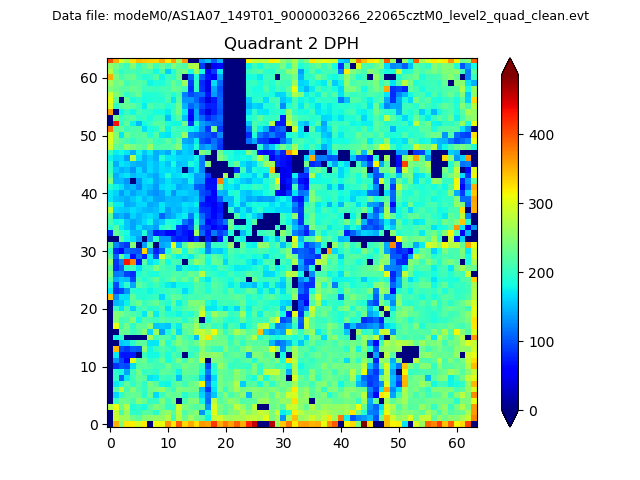
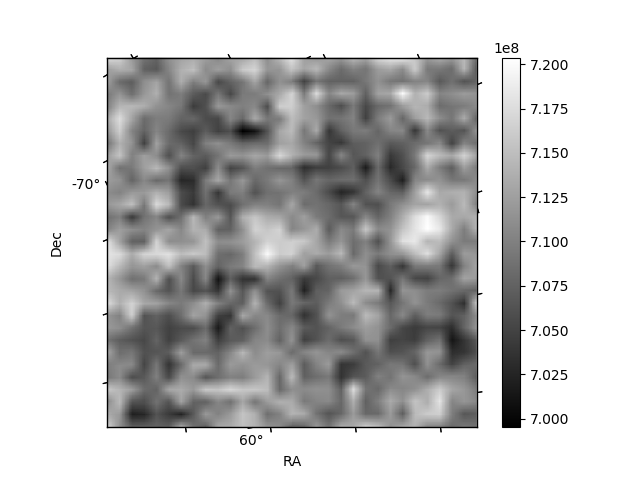
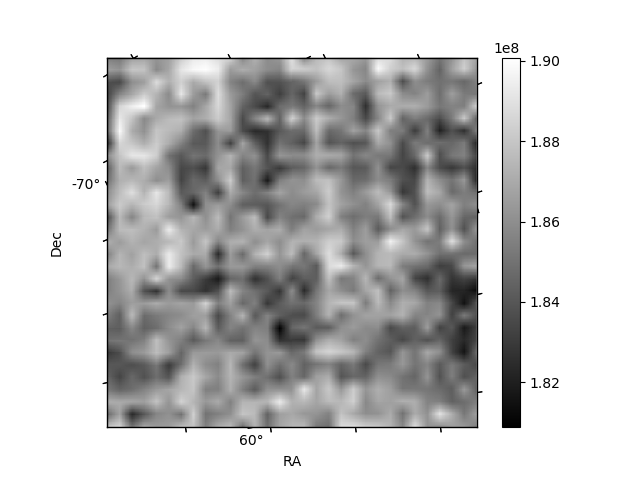
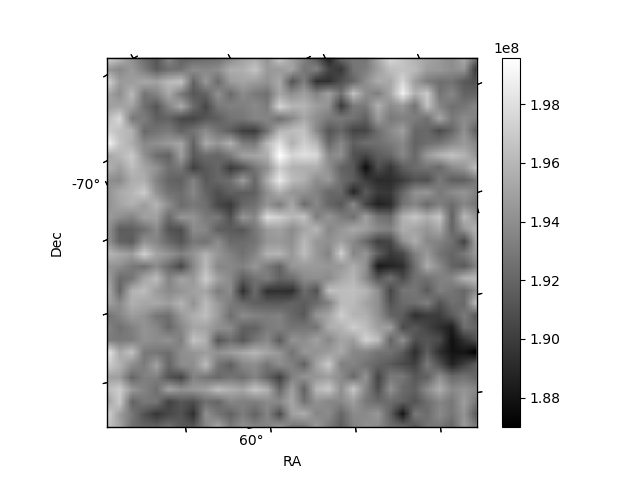
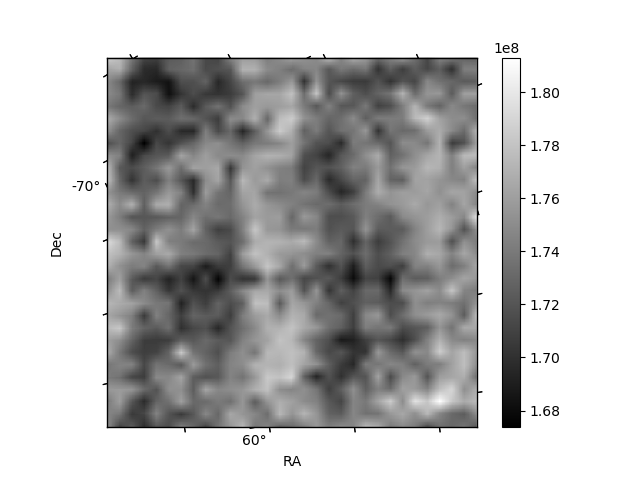
Histogram calculated using DETX and DETY for each event in the final _common_clean file
| Quadrant A | 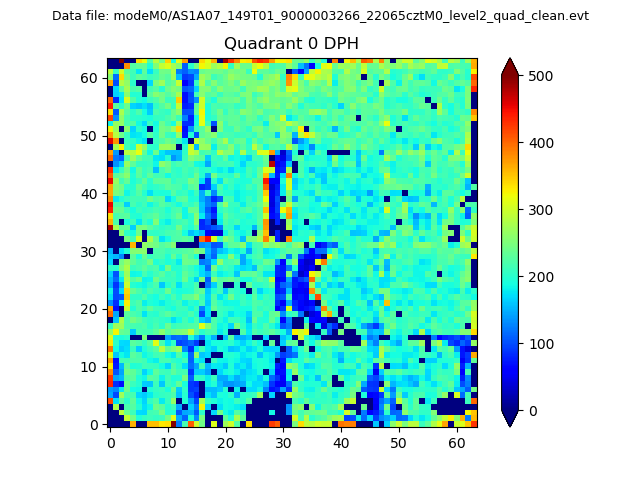 |
 |
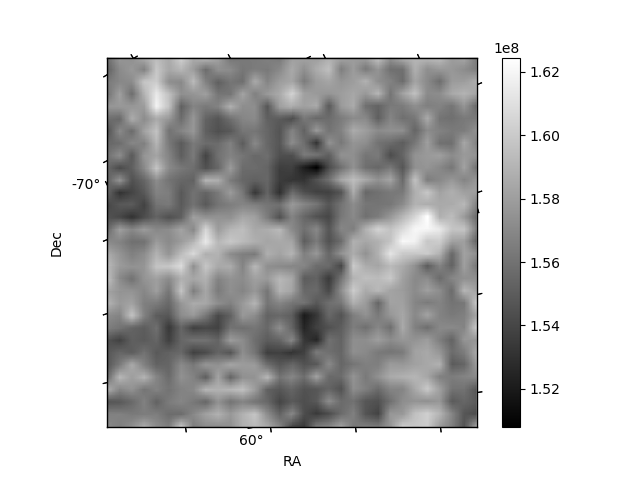
Quadrant B |
|---|---|---|---|
| Quadrant D | 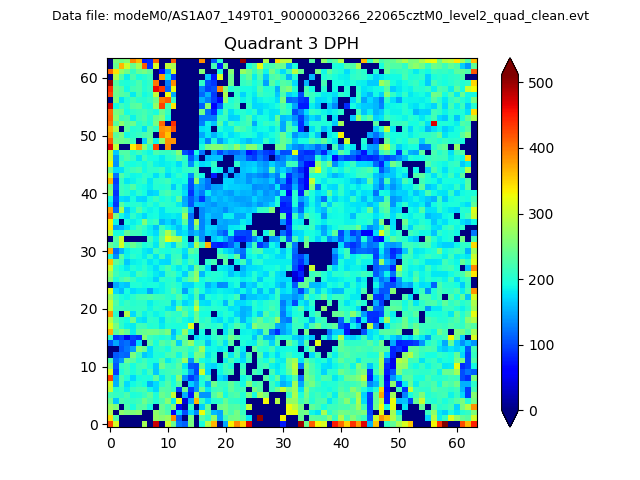 |
 |
Quadrant C |
| Plot type | Count rate plots | Images |
|---|---|---|
| Comparison with Poisson distribution Blue bars denote a histogram of data divided into 1 sec bins. Red curve is a Poisson curve with rate = median count rate of data. |
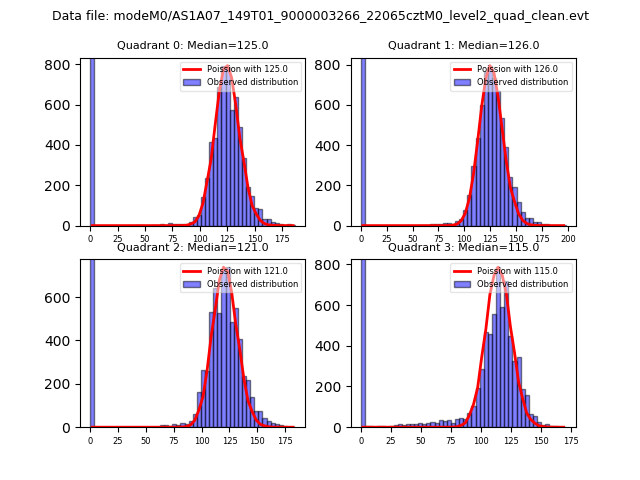 |
 |
| Quadrant-wise count rates Data is divided into 100 sec bins |
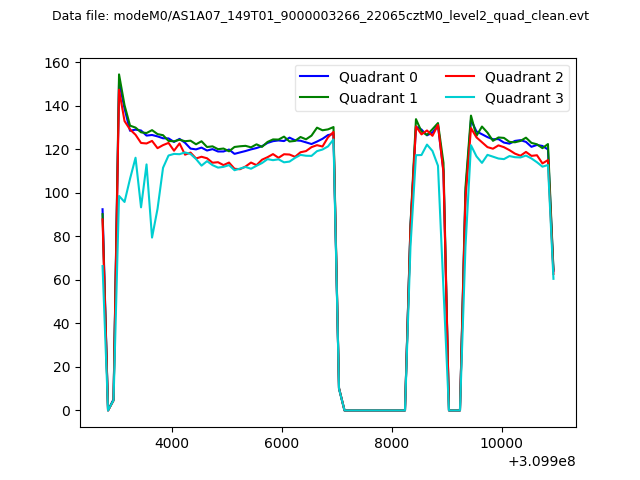 |
|
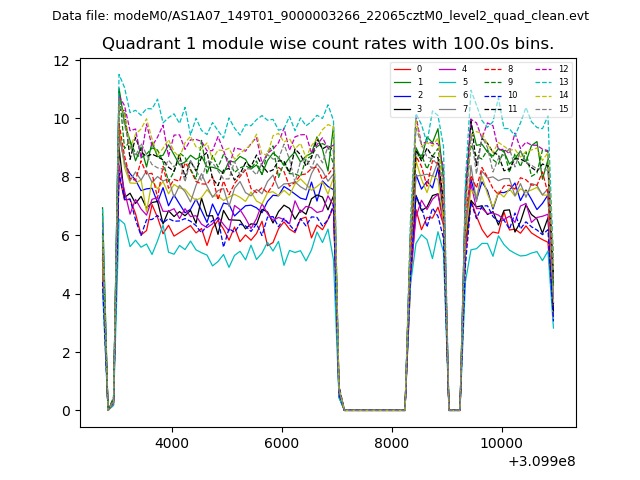
| Module-wise count rates for Quadrant A Data is divided into 100 sec bins |
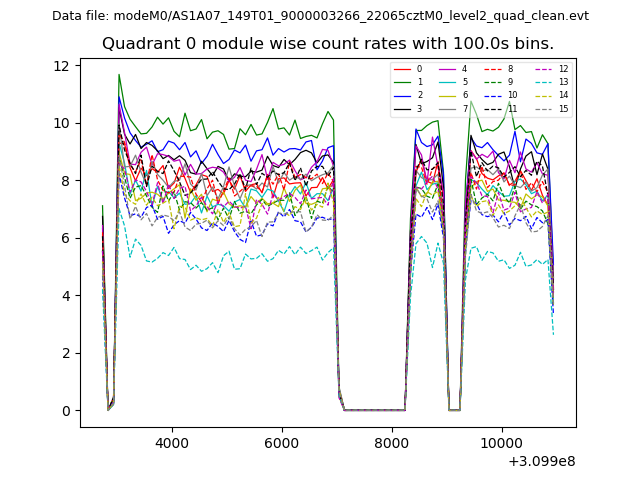 |
 |
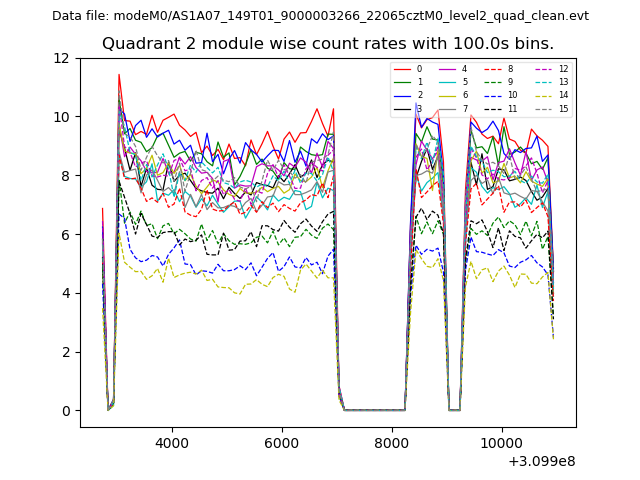
| Module-wise count rates for Quadrant B Data is divided into 100 sec bins |
 |
 |
| Module-wise count rates for Quadrant C Data is divided into 100 sec bins |
 |
 |
| Module-wise count rates for Quadrant D Data is divided into 100 sec bins |
 |
 |
| Parameter | Plot |
|---|---|
| CZT HV Monitor | 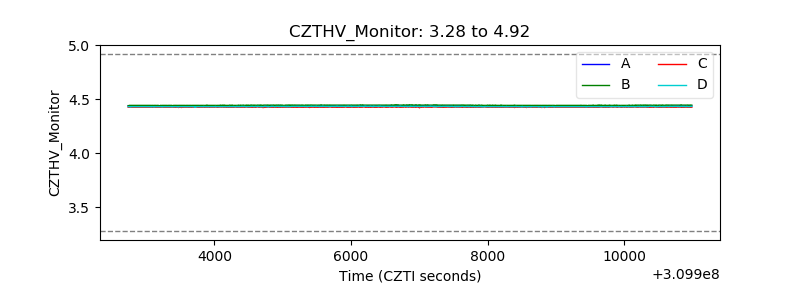 |
| D_VDD | 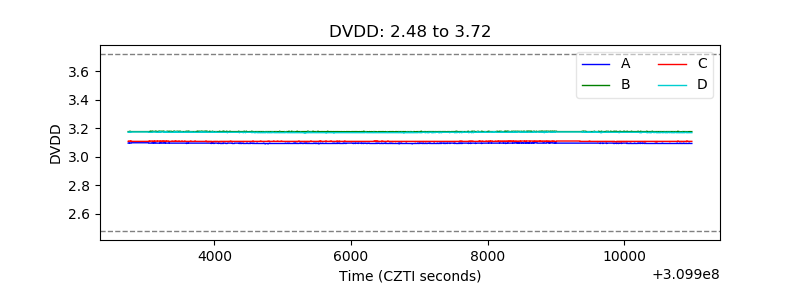 |
| Temperature 1 | 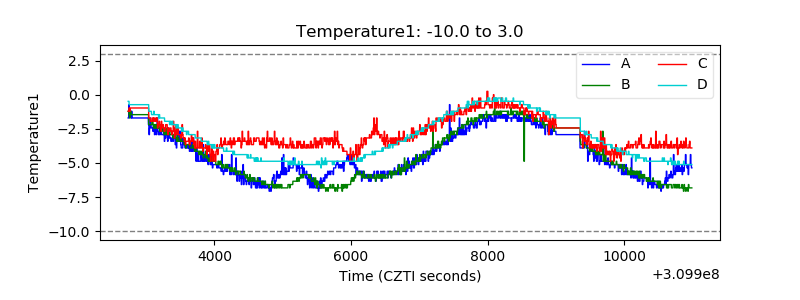 |
| Veto HV Monitor |  |
| Veto LLD |  |
| Alpha Counter | 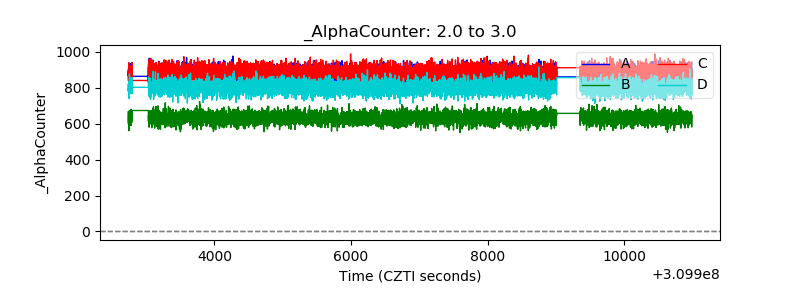 |
| _CPM_Rate | 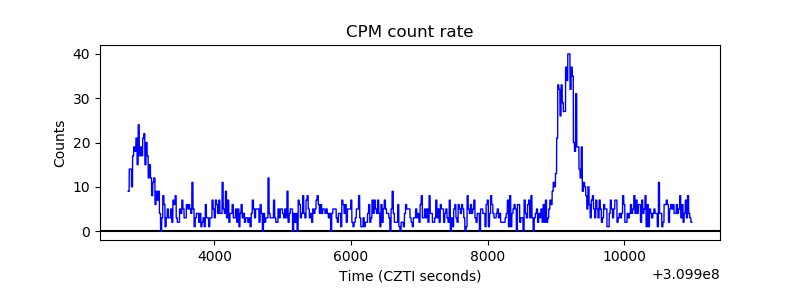 |
| CZT Counter | 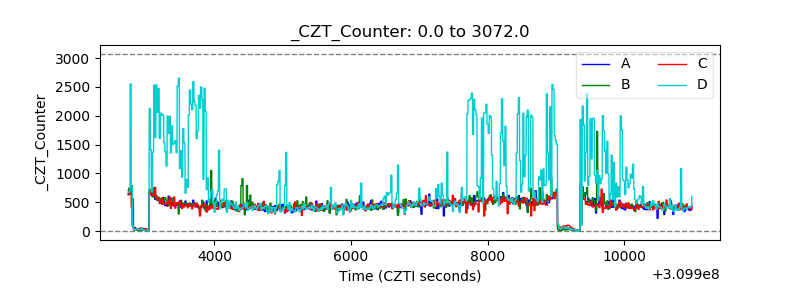 |
| +2.5 Volts monitor |  |
| +5 Volts monitor |  |
| _ROLL_ROT | 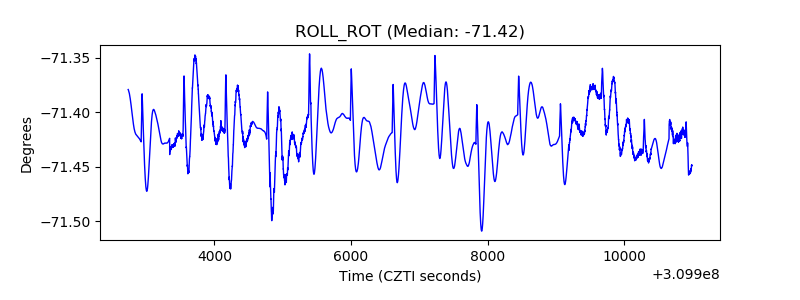 |
| _Roll_DEC | 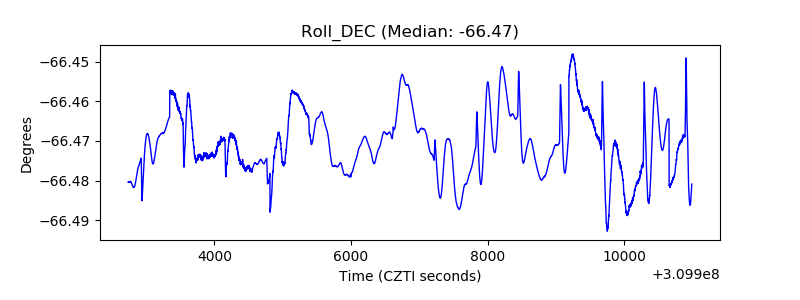 |
| _Roll_RA | 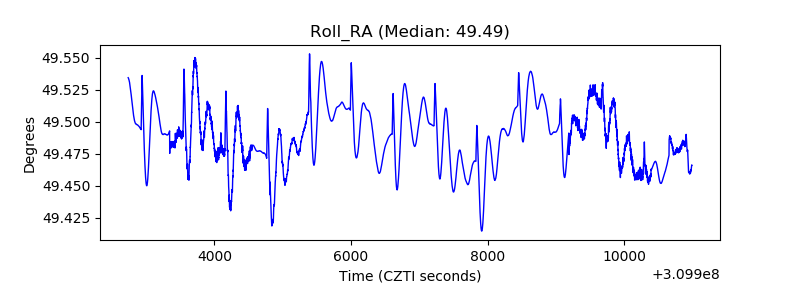 |
| Veto Counter | 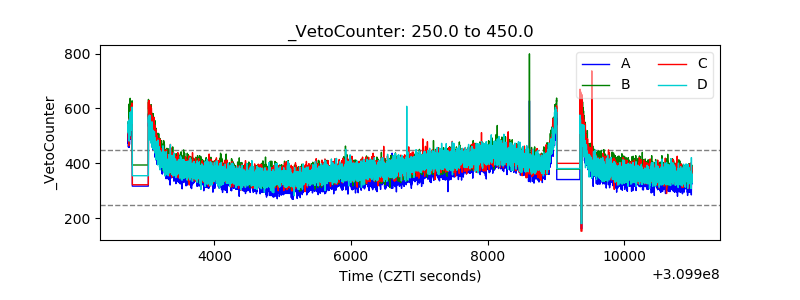 |