| Param | Original file | Final file |
|---|---|---|
| Filename | modeM0/AS1A07_149T01_9000003266_22067cztM0_level2.evt | modeM0/AS1A07_149T01_9000003266_22067cztM0_level2_quad_clean.evt |
| Size (bytes) | 518,572,800 | 109,324,800 |
| Size | 494.5 MB | 104.3 MB |
| Events in quadrant A | 3,282,940 | 723,381 |
| Events in quadrant B | 3,417,007 | 729,540 |
| Events in quadrant C | 3,301,931 | 699,631 |
| Events in quadrant D | 5,221,489 | 664,462 |
| Mode M0 | |||
|---|---|---|---|
| Quadrant | BADHDUFLAG | Total packets | Discarded packets |
| A | 0 | 14478 | 2 |
| B | 0 | 14755 | 2 |
| C | 0 | 14435 | 2 |
| D | 0 | 20547 | 2 |
| Mode SS | |||
|---|---|---|---|
| Quadrant | BADHDUFLAG | Total packets | Discarded packets |
| A | 0 | 146 | 0 |
| B | 0 | 146 | 0 |
| C | 0 | 146 | 0 |
| D | 0 | 146 | 0 |
| Mode M9 | |||
|---|---|---|---|
| Quadrant | BADHDUFLAG | Total packets | Discarded packets |
| A | 0 | 9 | 0 |
| B | 0 | 9 | 0 |
| C | 0 | 9 | 0 |
| D | 0 | 9 | 0 |
| Quadrant | Total seconds | Saturated seconds | Saturation percentage |
|---|---|---|---|
| A | 7091 | 33 | 0.465379% |
| B | 7091 | 66 | 0.930757% |
| C | 7092 | 95 | 1.339538% |
| D | 7092 | 562 | 7.924422% |
Noise dominated data is calculated using 1-second bins in cleaned event files. If a bin has >2000 counts, and if more than 50% of those come from <1% of pixels, then it is considered to be noise-dominated and hence unusable.
| Quadrant | # 1 sec bins | Bins with >0 counts | Bins with >2000 counts | High rate bins dominated by noise | Noise dominated (total time) | Noise dominated (detector-on time) | Marked lightcurve |
|---|---|---|---|---|---|---|---|
| A | 7996 | 7092 | 2 | 2 | 0.03% | 0.03% | 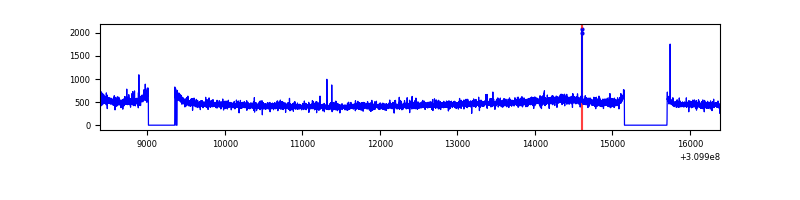 |
| B | 7996 | 7093 | 7 | 7 | 0.09% | 0.10% | 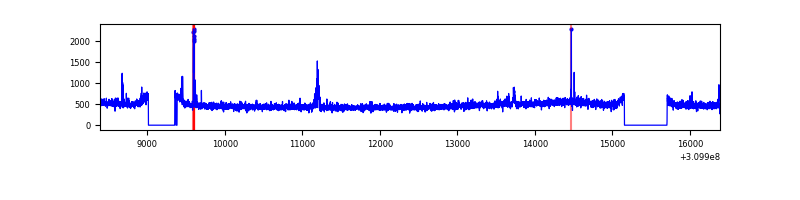 |
| C | 7997 | 7094 | 0 | 0 | 0.00% | 0.00% | 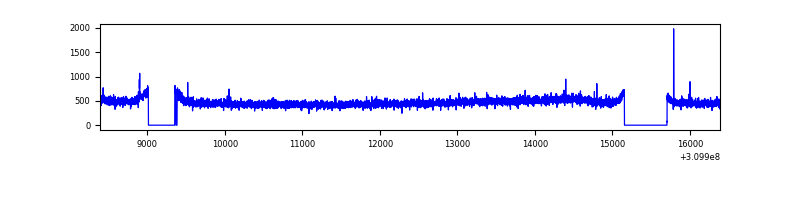 |
| D | 7996 | 7093 | 357 | 357 | 4.46% | 5.03% | 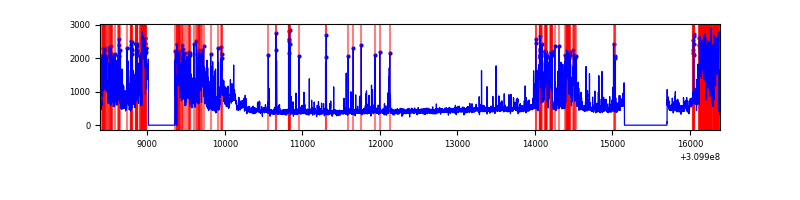 |
Top three noisy pixels from each quadrant. If the there are fewer than three noisy pixels in the level2.evt file, extra rows are filled as -1
| Pixel properties | Quadrant properties | ||||||
|---|---|---|---|---|---|---|---|
| Quadrant | DetID | PixID | Counts | Sigma | Mean | Median | Sigma |
| A | 13 | 254 | 10515 | 56.45 | 848 | 829 | 171.6 |
| A | 0 | 226 | 7251 | 37.43 | 848 | 829 | 171.6 |
| A | 2 | 79 | 7204 | 37.15 | 848 | 829 | 171.6 |
| B | 3 | 64 | 41524 | 251.51 | 845 | 822 | 161.8 |
| B | 0 | 230 | 30381 | 182.66 | 845 | 822 | 161.8 |
| B | 12 | 111 | 19476 | 115.27 | 845 | 822 | 161.8 |
| C | 14 | 238 | 129183 | 674.15 | 811 | 815 | 190.4 |
| C | 13 | 61 | 5647 | 25.38 | 811 | 815 | 190.4 |
| C | 8 | 222 | 5531 | 24.77 | 811 | 815 | 190.4 |
| D | 1 | 52 | 555669 | 2860.59 | 799 | 775 | 194.0 |
| D | 5 | 222 | 470711 | 2422.62 | 799 | 775 | 194.0 |
| D | 12 | 32 | 375319 | 1930.85 | 799 | 775 | 194.0 |
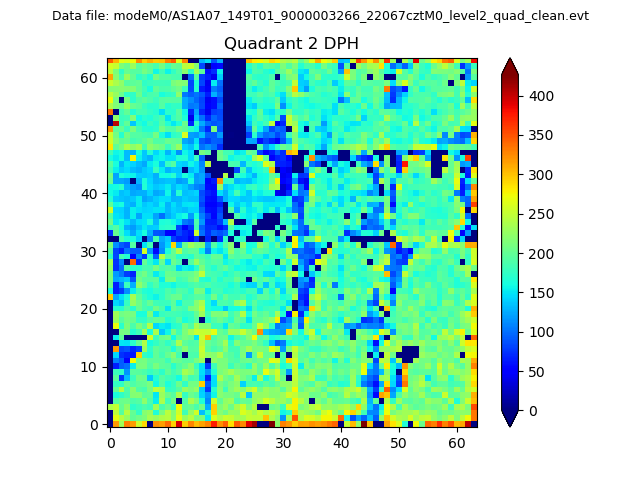
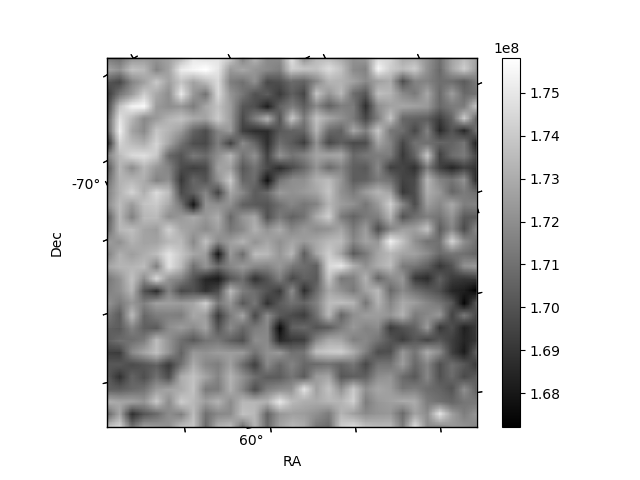
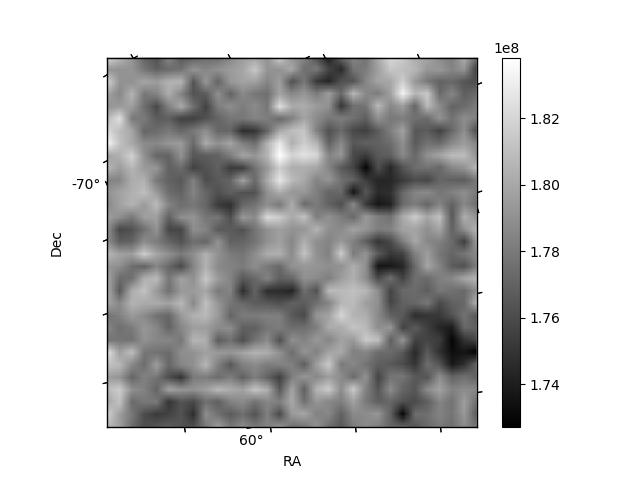
Histogram calculated using DETX and DETY for each event in the final _common_clean file
| Quadrant A |  |
 |
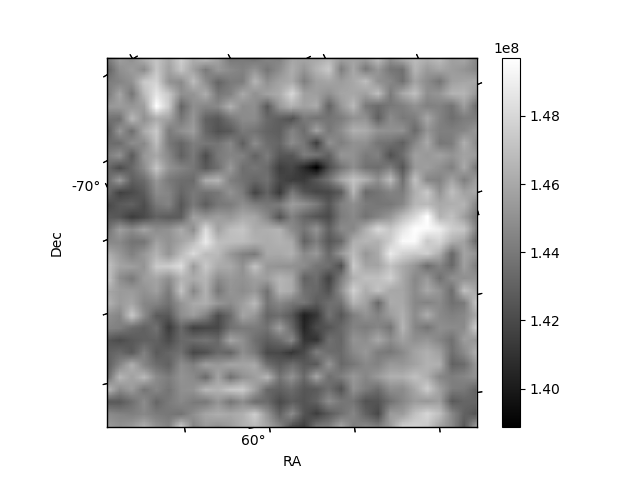
Quadrant B |
|---|---|---|---|
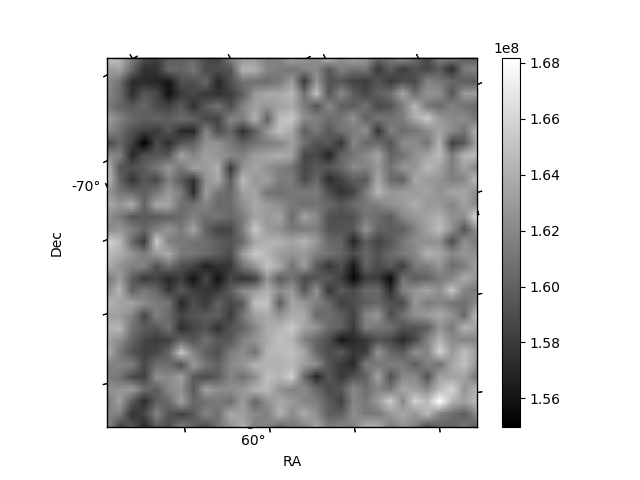
| Quadrant D | 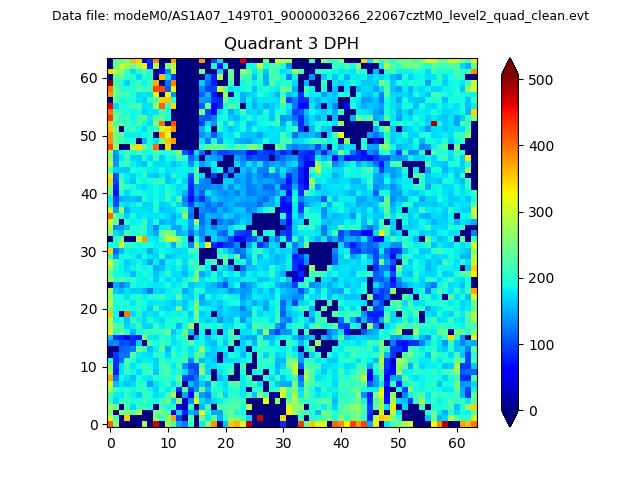 |
 |
Quadrant C |
| Plot type | Count rate plots | Images |
|---|---|---|
| Comparison with Poisson distribution Blue bars denote a histogram of data divided into 1 sec bins. Red curve is a Poisson curve with rate = median count rate of data. |
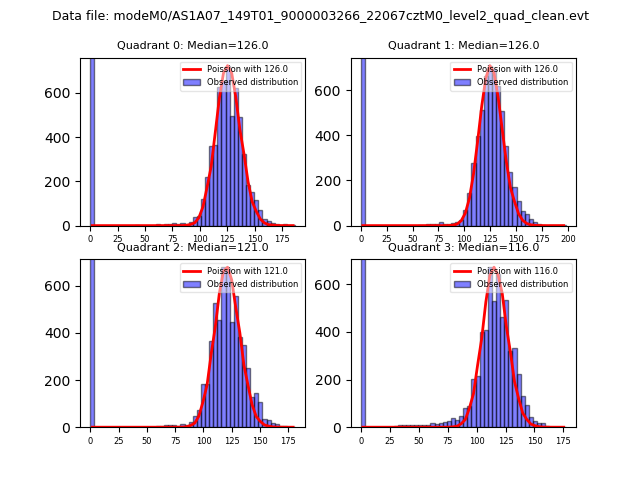 |
 |
| Quadrant-wise count rates Data is divided into 100 sec bins |
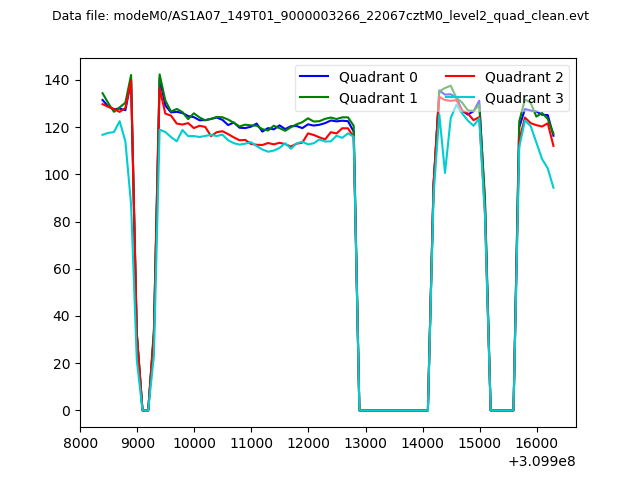 |
|
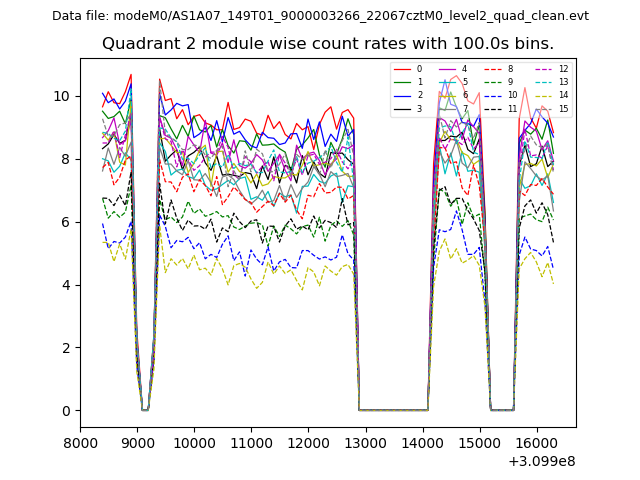
| Module-wise count rates for Quadrant A Data is divided into 100 sec bins |
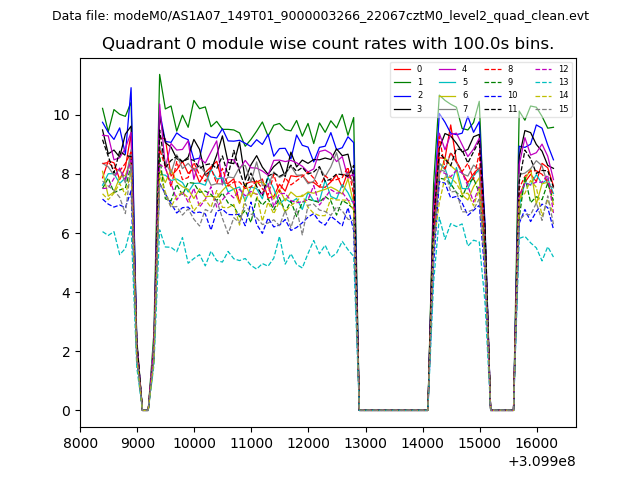 |
 |
| Module-wise count rates for Quadrant B Data is divided into 100 sec bins |
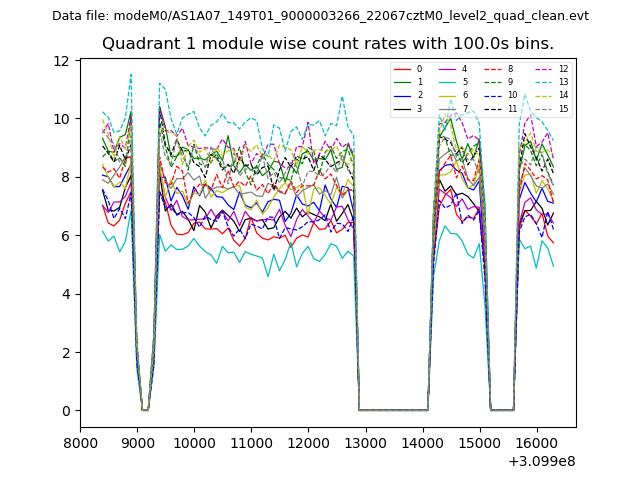 |
 |
| Module-wise count rates for Quadrant C Data is divided into 100 sec bins |
 |
 |
| Module-wise count rates for Quadrant D Data is divided into 100 sec bins |
 |
 |
| Parameter | Plot |
|---|---|
| CZT HV Monitor | 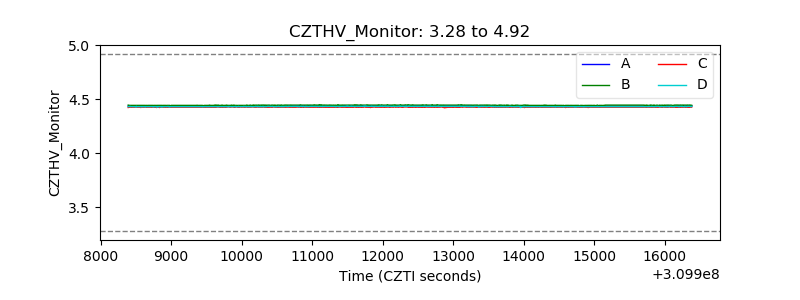 |
| D_VDD |  |
| Temperature 1 | 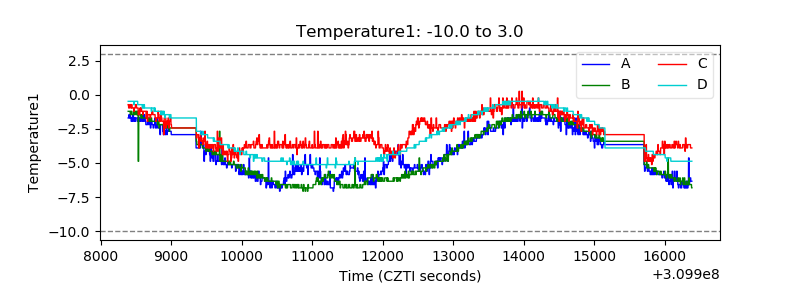 |
| Veto HV Monitor | 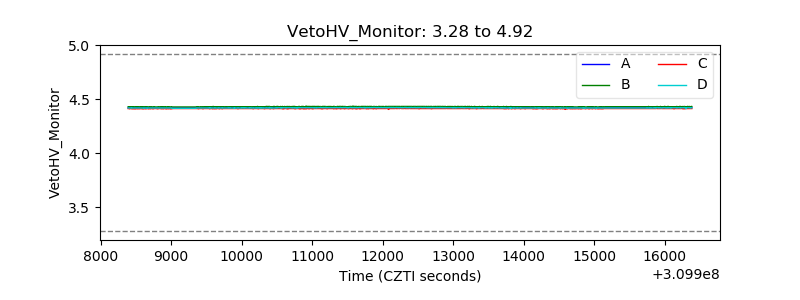 |
| Veto LLD |  |
| Alpha Counter | 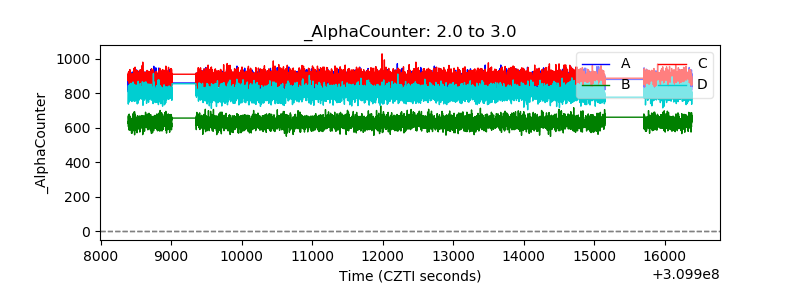 |
| _CPM_Rate | 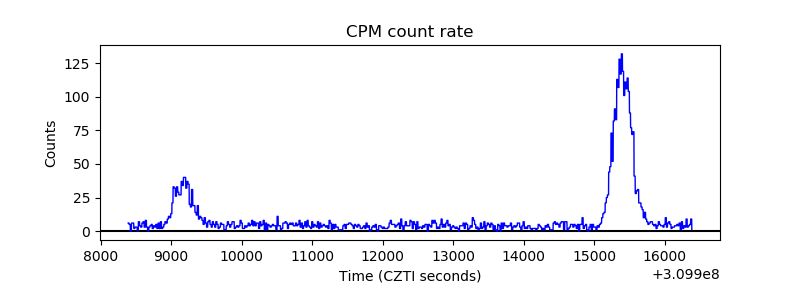 |
| CZT Counter | 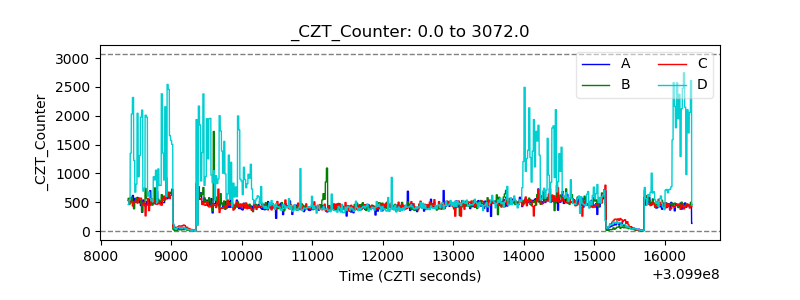 |
| +2.5 Volts monitor |  |
| +5 Volts monitor | 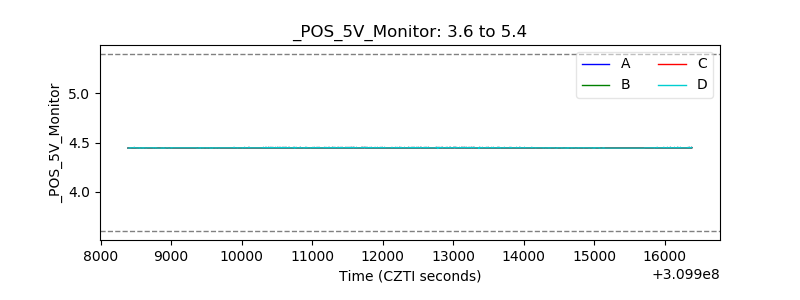 |
| _ROLL_ROT |  |
| _Roll_DEC | 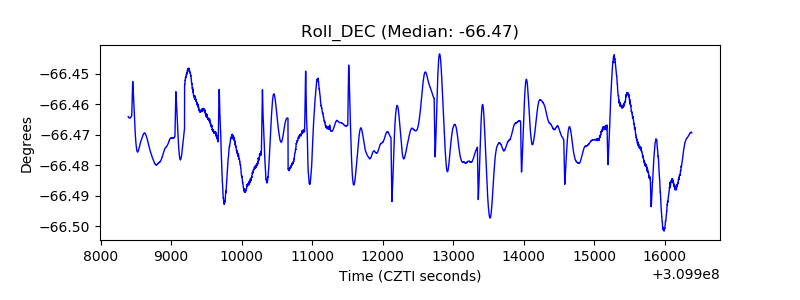 |
| _Roll_RA | 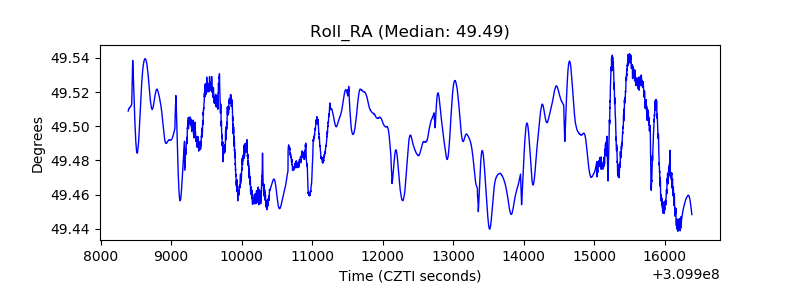 |
| Veto Counter |  |