| Param | Original file | Final file |
|---|---|---|
| Filename | modeM0/AS1A07_138T08_9000003268_22067cztM0_level2.evt | modeM0/AS1A07_138T08_9000003268_22067cztM0_level2_quad_clean.evt |
| Size (bytes) | 403,692,480 | 91,667,520 |
| Size | 385.0 MB | 87.4 MB |
| Events in quadrant A | 2,761,360 | 598,734 |
| Events in quadrant B | 2,857,035 | 608,392 |
| Events in quadrant C | 2,838,555 | 577,728 |
| Events in quadrant D | 3,352,939 | 564,397 |
| Mode SS | |||
|---|---|---|---|
| Quadrant | BADHDUFLAG | Total packets | Discarded packets |
| A | 0 | 124 | 0 |
| B | 0 | 124 | 0 |
| C | 0 | 124 | 0 |
| D | 0 | 124 | 0 |
| Mode M9 | |||
|---|---|---|---|
| Quadrant | BADHDUFLAG | Total packets | Discarded packets |
| A | 0 | 7 | 0 |
| B | 0 | 7 | 0 |
| C | 0 | 7 | 0 |
| D | 0 | 7 | 0 |
| Mode M0 | |||
|---|---|---|---|
| Quadrant | BADHDUFLAG | Total packets | Discarded packets |
| A | 0 | 12319 | 0 |
| B | 0 | 12439 | 0 |
| C | 0 | 12361 | 0 |
| D | 0 | 14193 | 0 |
| Quadrant | Total seconds | Saturated seconds | Saturation percentage |
|---|---|---|---|
| A | 6114 | 12 | 0.196271% |
| B | 6114 | 25 | 0.408898% |
| C | 6114 | 55 | 0.899575% |
| D | 6113 | 76 | 1.243252% |
Noise dominated data is calculated using 1-second bins in cleaned event files. If a bin has >2000 counts, and if more than 50% of those come from <1% of pixels, then it is considered to be noise-dominated and hence unusable.
| Quadrant | # 1 sec bins | Bins with >0 counts | Bins with >2000 counts | High rate bins dominated by noise | Noise dominated (total time) | Noise dominated (detector-on time) | Marked lightcurve |
|---|---|---|---|---|---|---|---|
| A | 6803 | 6114 | 0 | 0 | 0.00% | 0.00% | 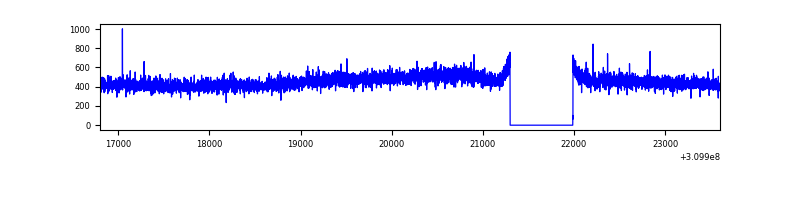 |
| B | 6804 | 6115 | 0 | 0 | 0.00% | 0.00% | 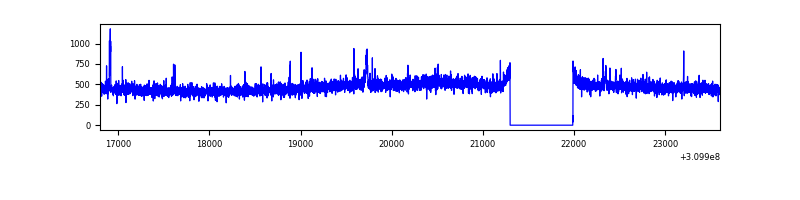 |
| C | 6804 | 6115 | 3 | 3 | 0.04% | 0.05% |  |
| D | 6803 | 6114 | 58 | 58 | 0.85% | 0.95% | 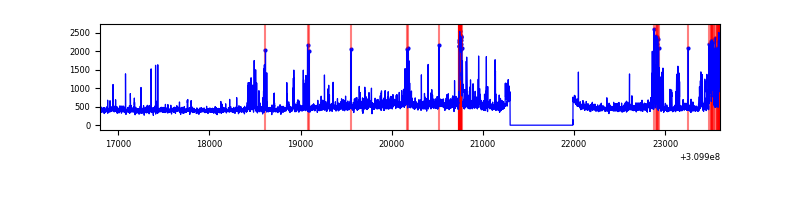 |
Top three noisy pixels from each quadrant. If the there are fewer than three noisy pixels in the level2.evt file, extra rows are filled as -1
| Pixel properties | Quadrant properties | ||||||
|---|---|---|---|---|---|---|---|
| Quadrant | DetID | PixID | Counts | Sigma | Mean | Median | Sigma |
| A | 13 | 254 | 9100 | 57.54 | 715 | 698 | 146.0 |
| A | 3 | 137 | 6125 | 37.17 | 715 | 698 | 146.0 |
| A | 0 | 226 | 6060 | 36.72 | 715 | 698 | 146.0 |
| B | 0 | 230 | 19244 | 135.04 | 717 | 699 | 137.3 |
| B | 12 | 111 | 16481 | 114.92 | 717 | 699 | 137.3 |
| B | 11 | 111 | 14682 | 101.82 | 717 | 699 | 137.3 |
| C | 14 | 238 | 108746 | 663.25 | 695 | 698 | 162.9 |
| C | 10 | 22 | 17133 | 100.89 | 695 | 698 | 162.9 |
| C | 13 | 61 | 4824 | 25.33 | 695 | 698 | 162.9 |
| D | 1 | 52 | 471759 | 2779.38 | 697 | 676 | 169.5 |
| D | 12 | 33 | 160795 | 944.7 | 697 | 676 | 169.5 |
| D | 12 | 32 | 36434 | 210.97 | 697 | 676 | 169.5 |
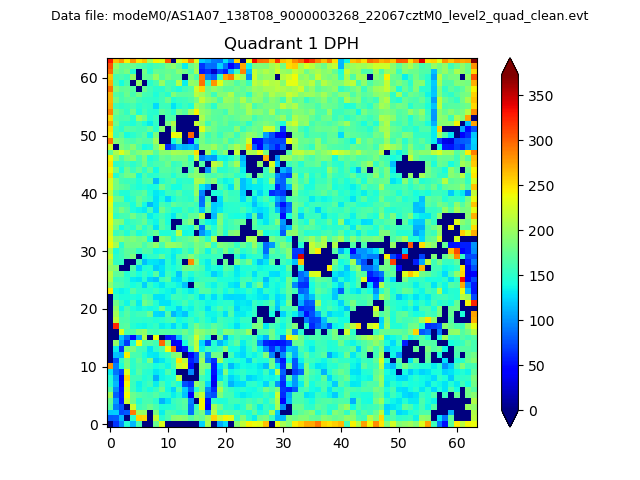
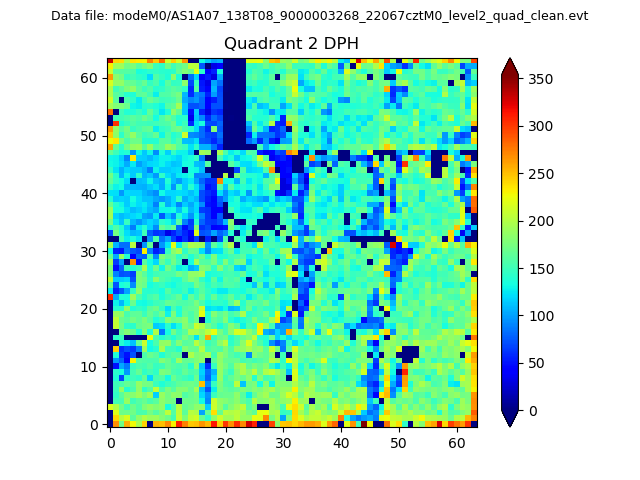
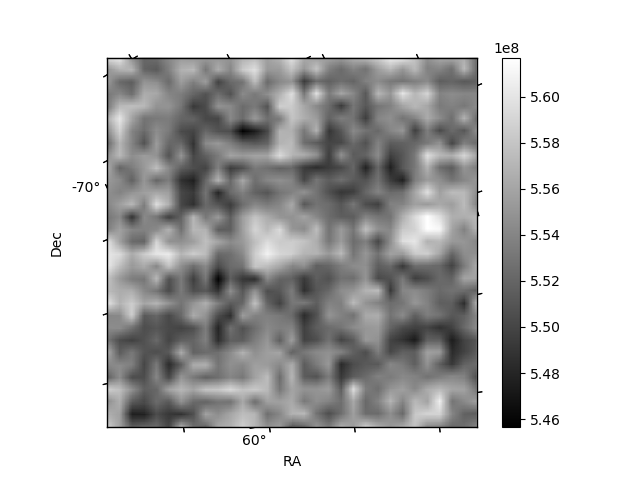
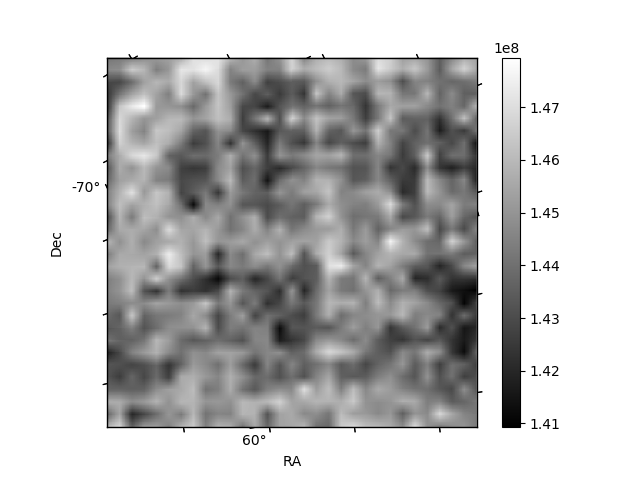
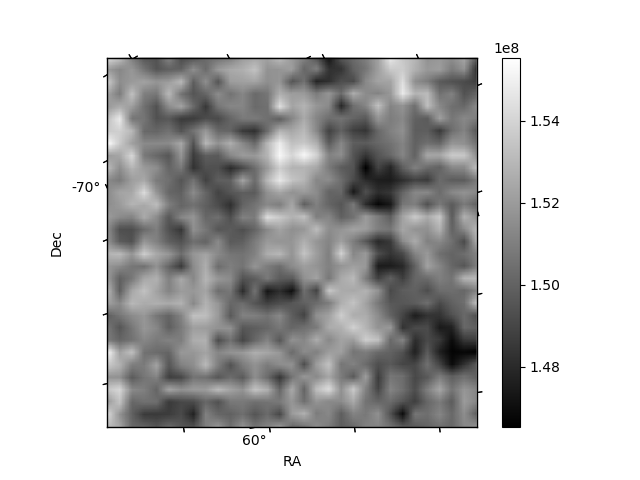
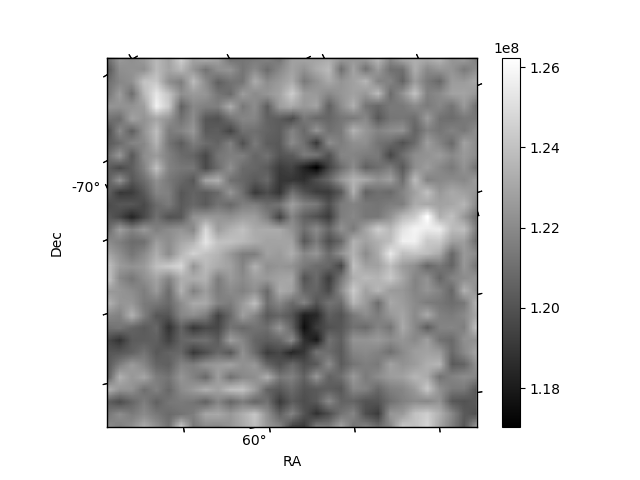
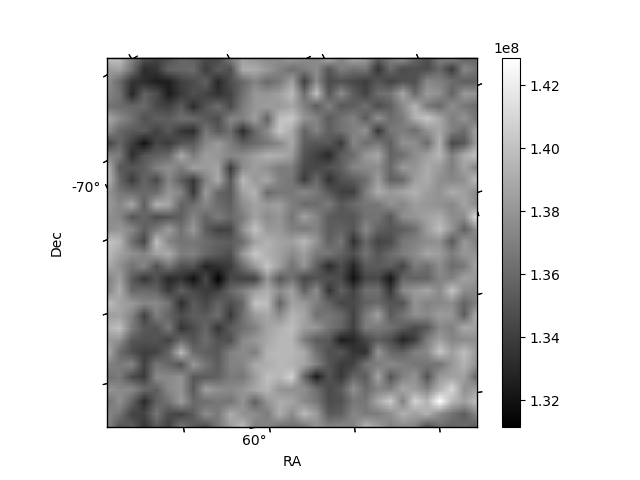
Histogram calculated using DETX and DETY for each event in the final _common_clean file
| Quadrant A | 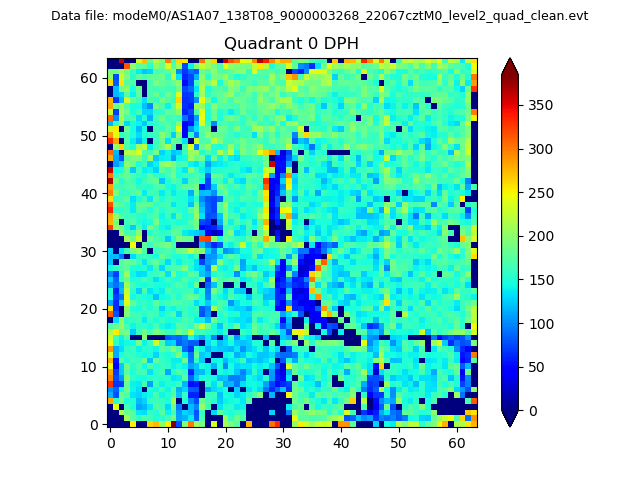 |
 |
Quadrant B |
|---|---|---|---|
| Quadrant D | 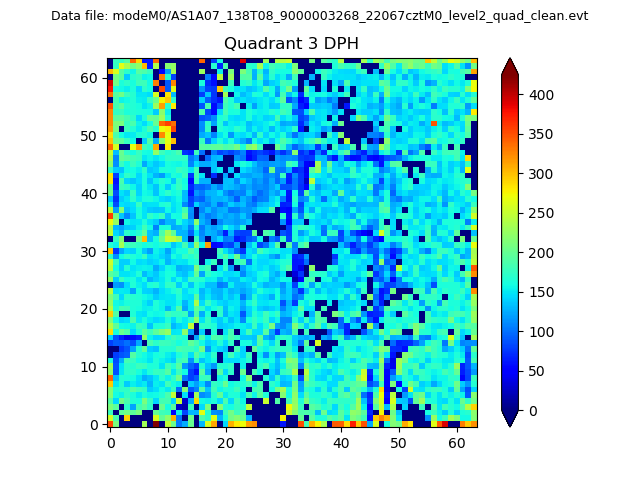 |
 |
Quadrant C |
| Plot type | Count rate plots | Images |
|---|---|---|
| Comparison with Poisson distribution Blue bars denote a histogram of data divided into 1 sec bins. Red curve is a Poisson curve with rate = median count rate of data. |
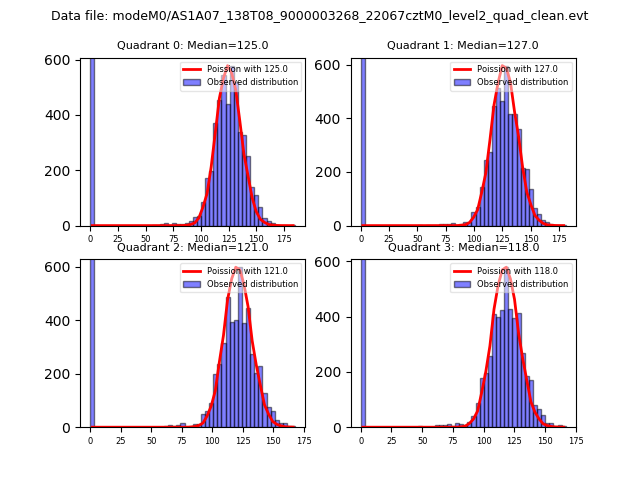 |
 |
| Quadrant-wise count rates Data is divided into 100 sec bins |
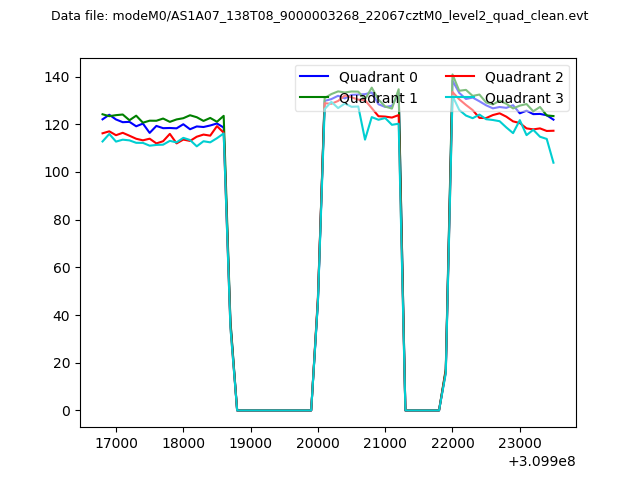 |
|
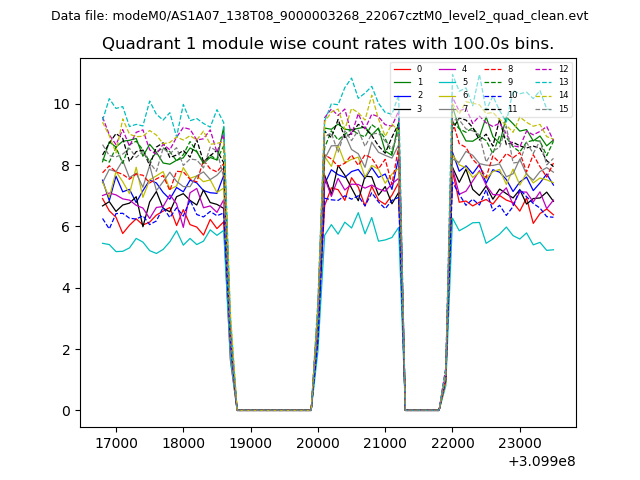
| Module-wise count rates for Quadrant A Data is divided into 100 sec bins |
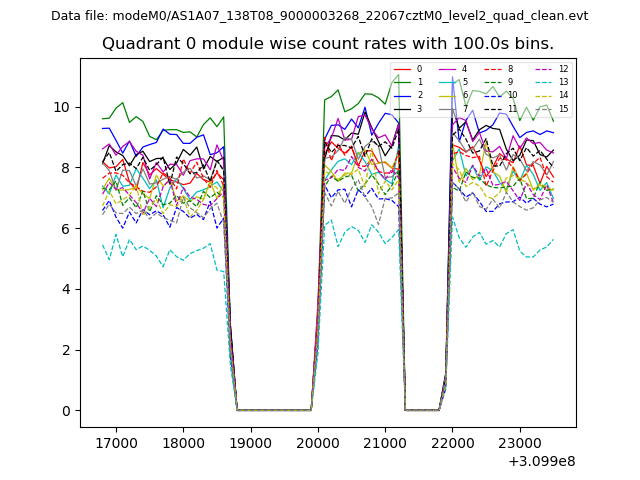 |
 |
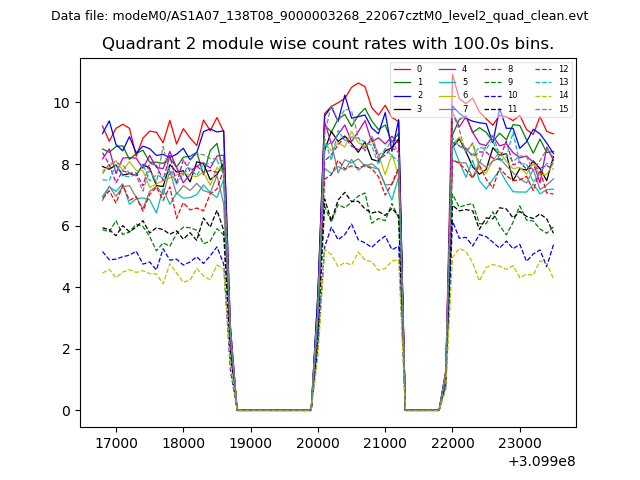
| Module-wise count rates for Quadrant B Data is divided into 100 sec bins |
 |
 |
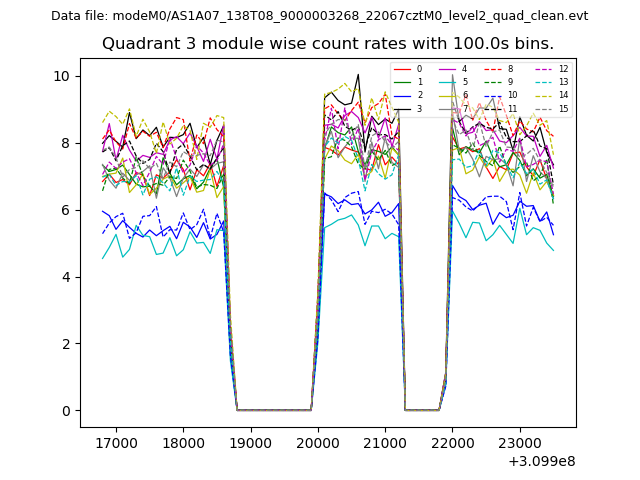
| Module-wise count rates for Quadrant C Data is divided into 100 sec bins |
 |
 |
| Module-wise count rates for Quadrant D Data is divided into 100 sec bins |
 |
 |
| Parameter | Plot |
|---|---|
| CZT HV Monitor | 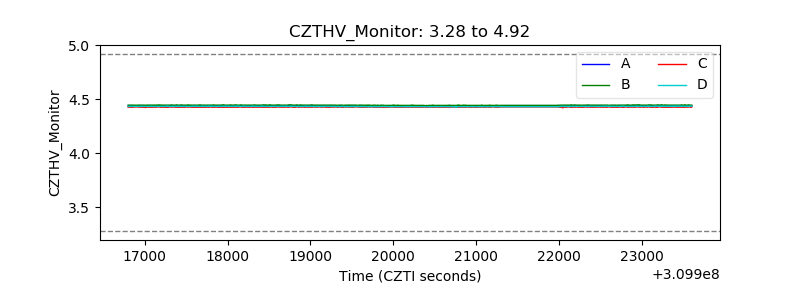 |
| D_VDD | 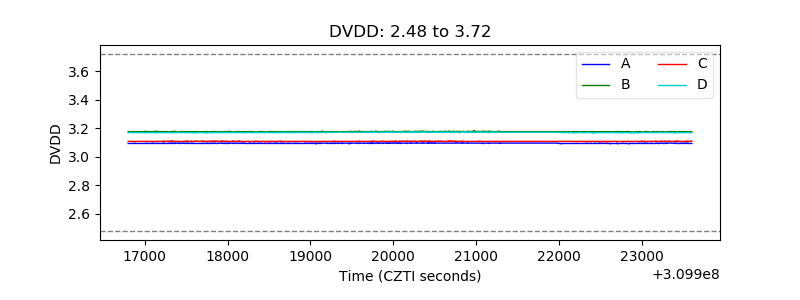 |
| Temperature 1 | 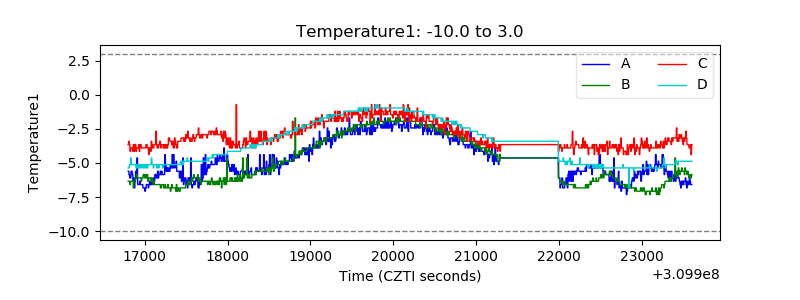 |
| Veto HV Monitor | 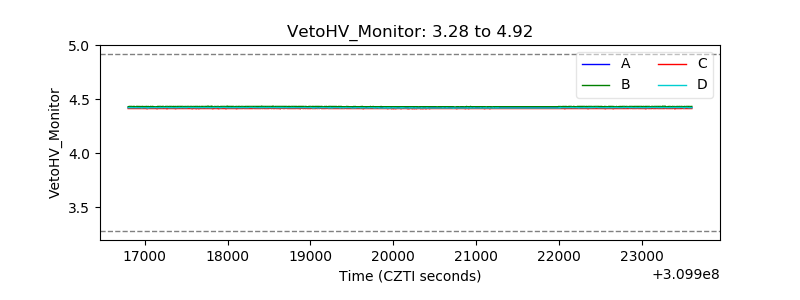 |
| Veto LLD | 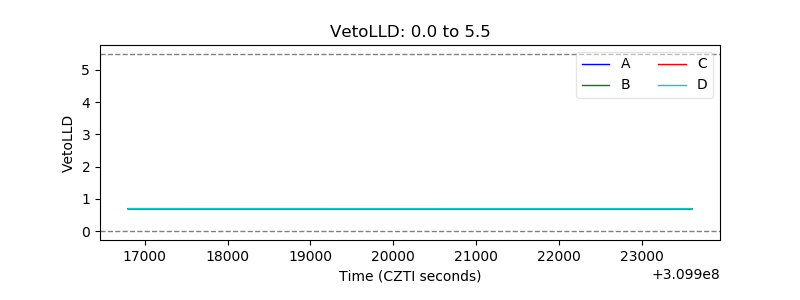 |
| Alpha Counter | 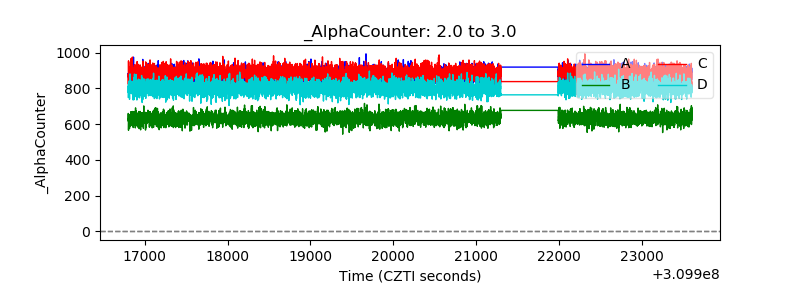 |
| _CPM_Rate | 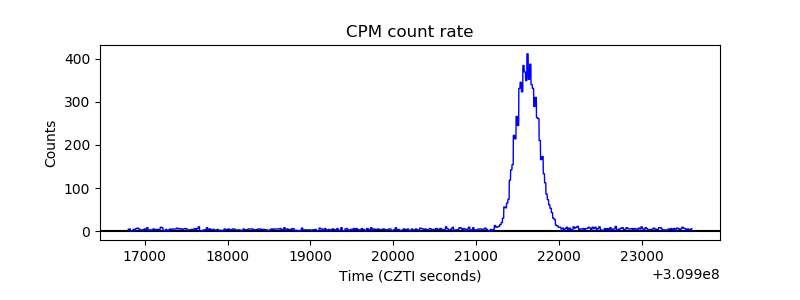 |
| CZT Counter | 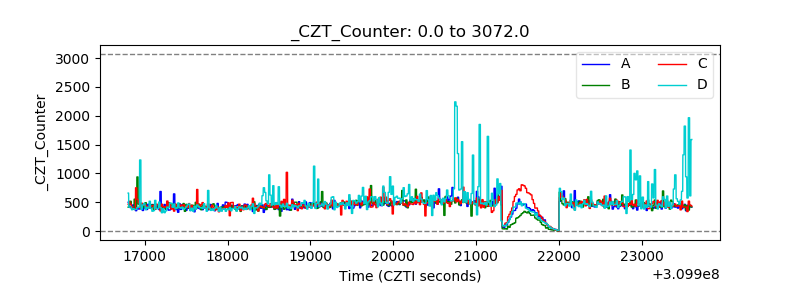 |
| +2.5 Volts monitor |  |
| +5 Volts monitor |  |
| _ROLL_ROT | 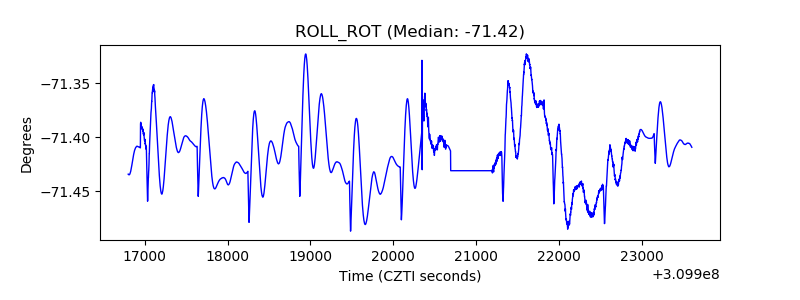 |
| _Roll_DEC | 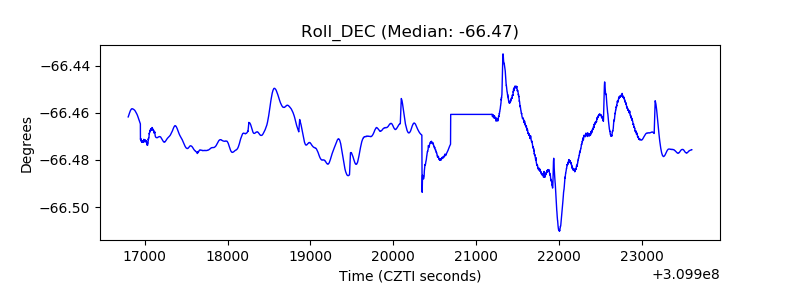 |
| _Roll_RA | 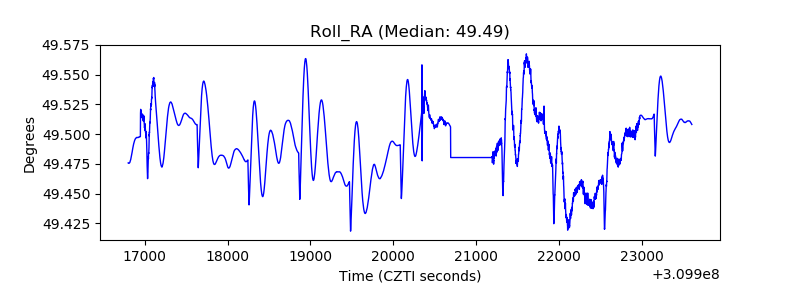 |
| Veto Counter | 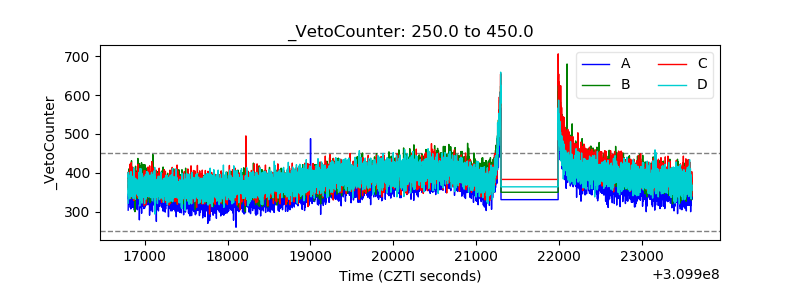 |