| Param | Original file | Final file |
|---|---|---|
| Filename | modeM0/AS1A07_138T08_9000003268_22069cztM0_level2.evt | modeM0/AS1A07_138T08_9000003268_22069cztM0_level2_quad_clean.evt |
| Size (bytes) | 414,460,800 | 99,334,080 |
| Size | 395.3 MB | 94.7 MB |
| Events in quadrant A | 2,886,886 | 653,403 |
| Events in quadrant B | 2,955,215 | 665,252 |
| Events in quadrant C | 3,164,305 | 634,891 |
| Events in quadrant D | 3,126,542 | 624,708 |
| Mode SS | |||
|---|---|---|---|
| Quadrant | BADHDUFLAG | Total packets | Discarded packets |
| A | 0 | 126 | 0 |
| B | 0 | 126 | 0 |
| C | 0 | 126 | 0 |
| D | 0 | 126 | 0 |
| Mode M9 | |||
|---|---|---|---|
| Quadrant | BADHDUFLAG | Total packets | Discarded packets |
| A | 0 | 10 | 0 |
| B | 0 | 10 | 0 |
| C | 0 | 10 | 0 |
| D | 0 | 10 | 0 |
| Mode M0 | |||
|---|---|---|---|
| Quadrant | BADHDUFLAG | Total packets | Discarded packets |
| A | 0 | 12532 | 0 |
| B | 0 | 12689 | 0 |
| C | 0 | 13321 | 0 |
| D | 0 | 13400 | 0 |
| Quadrant | Total seconds | Saturated seconds | Saturation percentage |
|---|---|---|---|
| A | 6160 | 26 | 0.422078% |
| B | 6160 | 38 | 0.616883% |
| C | 6160 | 74 | 1.201299% |
| D | 6160 | 33 | 0.535714% |
Noise dominated data is calculated using 1-second bins in cleaned event files. If a bin has >2000 counts, and if more than 50% of those come from <1% of pixels, then it is considered to be noise-dominated and hence unusable.
| Quadrant | # 1 sec bins | Bins with >0 counts | Bins with >2000 counts | High rate bins dominated by noise | Noise dominated (total time) | Noise dominated (detector-on time) | Marked lightcurve |
|---|---|---|---|---|---|---|---|
| A | 7160 | 6161 | 0 | 0 | 0.00% | 0.00% | 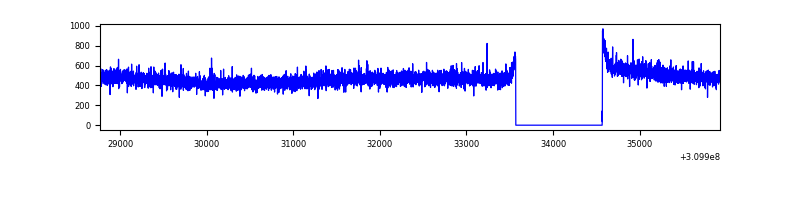 |
| B | 7160 | 6161 | 1 | 1 | 0.01% | 0.02% | 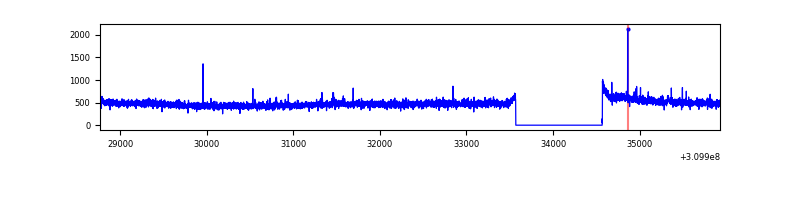 |
| C | 7160 | 6161 | 0 | 0 | 0.00% | 0.00% | 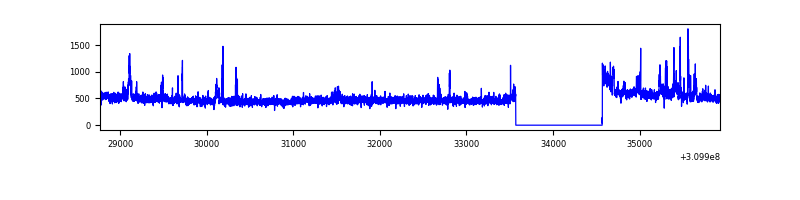 |
| D | 7160 | 6161 | 21 | 21 | 0.29% | 0.34% | 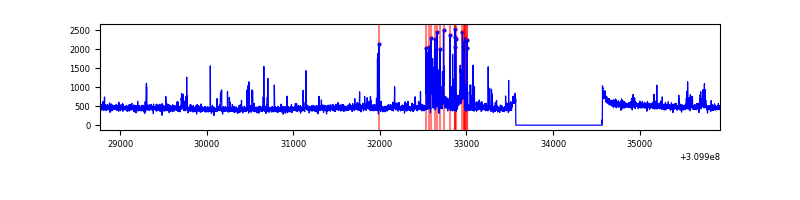 |
Top three noisy pixels from each quadrant. If the there are fewer than three noisy pixels in the level2.evt file, extra rows are filled as -1
| Pixel properties | Quadrant properties | ||||||
|---|---|---|---|---|---|---|---|
| Quadrant | DetID | PixID | Counts | Sigma | Mean | Median | Sigma |
| A | 13 | 254 | 9292 | 56.73 | 748 | 733 | 150.9 |
| A | 3 | 137 | 6259 | 36.63 | 748 | 733 | 150.9 |
| A | 0 | 226 | 6171 | 36.04 | 748 | 733 | 150.9 |
| B | 12 | 111 | 16982 | 115.24 | 747 | 730 | 141.0 |
| B | 11 | 111 | 14979 | 101.03 | 747 | 730 | 141.0 |
| B | 14 | 111 | 13110 | 87.78 | 747 | 730 | 141.0 |
| C | 9 | 54 | 192725 | 1136.32 | 729 | 734 | 169.0 |
| C | 14 | 238 | 117398 | 690.49 | 729 | 734 | 169.0 |
| C | 10 | 22 | 11151 | 61.65 | 729 | 734 | 169.0 |
| D | 1 | 52 | 296623 | 1659.8 | 735 | 713 | 178.3 |
| D | 13 | 172 | 28838 | 157.76 | 735 | 713 | 178.3 |
| D | 2 | 234 | 24424 | 133.0 | 735 | 713 | 178.3 |
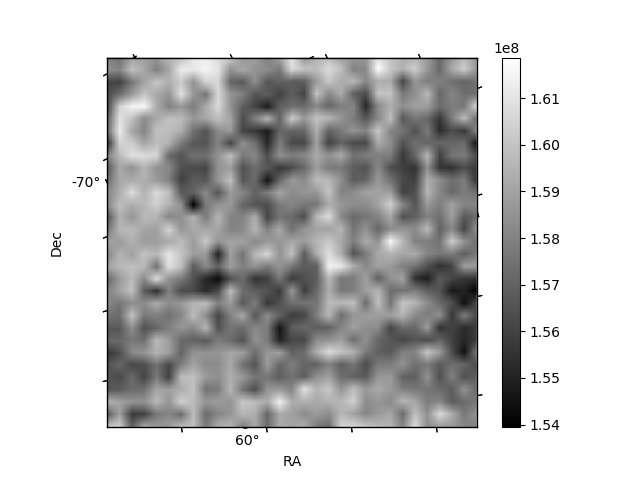
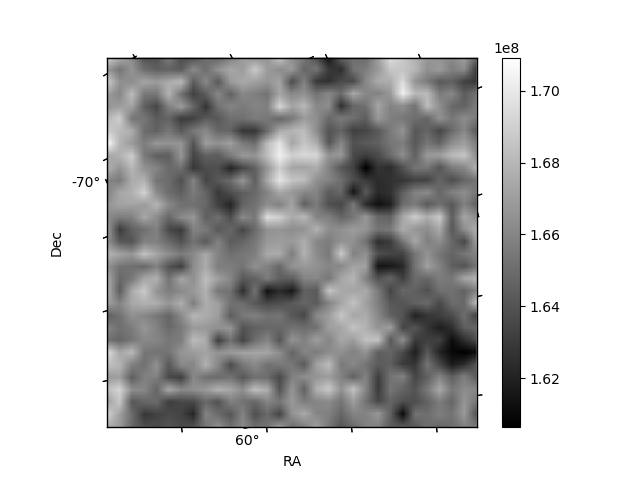
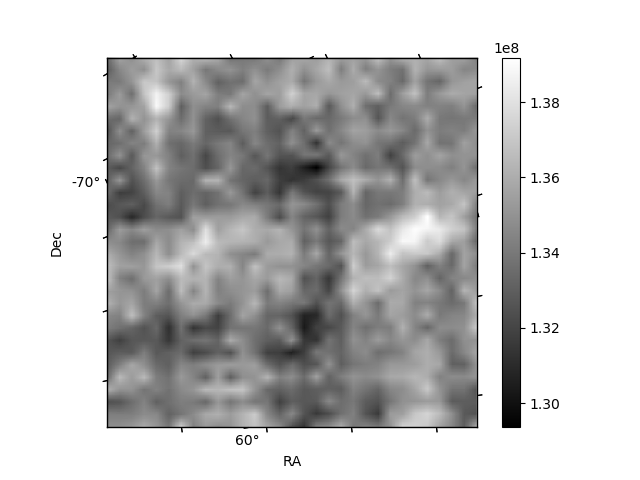
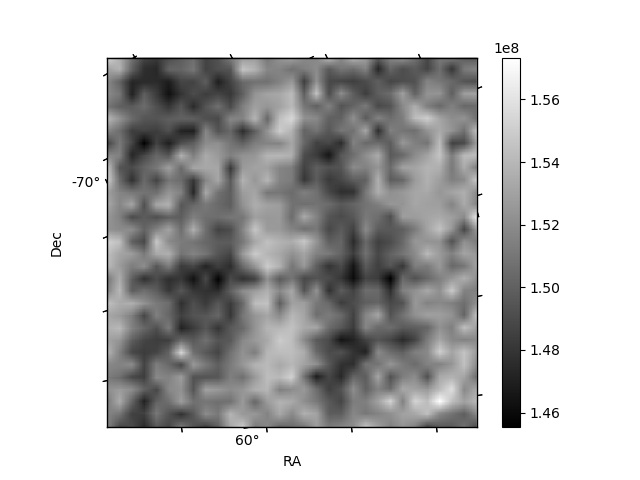
Histogram calculated using DETX and DETY for each event in the final _common_clean file
| Quadrant A |  |
 |
Quadrant B |
|---|---|---|---|
| Quadrant D |  |
 |
Quadrant C |
| Plot type | Count rate plots | Images |
|---|---|---|
| Comparison with Poisson distribution Blue bars denote a histogram of data divided into 1 sec bins. Red curve is a Poisson curve with rate = median count rate of data. |
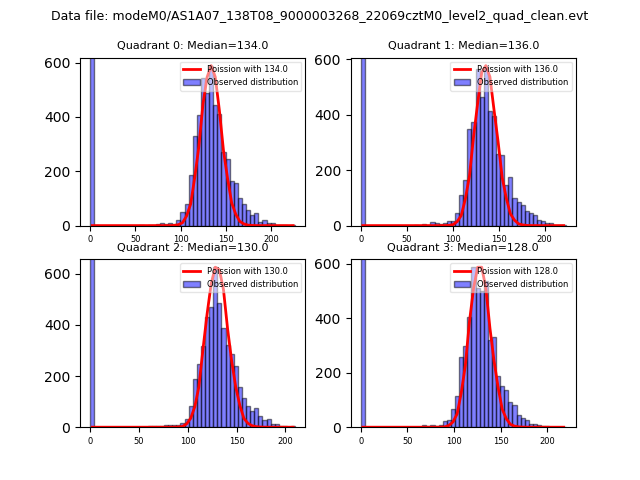 |
 |
| Quadrant-wise count rates Data is divided into 100 sec bins |
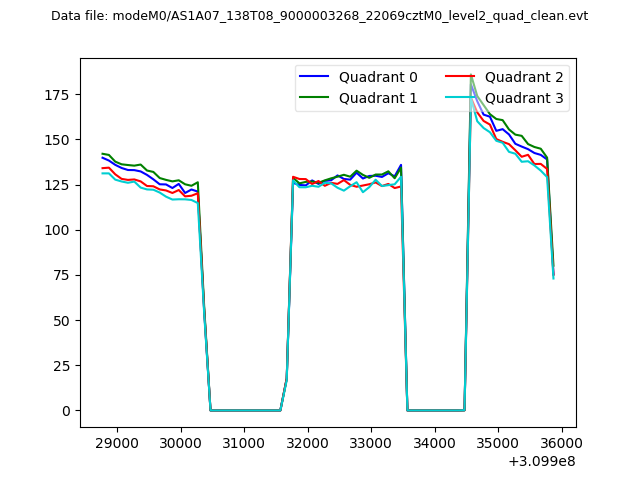 |
|
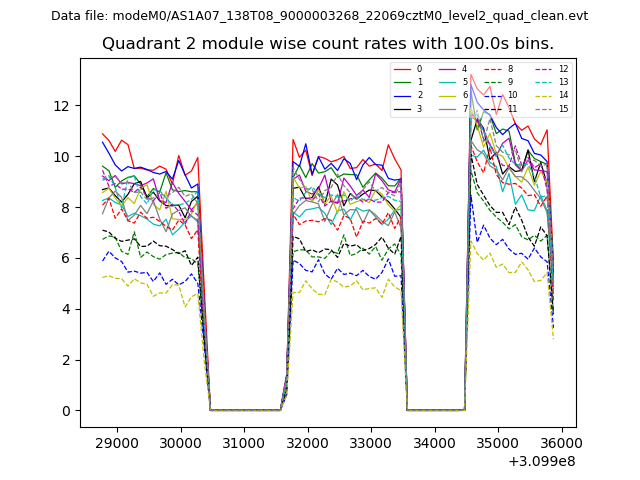
| Module-wise count rates for Quadrant A Data is divided into 100 sec bins |
 |
 |
| Module-wise count rates for Quadrant B Data is divided into 100 sec bins |
 |
 |
| Module-wise count rates for Quadrant C Data is divided into 100 sec bins |
 |
 |
| Module-wise count rates for Quadrant D Data is divided into 100 sec bins |
 |
 |
| Parameter | Plot |
|---|---|
| CZT HV Monitor |  |
| D_VDD |  |
| Temperature 1 |  |
| Veto HV Monitor |  |
| Veto LLD |  |
| Alpha Counter | 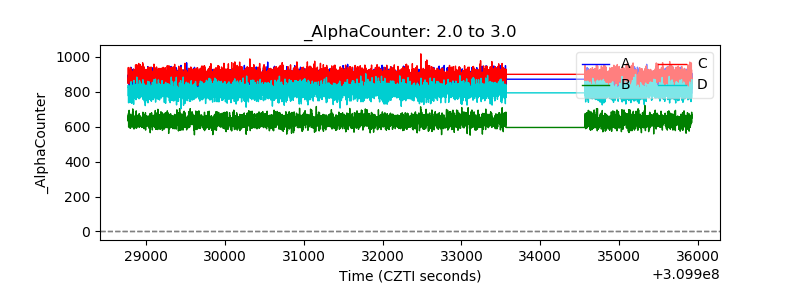 |
| _CPM_Rate | 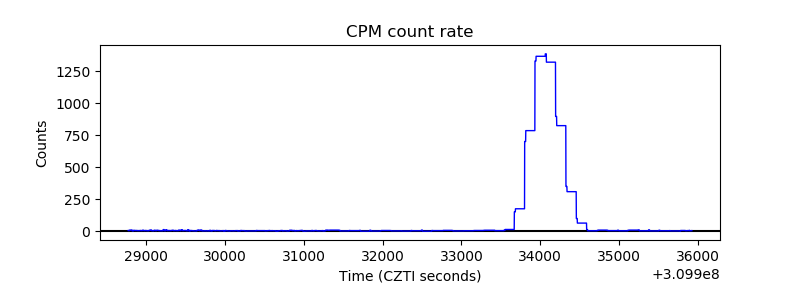 |
| CZT Counter |  |
| +2.5 Volts monitor |  |
| +5 Volts monitor |  |
| _ROLL_ROT |  |
| _Roll_DEC |  |
| _Roll_RA |  |
| Veto Counter |  |