| Param | Original file | Final file |
|---|---|---|
| Filename | modeM0/AS1A07_138T08_9000003268_22071cztM0_level2.evt | modeM0/AS1A07_138T08_9000003268_22071cztM0_level2_quad_clean.evt |
| Size (bytes) | 449,049,600 | 112,161,600 |
| Size | 428.2 MB | 107.0 MB |
| Events in quadrant A | 3,191,635 | 745,369 |
| Events in quadrant B | 3,278,466 | 760,253 |
| Events in quadrant C | 3,446,186 | 727,211 |
| Events in quadrant D | 3,244,236 | 713,684 |
| Mode SS | |||
|---|---|---|---|
| Quadrant | BADHDUFLAG | Total packets | Discarded packets |
| A | 0 | 132 | 0 |
| B | 0 | 132 | 0 |
| C | 0 | 132 | 0 |
| D | 0 | 132 | 0 |
| Mode M9 | |||
|---|---|---|---|
| Quadrant | BADHDUFLAG | Total packets | Discarded packets |
| A | 0 | 13 | 0 |
| B | 0 | 14 | 0 |
| C | 0 | 14 | 0 |
| D | 0 | 14 | 0 |
| Mode M0 | |||
|---|---|---|---|
| Quadrant | BADHDUFLAG | Total packets | Discarded packets |
| A | 0 | 13527 | 0 |
| B | 0 | 13811 | 0 |
| C | 0 | 14382 | 0 |
| D | 0 | 13865 | 0 |
| Quadrant | Total seconds | Saturated seconds | Saturation percentage |
|---|---|---|---|
| A | 6456 | 57 | 0.882900% |
| B | 6456 | 62 | 0.960347% |
| C | 6456 | 116 | 1.796778% |
| D | 6456 | 38 | 0.588600% |
Noise dominated data is calculated using 1-second bins in cleaned event files. If a bin has >2000 counts, and if more than 50% of those come from <1% of pixels, then it is considered to be noise-dominated and hence unusable.
| Quadrant | # 1 sec bins | Bins with >0 counts | Bins with >2000 counts | High rate bins dominated by noise | Noise dominated (total time) | Noise dominated (detector-on time) | Marked lightcurve |
|---|---|---|---|---|---|---|---|
| A | 7576 | 6457 | 0 | 0 | 0.00% | 0.00% | 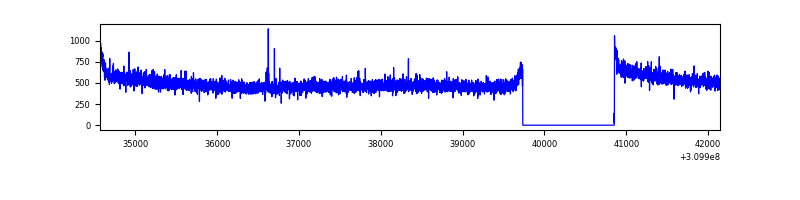 |
| B | 7576 | 6457 | 4 | 4 | 0.05% | 0.06% | 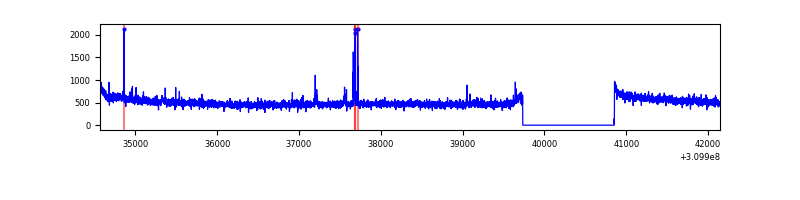 |
| C | 7576 | 6457 | 0 | 0 | 0.00% | 0.00% | 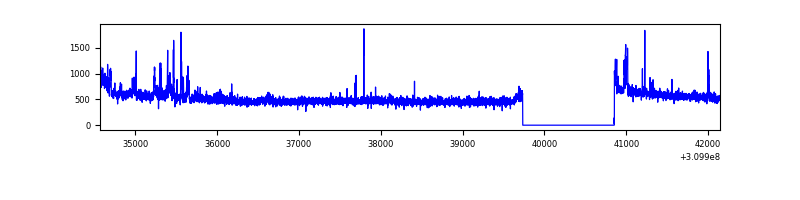 |
| D | 7576 | 6457 | 3 | 3 | 0.04% | 0.05% | 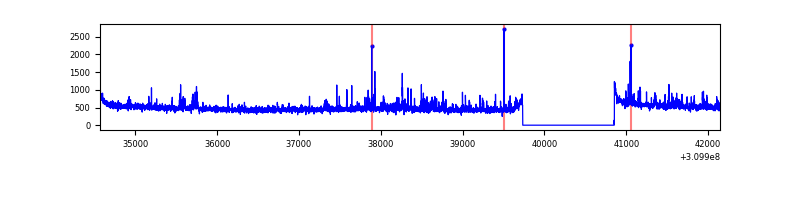 |
Top three noisy pixels from each quadrant. If the there are fewer than three noisy pixels in the level2.evt file, extra rows are filled as -1
| Pixel properties | Quadrant properties | ||||||
|---|---|---|---|---|---|---|---|
| Quadrant | DetID | PixID | Counts | Sigma | Mean | Median | Sigma |
| A | 13 | 254 | 9501 | 53.14 | 826 | 810 | 163.5 |
| A | 15 | 174 | 7693 | 42.09 | 826 | 810 | 163.5 |
| A | 0 | 226 | 7039 | 38.09 | 826 | 810 | 163.5 |
| B | 3 | 64 | 25842 | 163.79 | 822 | 803 | 152.9 |
| B | 12 | 111 | 17863 | 111.59 | 822 | 803 | 152.9 |
| B | 11 | 111 | 16015 | 99.5 | 822 | 803 | 152.9 |
| C | 9 | 54 | 177157 | 945.63 | 805 | 811 | 186.5 |
| C | 14 | 238 | 129399 | 689.53 | 805 | 811 | 186.5 |
| C | 13 | 61 | 5636 | 25.87 | 805 | 811 | 186.5 |
| D | 1 | 52 | 114854 | 580.53 | 813 | 788 | 196.5 |
| D | 2 | 234 | 23540 | 115.79 | 813 | 788 | 196.5 |
| D | 13 | 172 | 20065 | 98.11 | 813 | 788 | 196.5 |
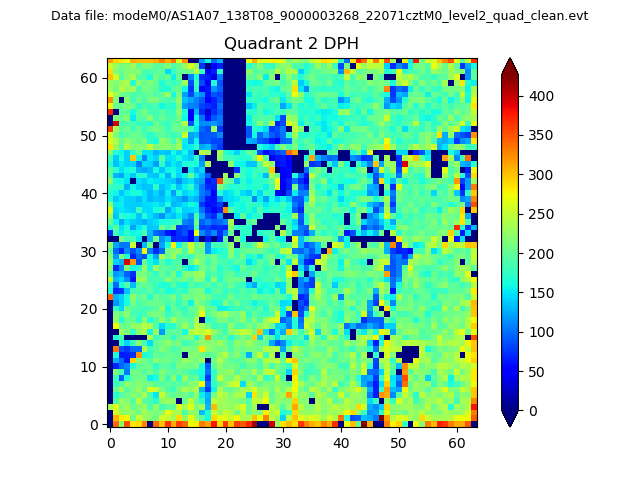
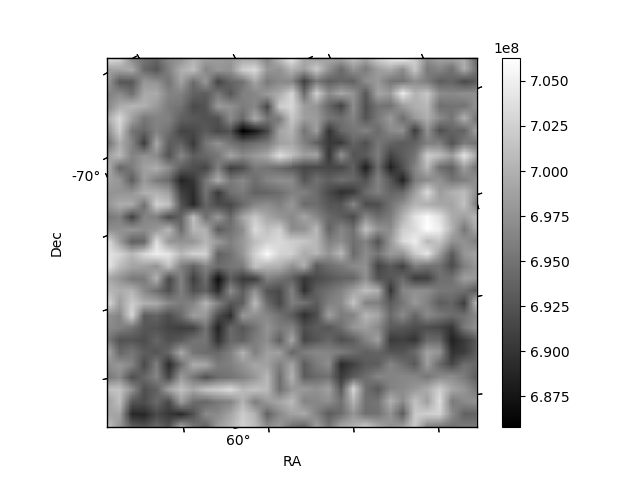
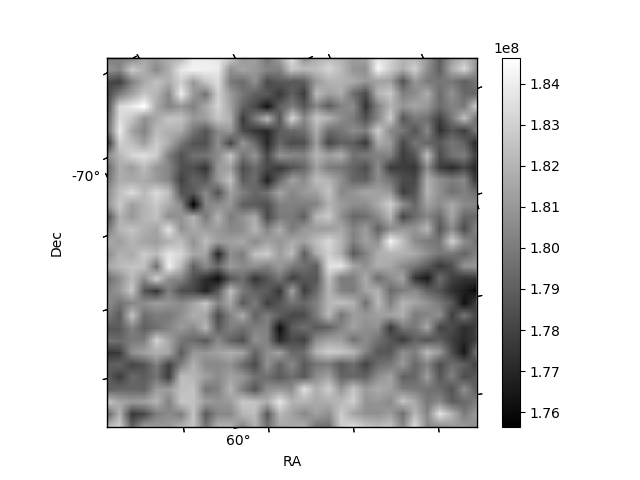
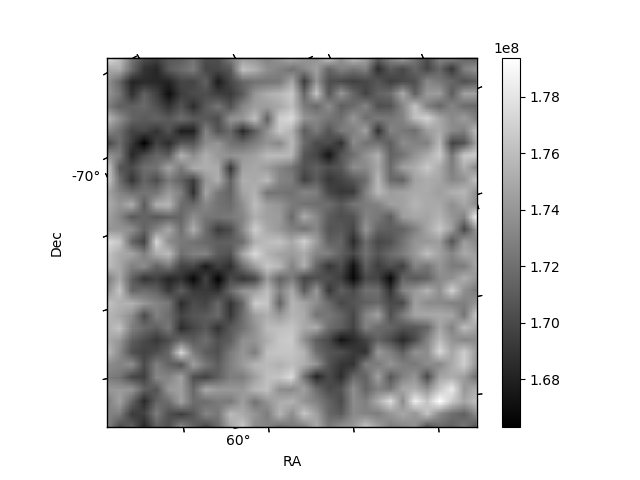
Histogram calculated using DETX and DETY for each event in the final _common_clean file
| Quadrant A | 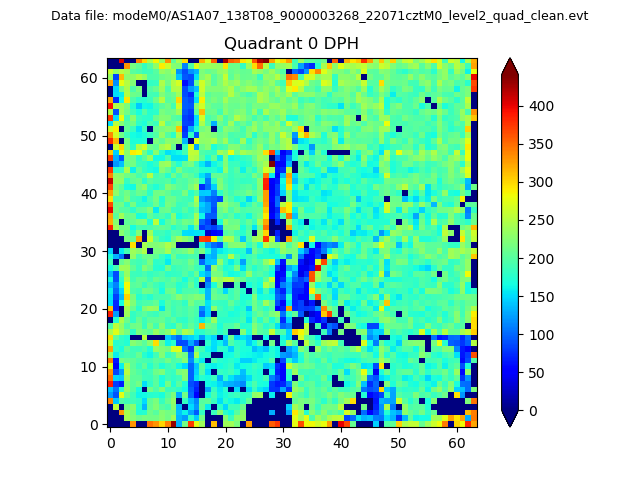 |
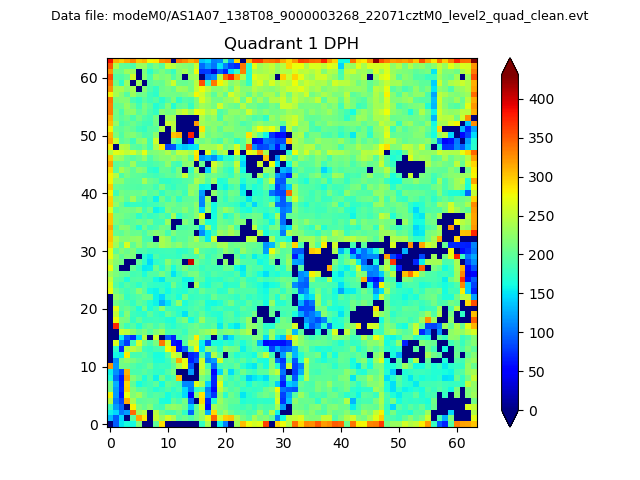 |
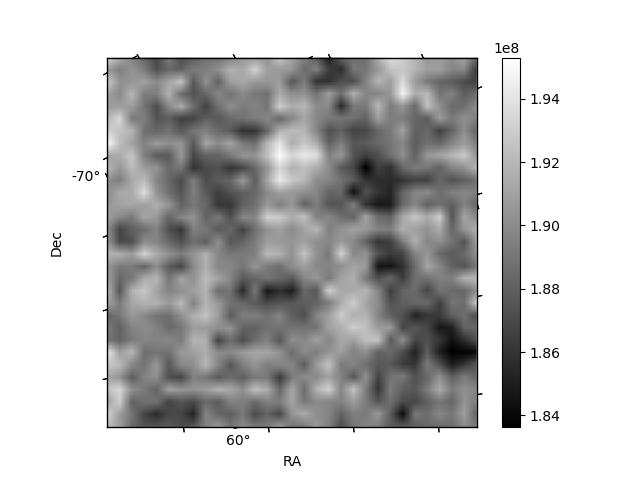
Quadrant B |
|---|---|---|---|
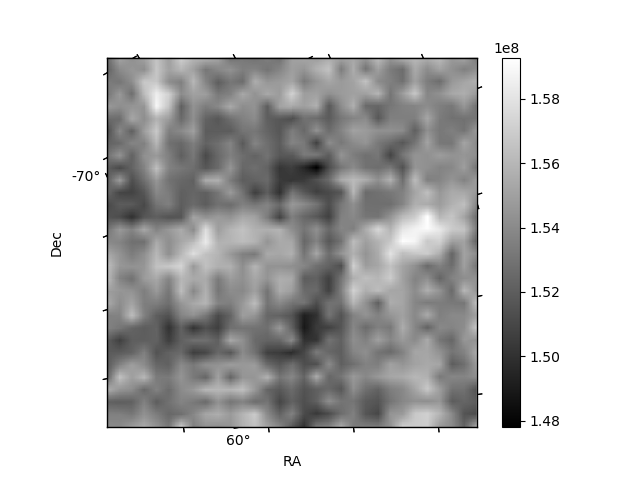
| Quadrant D | 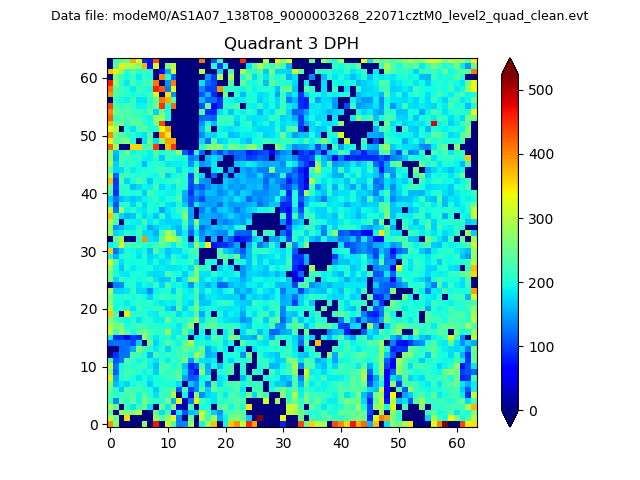 |
 |
Quadrant C |
| Plot type | Count rate plots | Images |
|---|---|---|
| Comparison with Poisson distribution Blue bars denote a histogram of data divided into 1 sec bins. Red curve is a Poisson curve with rate = median count rate of data. |
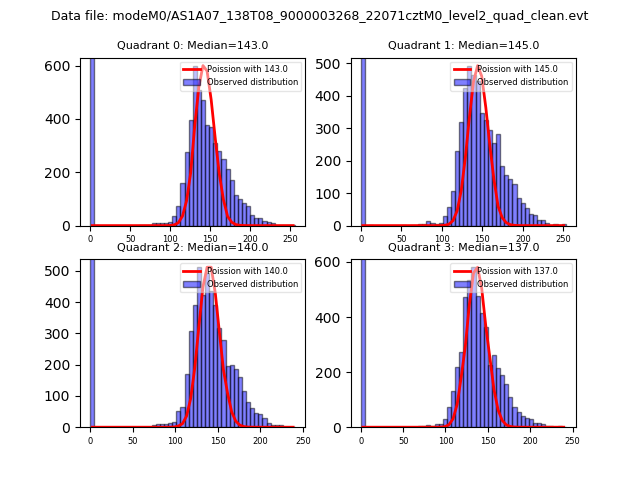 |
 |
| Quadrant-wise count rates Data is divided into 100 sec bins |
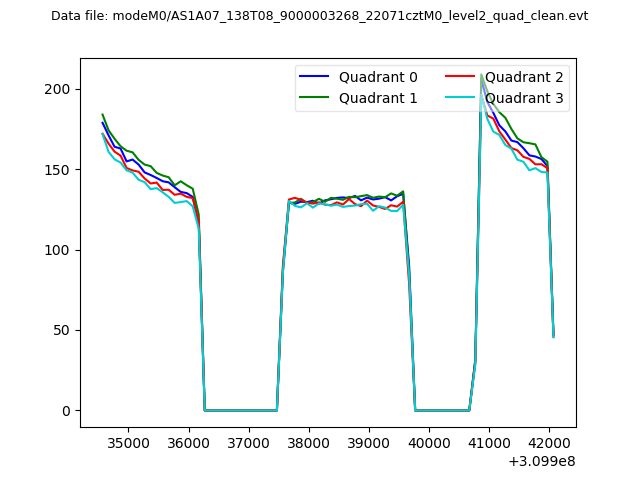 |
|
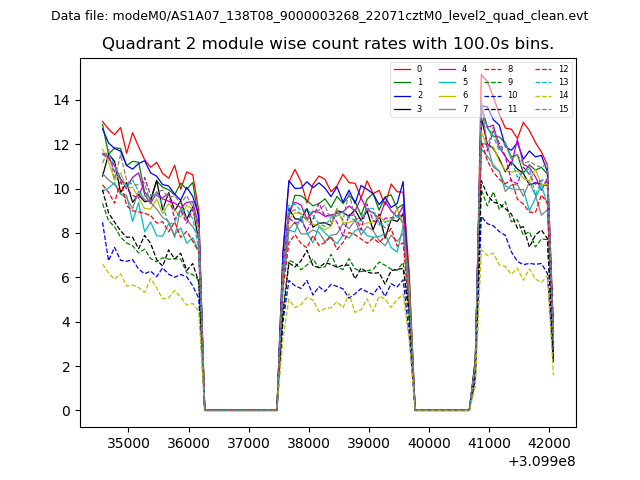
| Module-wise count rates for Quadrant A Data is divided into 100 sec bins |
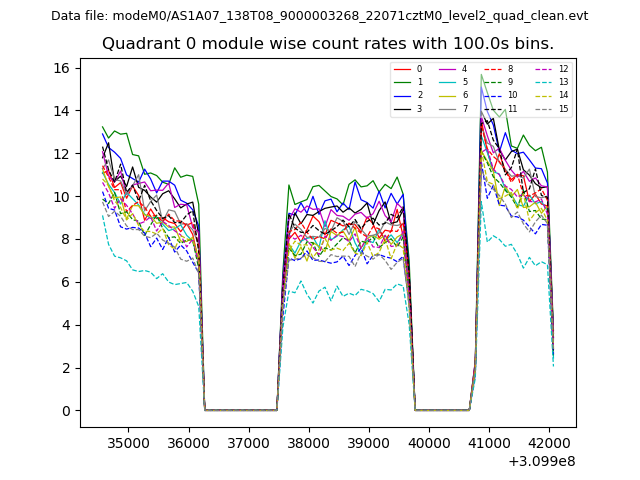 |
 |
| Module-wise count rates for Quadrant B Data is divided into 100 sec bins |
 |
 |
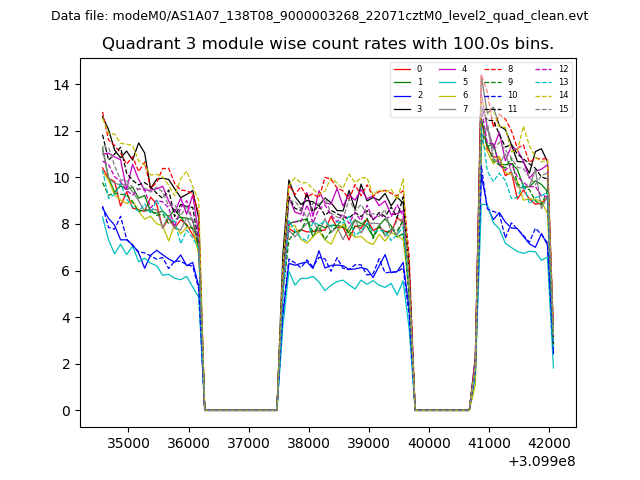
| Module-wise count rates for Quadrant C Data is divided into 100 sec bins |
 |
 |
| Module-wise count rates for Quadrant D Data is divided into 100 sec bins |
 |
 |
| Parameter | Plot |
|---|---|
| CZT HV Monitor | 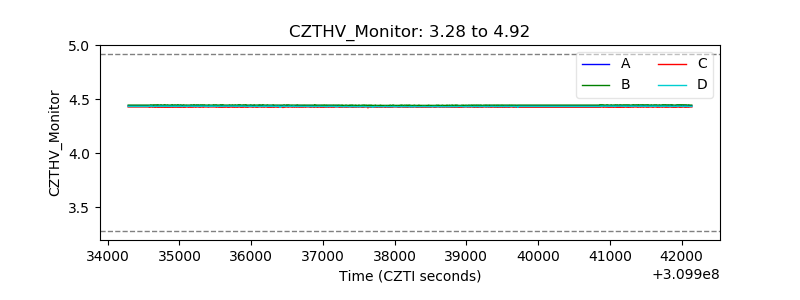 |
| D_VDD | 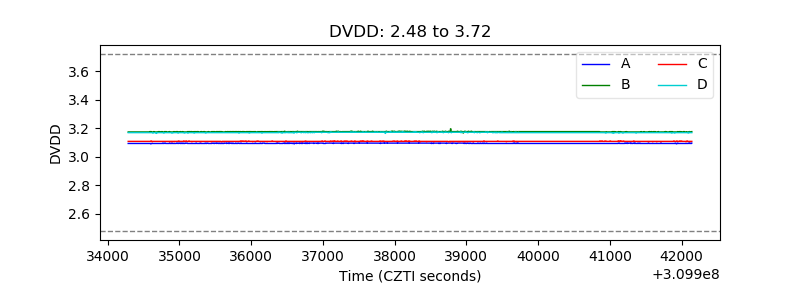 |
| Temperature 1 | 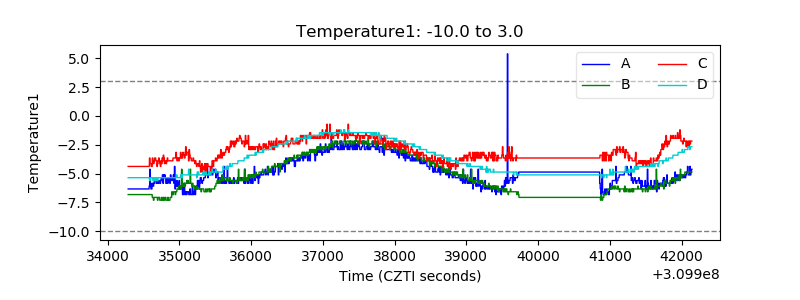 |
| Veto HV Monitor | 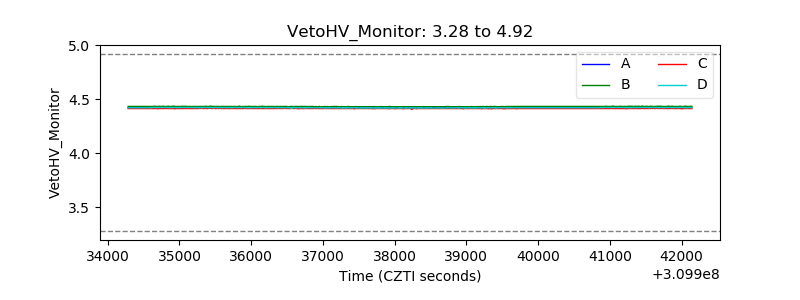 |
| Veto LLD | 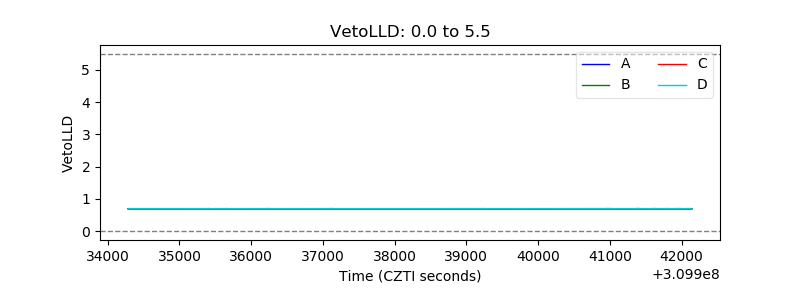 |
| Alpha Counter | 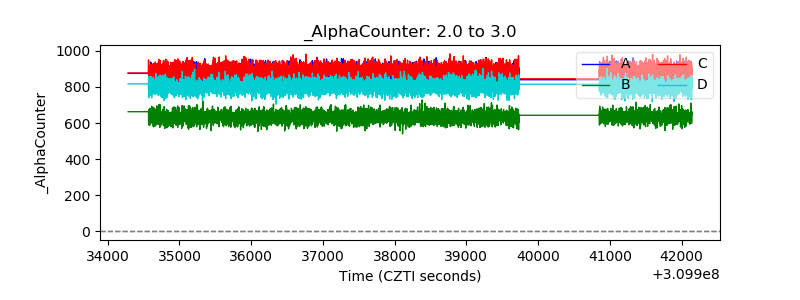 |
| _CPM_Rate | 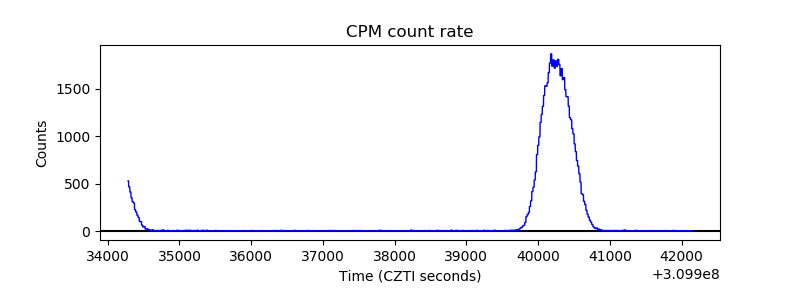 |
| CZT Counter | 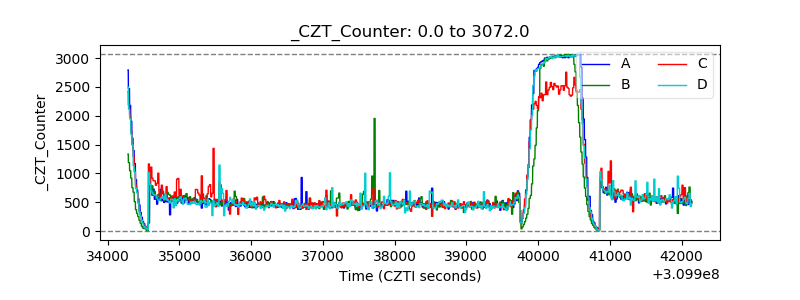 |
| +2.5 Volts monitor |  |
| +5 Volts monitor |  |
| _ROLL_ROT | 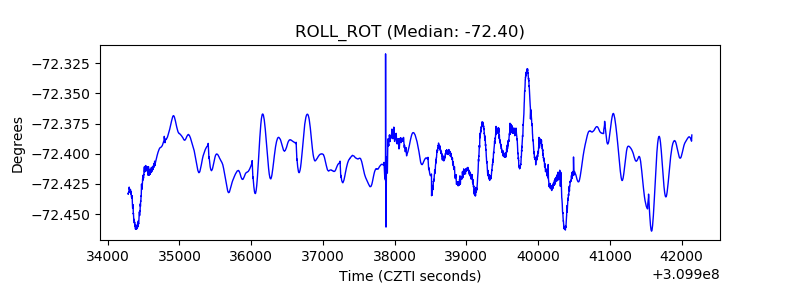 |
| _Roll_DEC | 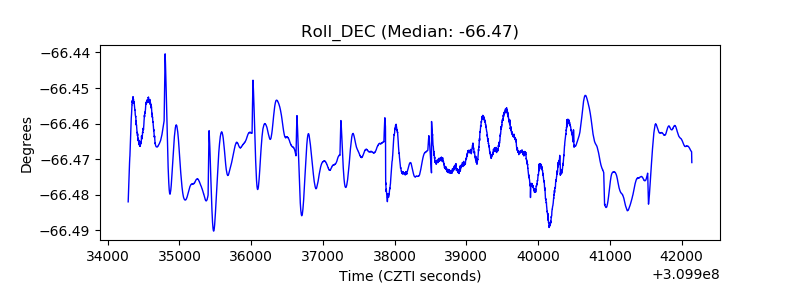 |
| _Roll_RA | 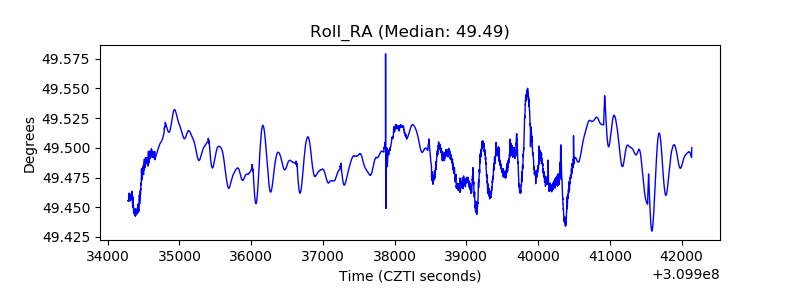 |
| Veto Counter | 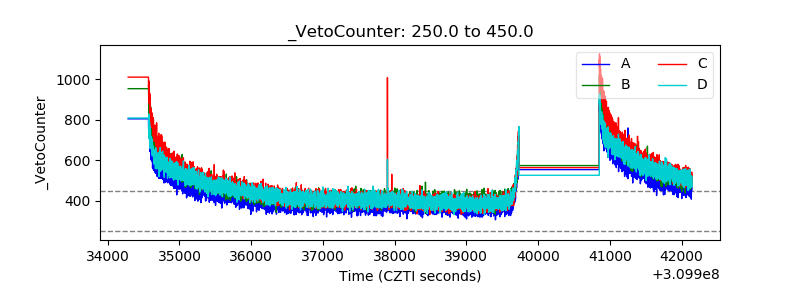 |