| Param | Original file | Final file |
|---|---|---|
| Filename | modeM0/AS1A07_138T08_9000003268_22073cztM0_level2.evt | modeM0/AS1A07_138T08_9000003268_22073cztM0_level2_quad_clean.evt |
| Size (bytes) | 438,713,280 | 87,088,320 |
| Size | 418.4 MB | 83.1 MB |
| Events in quadrant A | 3,039,860 | 570,814 |
| Events in quadrant B | 3,090,982 | 577,358 |
| Events in quadrant C | 3,080,800 | 549,942 |
| Events in quadrant D | 3,683,203 | 536,214 |
| Mode SS | |||
|---|---|---|---|
| Quadrant | BADHDUFLAG | Total packets | Discarded packets |
| A | 0 | 116 | 0 |
| B | 0 | 116 | 0 |
| C | 0 | 118 | 0 |
| D | 0 | 118 | 0 |
| Mode M9 | |||
|---|---|---|---|
| Quadrant | BADHDUFLAG | Total packets | Discarded packets |
| A | 0 | 13 | 0 |
| B | 0 | 13 | 0 |
| C | 0 | 13 | 0 |
| D | 0 | 13 | 0 |
| Mode M0 | |||
|---|---|---|---|
| Quadrant | BADHDUFLAG | Total packets | Discarded packets |
| A | 0 | 12661 | 0 |
| B | 0 | 12771 | 0 |
| C | 0 | 12807 | 0 |
| D | 0 | 14814 | 0 |
| Quadrant | Total seconds | Saturated seconds | Saturation percentage |
|---|---|---|---|
| A | 5765 | 68 | 1.179532% |
| B | 5764 | 97 | 1.682859% |
| C | 5765 | 139 | 2.411101% |
| D | 5765 | 253 | 4.388552% |
Noise dominated data is calculated using 1-second bins in cleaned event files. If a bin has >2000 counts, and if more than 50% of those come from <1% of pixels, then it is considered to be noise-dominated and hence unusable.
| Quadrant | # 1 sec bins | Bins with >0 counts | Bins with >2000 counts | High rate bins dominated by noise | Noise dominated (total time) | Noise dominated (detector-on time) | Marked lightcurve |
|---|---|---|---|---|---|---|---|
| A | 7055 | 5766 | 0 | 0 | 0.00% | 0.00% | 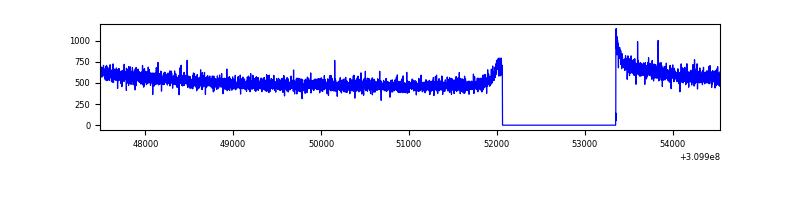 |
| B | 7054 | 5765 | 0 | 0 | 0.00% | 0.00% | 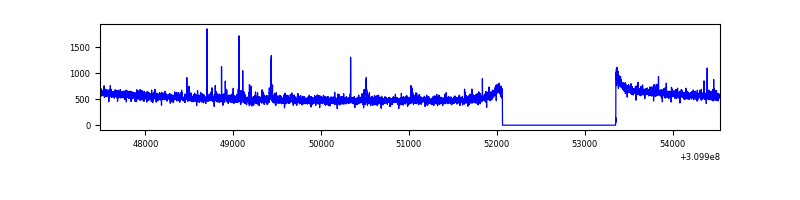 |
| C | 7054 | 5765 | 6 | 6 | 0.09% | 0.10% | 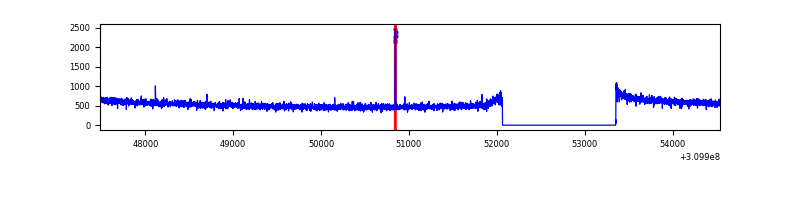 |
| D | 7055 | 5766 | 163 | 163 | 2.31% | 2.83% | 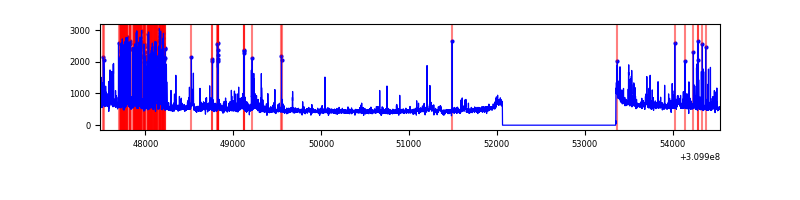 |
Top three noisy pixels from each quadrant. If the there are fewer than three noisy pixels in the level2.evt file, extra rows are filled as -1
| Pixel properties | Quadrant properties | ||||||
|---|---|---|---|---|---|---|---|
| Quadrant | DetID | PixID | Counts | Sigma | Mean | Median | Sigma |
| A | 13 | 254 | 8523 | 49.65 | 789 | 775 | 156.0 |
| A | 0 | 226 | 6841 | 38.87 | 789 | 775 | 156.0 |
| A | 3 | 137 | 5862 | 32.6 | 789 | 775 | 156.0 |
| B | 6 | 36 | 19533 | 132.37 | 779 | 761 | 141.8 |
| B | 12 | 111 | 16215 | 108.97 | 779 | 761 | 141.8 |
| B | 11 | 111 | 14486 | 96.78 | 779 | 761 | 141.8 |
| C | 14 | 238 | 122248 | 704.71 | 754 | 760 | 172.4 |
| C | 10 | 22 | 18717 | 104.16 | 754 | 760 | 172.4 |
| C | 13 | 61 | 5203 | 25.77 | 754 | 760 | 172.4 |
| D | 7 | 223 | 377505 | 2091.73 | 759 | 739 | 180.1 |
| D | 1 | 52 | 187775 | 1038.39 | 759 | 739 | 180.1 |
| D | 2 | 136 | 169301 | 935.82 | 759 | 739 | 180.1 |
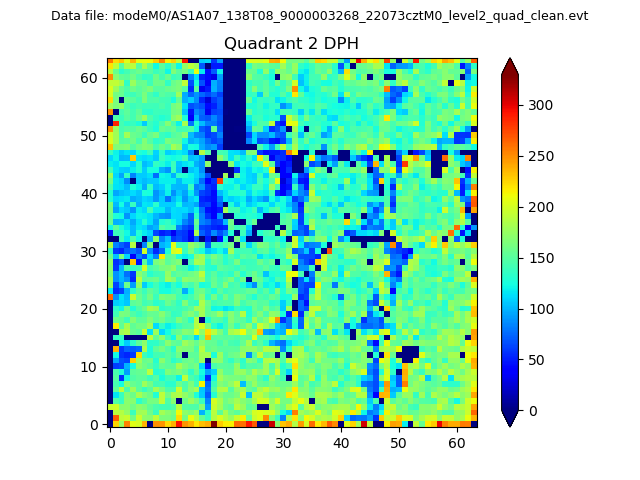
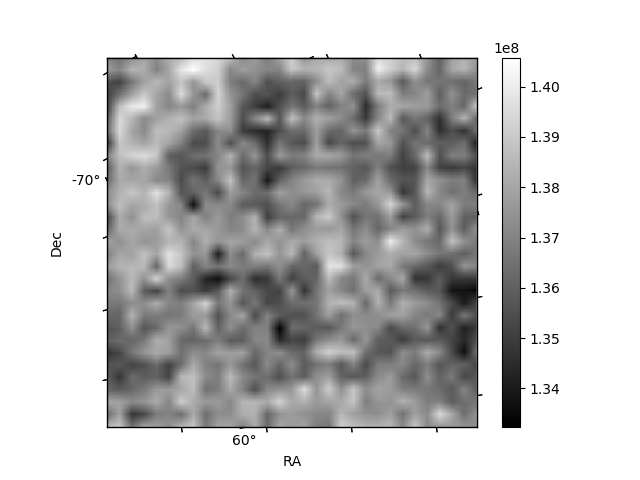
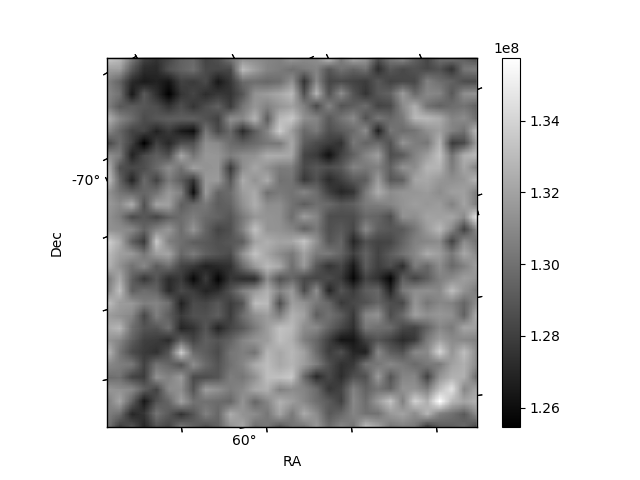
Histogram calculated using DETX and DETY for each event in the final _common_clean file
| Quadrant A | 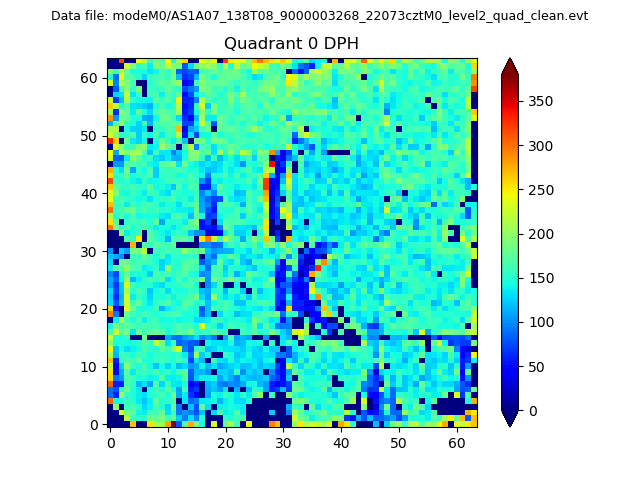 |
 |
Quadrant B |
|---|---|---|---|
| Quadrant D |  |
 |
Quadrant C |
| Plot type | Count rate plots | Images |
|---|---|---|
| Comparison with Poisson distribution Blue bars denote a histogram of data divided into 1 sec bins. Red curve is a Poisson curve with rate = median count rate of data. |
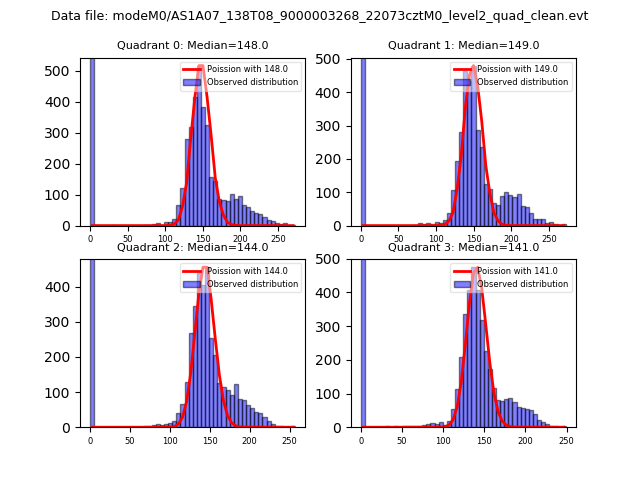 |
 |
| Quadrant-wise count rates Data is divided into 100 sec bins |
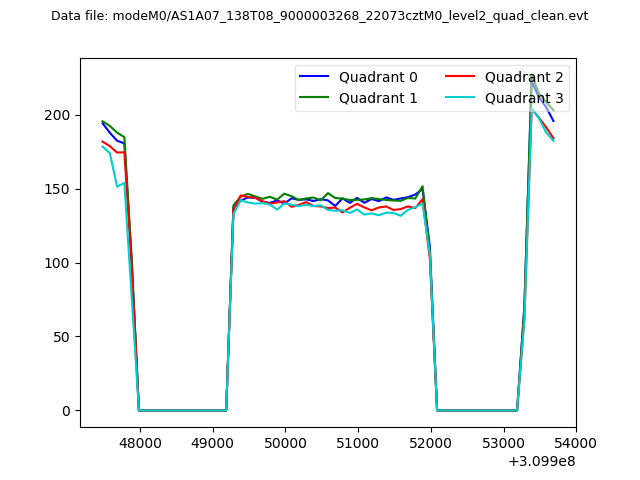 |
|
| Module-wise count rates for Quadrant A Data is divided into 100 sec bins |
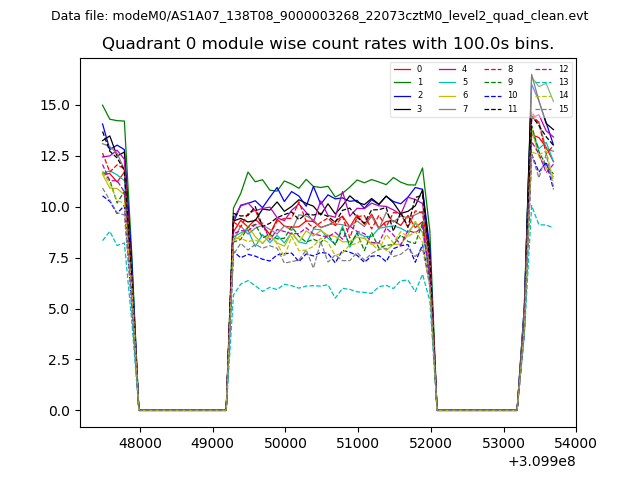 |
 |
| Module-wise count rates for Quadrant B Data is divided into 100 sec bins |
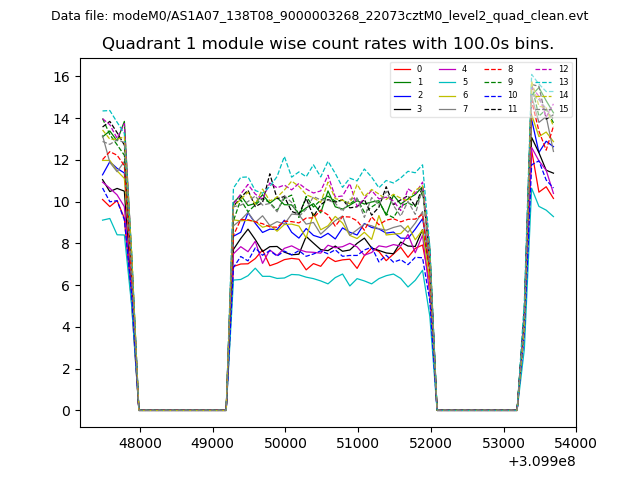 |
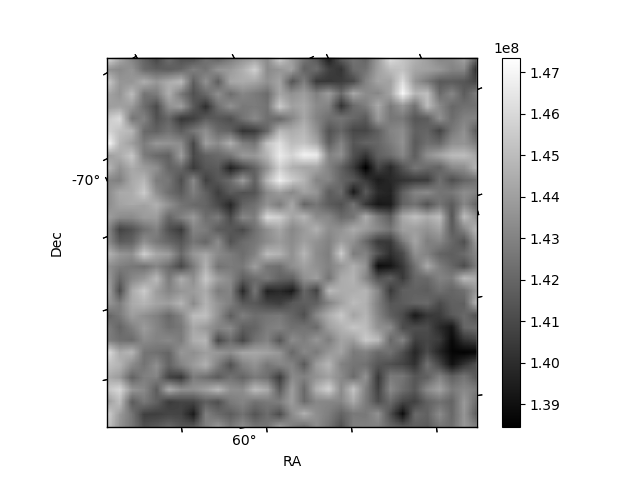 |
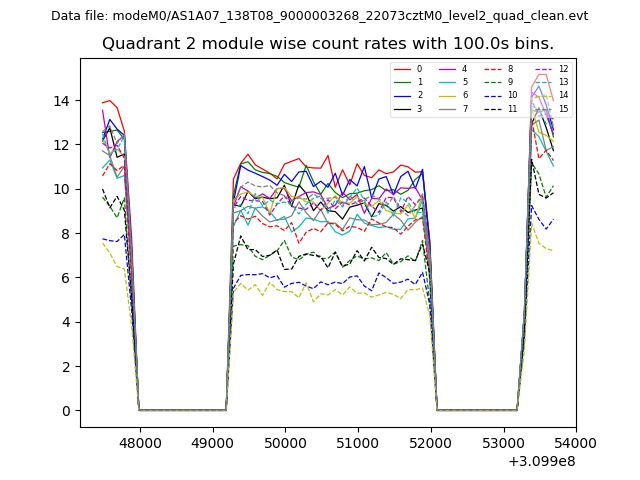
| Module-wise count rates for Quadrant C Data is divided into 100 sec bins |
 |
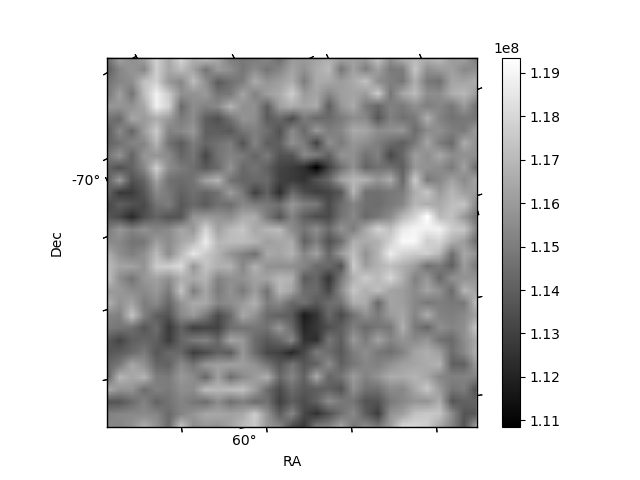 |
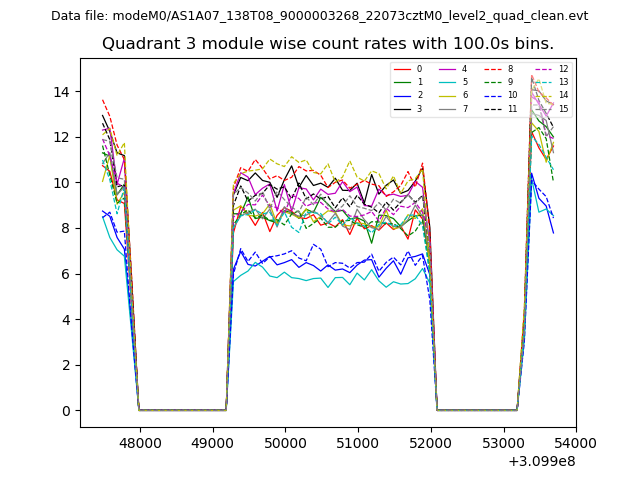
| Module-wise count rates for Quadrant D Data is divided into 100 sec bins |
 |
 |
| Parameter | Plot |
|---|---|
| CZT HV Monitor | 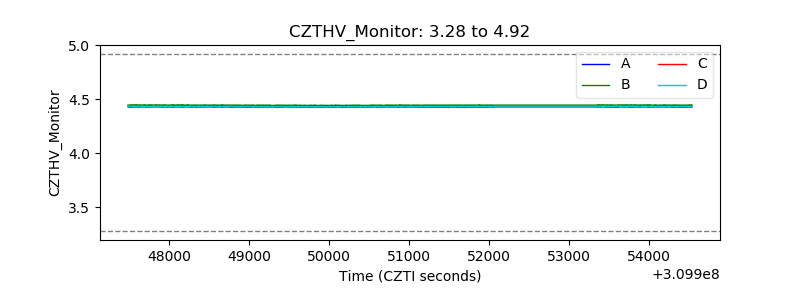 |
| D_VDD |  |
| Temperature 1 | 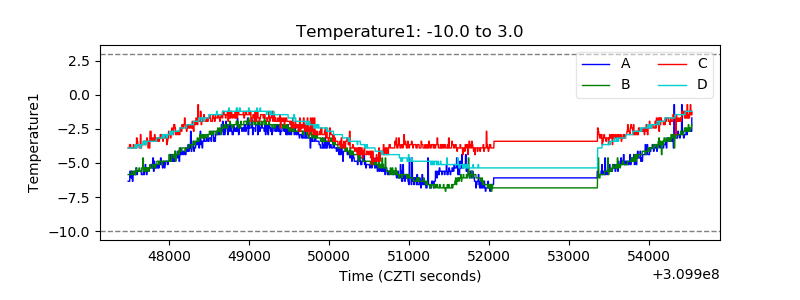 |
| Veto HV Monitor | 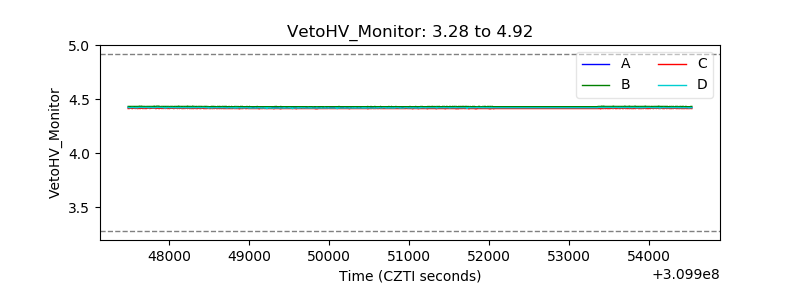 |
| Veto LLD | 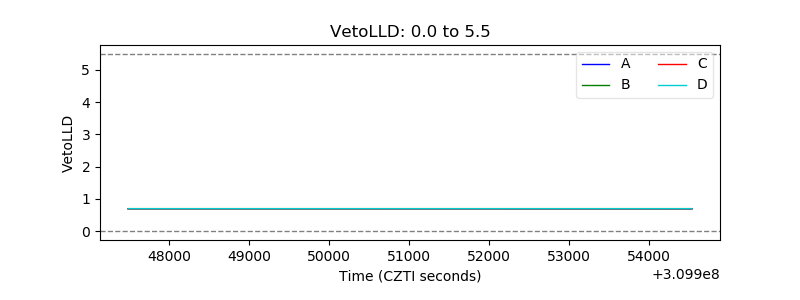 |
| Alpha Counter | 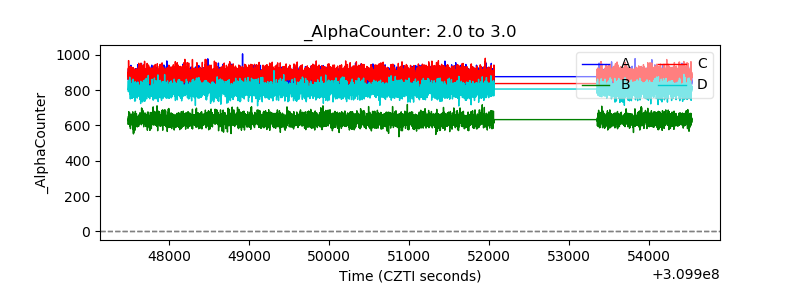 |
| _CPM_Rate | 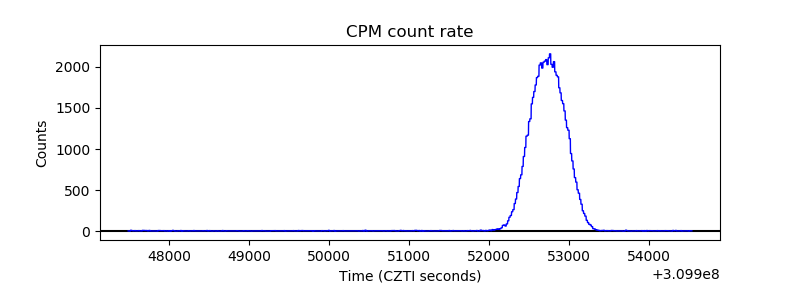 |
| CZT Counter | 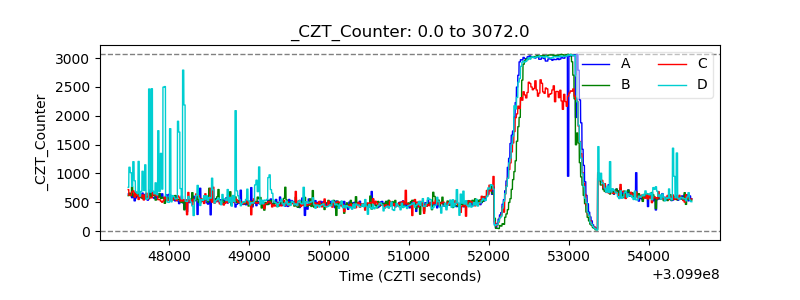 |
| +2.5 Volts monitor |  |
| +5 Volts monitor |  |
| _ROLL_ROT | 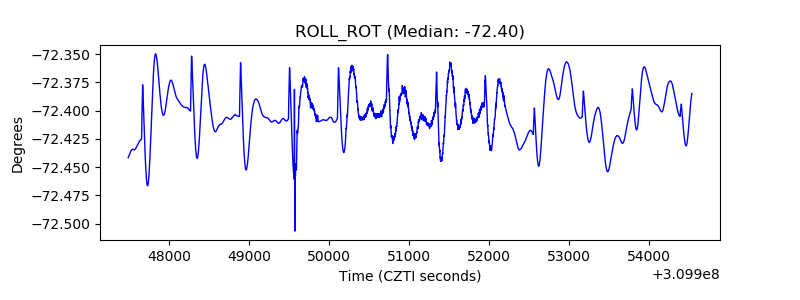 |
| _Roll_DEC | 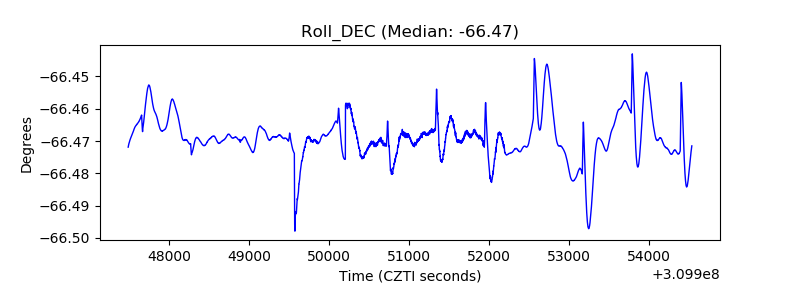 |
| _Roll_RA | 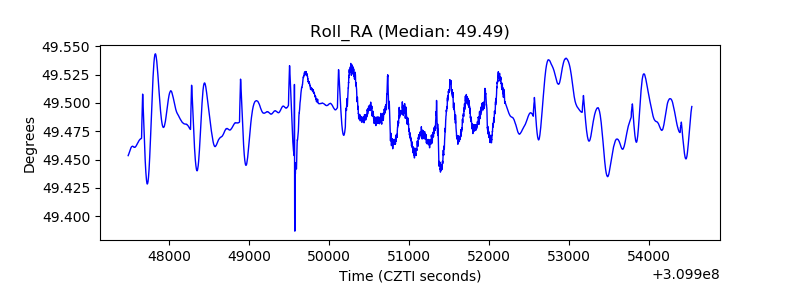 |
| Veto Counter | 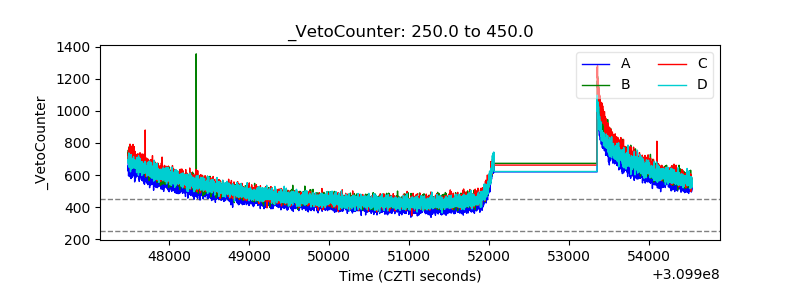 |