| Param | Original file | Final file |
|---|---|---|
| Filename | modeM0/AS1A07_138T08_9000003268_22075cztM0_level2.evt | modeM0/AS1A07_138T08_9000003268_22075cztM0_level2_quad_clean.evt |
| Size (bytes) | 466,536,960 | 89,478,720 |
| Size | 444.9 MB | 85.3 MB |
| Events in quadrant A | 3,278,170 | 580,474 |
| Events in quadrant B | 3,343,438 | 583,010 |
| Events in quadrant C | 3,286,789 | 553,570 |
| Events in quadrant D | 3,790,030 | 550,491 |
| Mode SS | |||
|---|---|---|---|
| Quadrant | BADHDUFLAG | Total packets | Discarded packets |
| A | 0 | 128 | 0 |
| B | 0 | 128 | 0 |
| C | 0 | 128 | 0 |
| D | 0 | 128 | 0 |
| Mode M9 | |||
|---|---|---|---|
| Quadrant | BADHDUFLAG | Total packets | Discarded packets |
| A | 0 | 14 | 0 |
| B | 0 | 15 | 0 |
| C | 0 | 15 | 0 |
| D | 0 | 15 | 0 |
| Mode M0 | |||
|---|---|---|---|
| Quadrant | BADHDUFLAG | Total packets | Discarded packets |
| A | 0 | 13635 | 0 |
| B | 0 | 13868 | 0 |
| C | 0 | 13726 | 0 |
| D | 0 | 15459 | 0 |
| Quadrant | Total seconds | Saturated seconds | Saturation percentage |
|---|---|---|---|
| A | 6338 | 139 | 2.193121% |
| B | 6338 | 157 | 2.477122% |
| C | 6338 | 187 | 2.950458% |
| D | 6338 | 217 | 3.423793% |
Noise dominated data is calculated using 1-second bins in cleaned event files. If a bin has >2000 counts, and if more than 50% of those come from <1% of pixels, then it is considered to be noise-dominated and hence unusable.
| Quadrant | # 1 sec bins | Bins with >0 counts | Bins with >2000 counts | High rate bins dominated by noise | Noise dominated (total time) | Noise dominated (detector-on time) | Marked lightcurve |
|---|---|---|---|---|---|---|---|
| A | 7543 | 6339 | 0 | 0 | 0.00% | 0.00% | 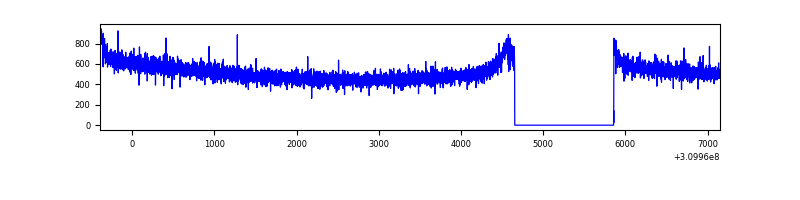 |
| B | 7543 | 6339 | 2 | 2 | 0.03% | 0.03% | 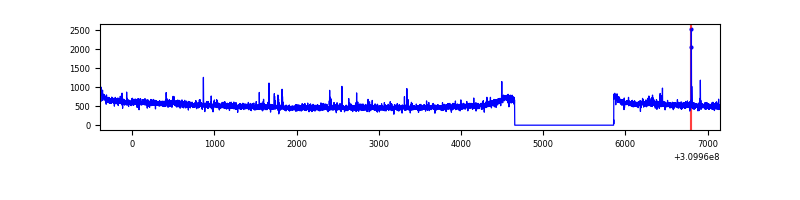 |
| C | 7543 | 6339 | 0 | 0 | 0.00% | 0.00% | 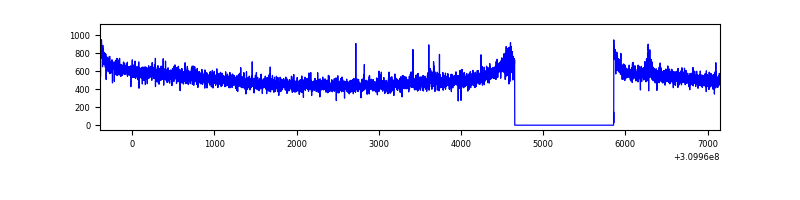 |
| D | 7543 | 6339 | 45 | 45 | 0.60% | 0.71% | 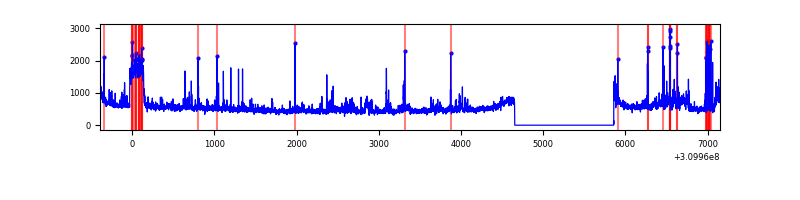 |
Top three noisy pixels from each quadrant. If the there are fewer than three noisy pixels in the level2.evt file, extra rows are filled as -1
| Pixel properties | Quadrant properties | ||||||
|---|---|---|---|---|---|---|---|
| Quadrant | DetID | PixID | Counts | Sigma | Mean | Median | Sigma |
| A | 13 | 254 | 10410 | 56.99 | 850 | 835 | 168.0 |
| A | 0 | 226 | 7291 | 38.43 | 850 | 835 | 168.0 |
| A | 3 | 137 | 6547 | 34.0 | 850 | 835 | 168.0 |
| B | 12 | 111 | 17582 | 108.57 | 842 | 821 | 154.4 |
| B | 0 | 197 | 17083 | 105.34 | 842 | 821 | 154.4 |
| B | 11 | 111 | 15769 | 96.83 | 842 | 821 | 154.4 |
| C | 14 | 238 | 130390 | 701.13 | 805 | 809 | 184.8 |
| C | 9 | 54 | 10642 | 53.2 | 805 | 809 | 184.8 |
| C | 8 | 222 | 7484 | 36.12 | 805 | 809 | 184.8 |
| D | 1 | 52 | 257679 | 1302.74 | 824 | 801 | 197.2 |
| D | 7 | 238 | 115312 | 580.73 | 824 | 801 | 197.2 |
| D | 7 | 223 | 88740 | 445.98 | 824 | 801 | 197.2 |
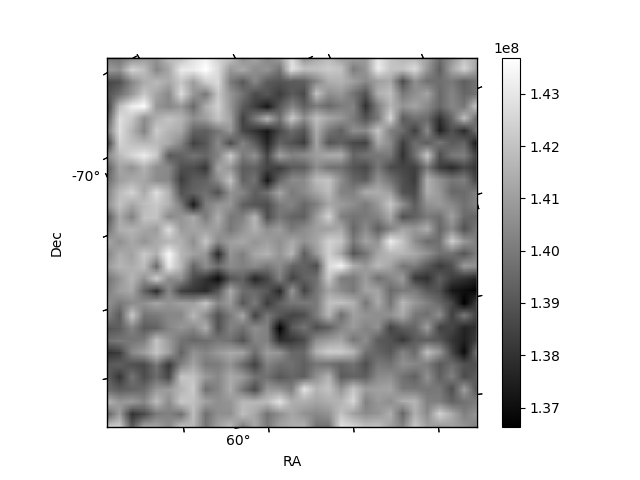
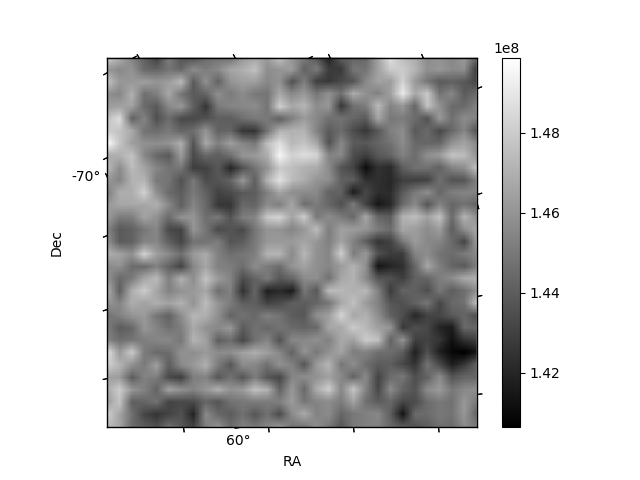
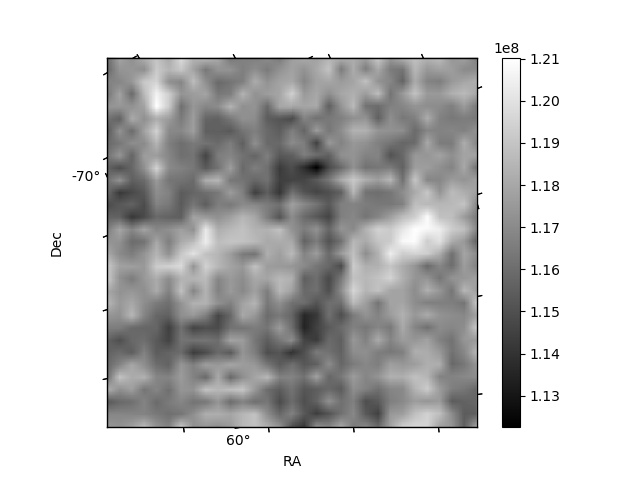
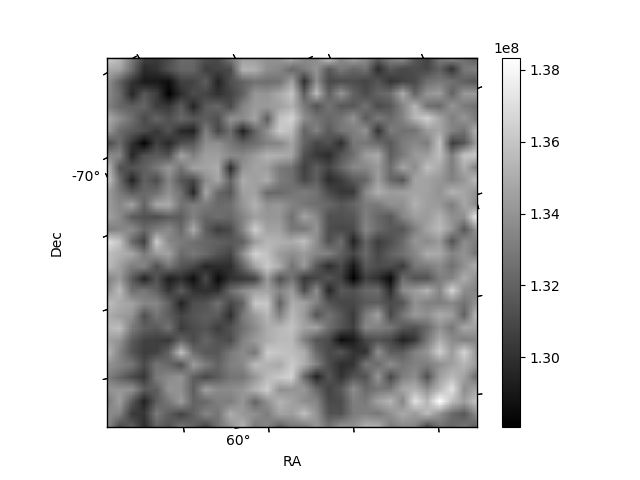
Histogram calculated using DETX and DETY for each event in the final _common_clean file
| Quadrant A | 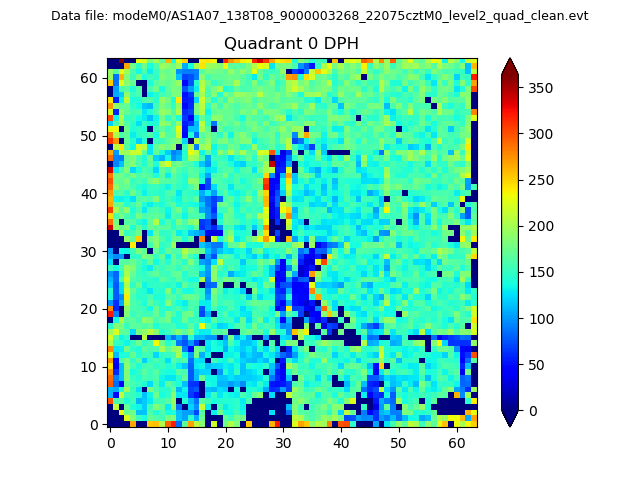 |
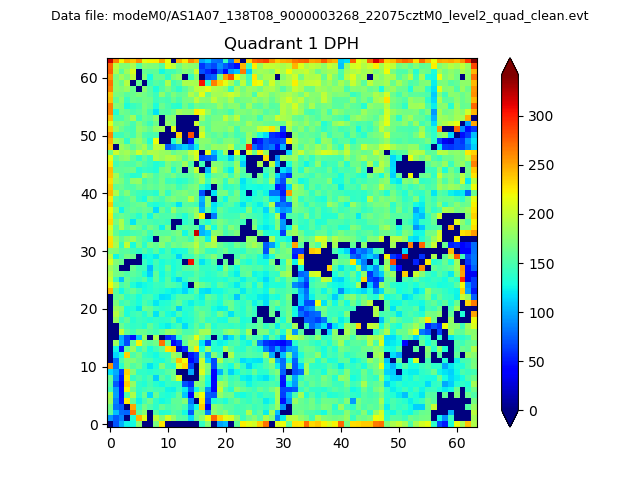 |
Quadrant B |
|---|---|---|---|
| Quadrant D | 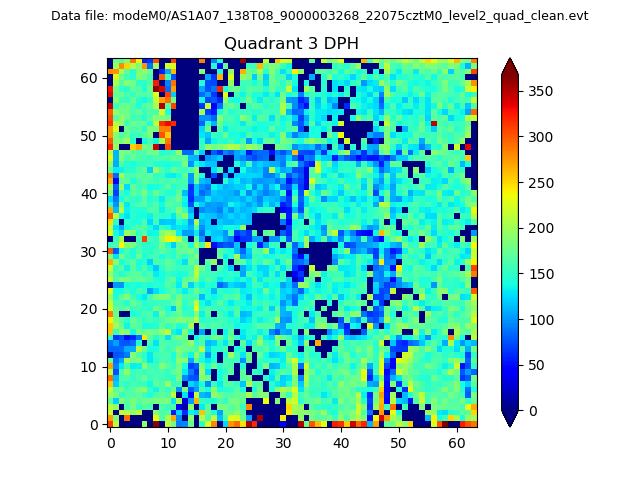 |
 |
Quadrant C |
| Plot type | Count rate plots | Images |
|---|---|---|
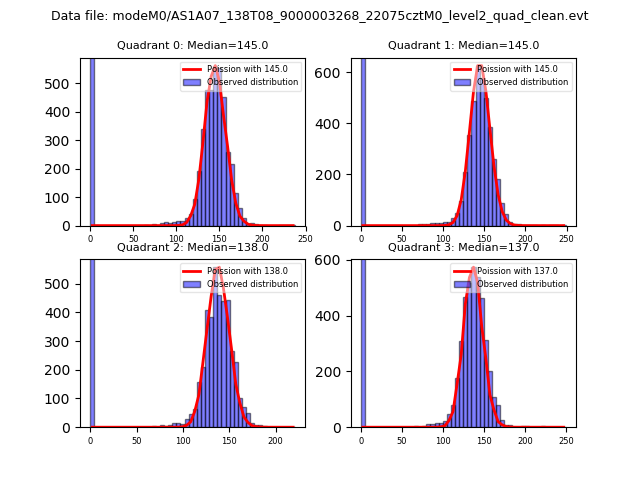
| Comparison with Poisson distribution Blue bars denote a histogram of data divided into 1 sec bins. Red curve is a Poisson curve with rate = median count rate of data. |
 |
 |
| Quadrant-wise count rates Data is divided into 100 sec bins |
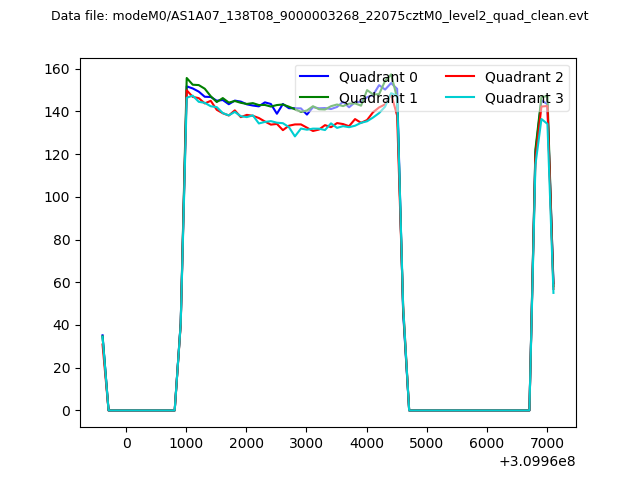 |
|
| Module-wise count rates for Quadrant A Data is divided into 100 sec bins |
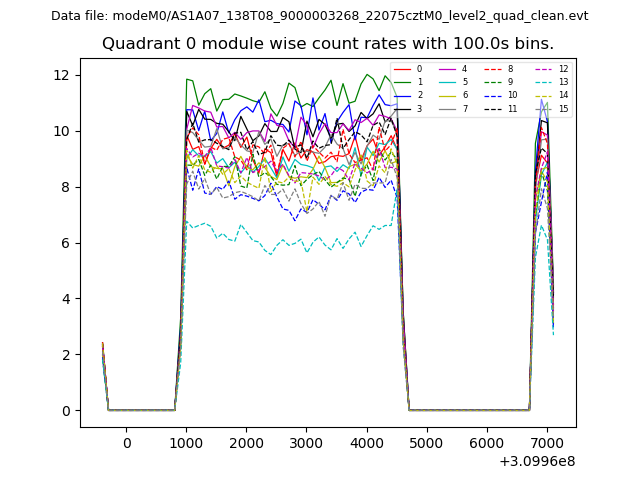 |
 |
| Module-wise count rates for Quadrant B Data is divided into 100 sec bins |
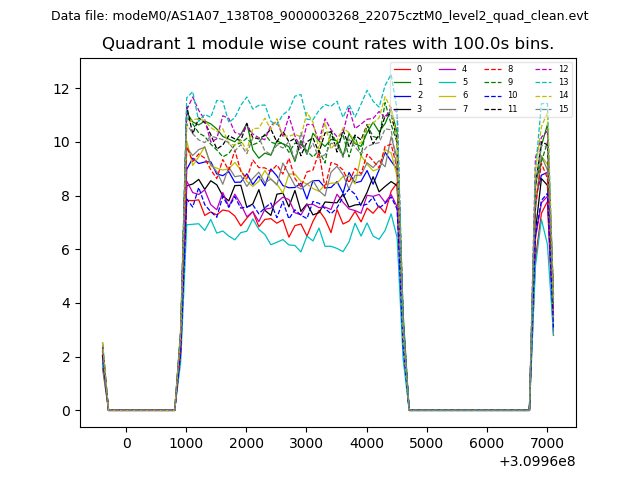 |
 |
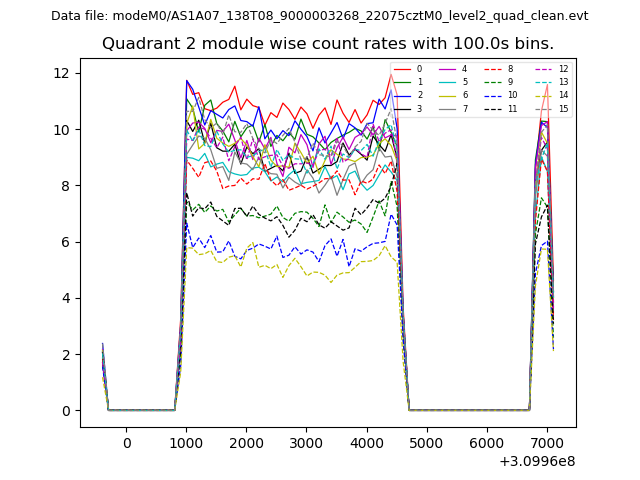
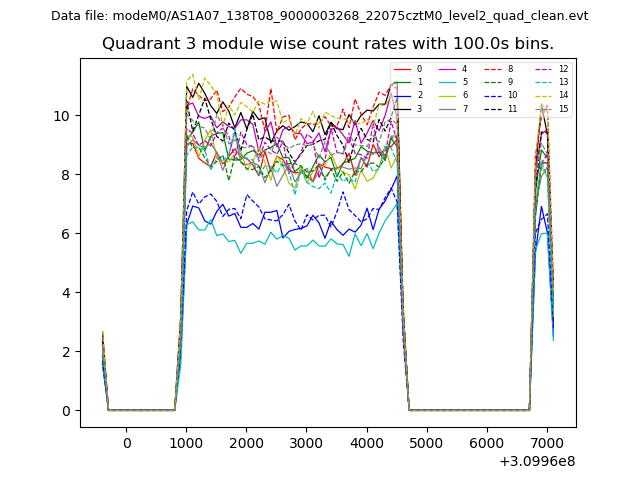
| Module-wise count rates for Quadrant C Data is divided into 100 sec bins |
 |
 |
| Module-wise count rates for Quadrant D Data is divided into 100 sec bins |
 |
 |
| Parameter | Plot |
|---|---|
| CZT HV Monitor | 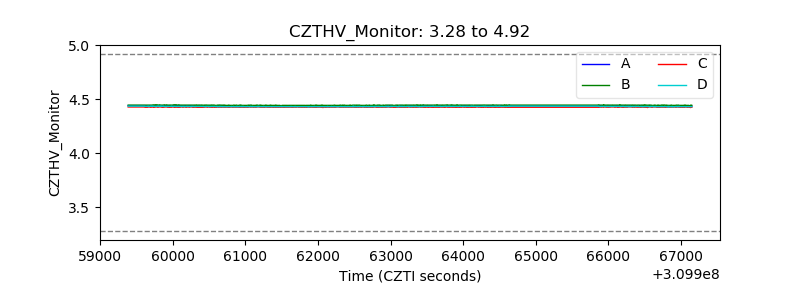 |
| D_VDD | 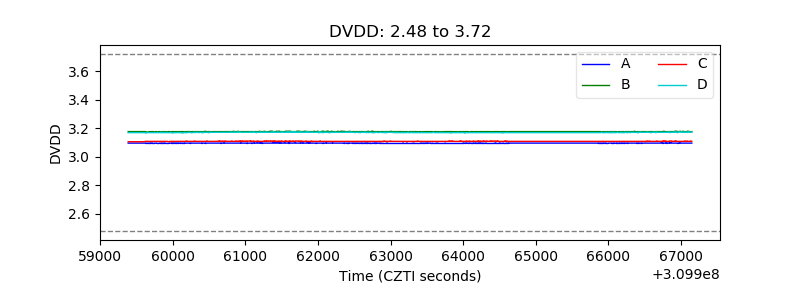 |
| Temperature 1 | 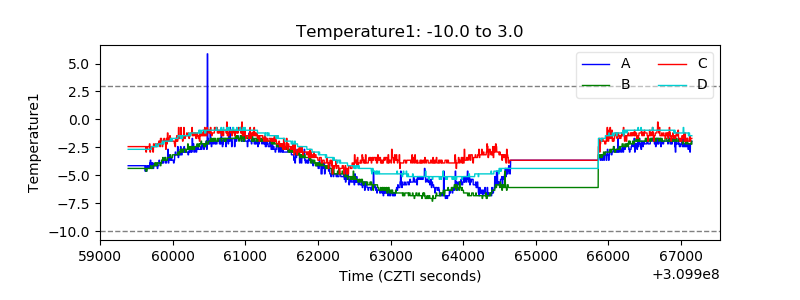 |
| Veto HV Monitor | 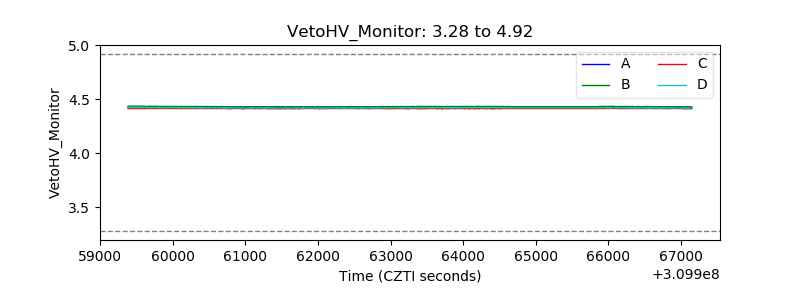 |
| Veto LLD | 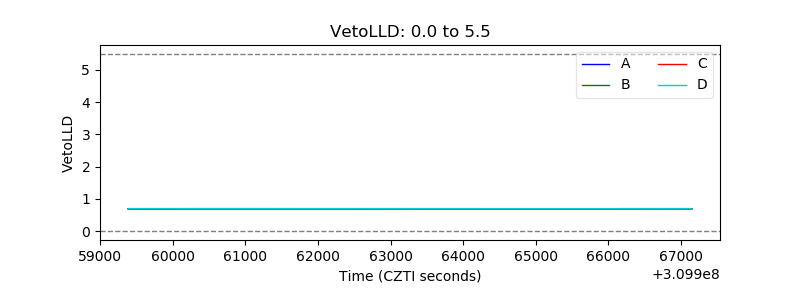 |
| Alpha Counter | 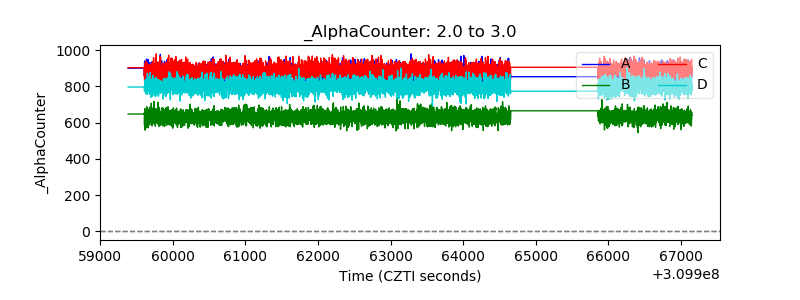 |
| _CPM_Rate | 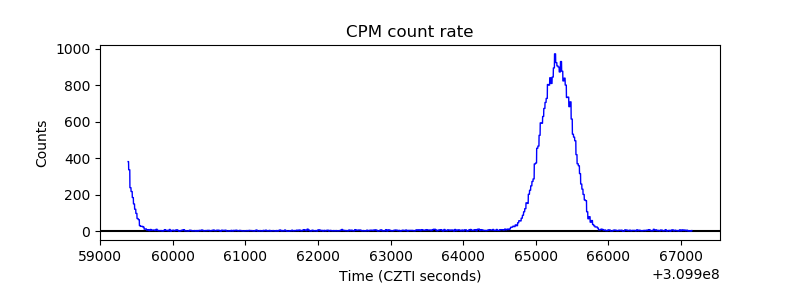 |
| CZT Counter | 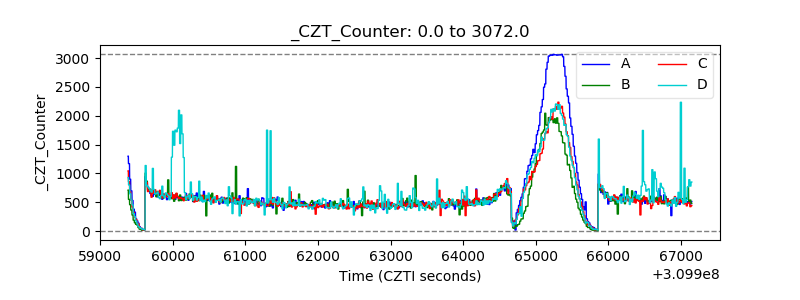 |
| +2.5 Volts monitor |  |
| +5 Volts monitor | 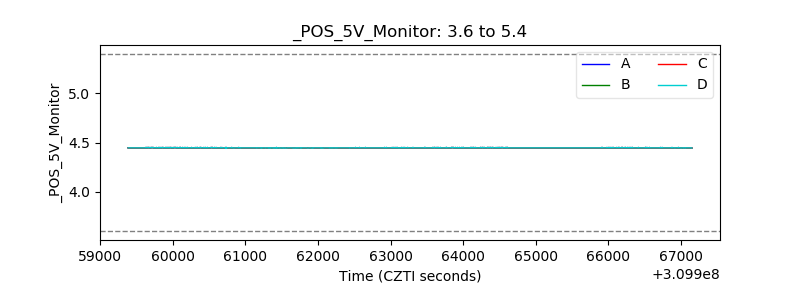 |
| _ROLL_ROT | 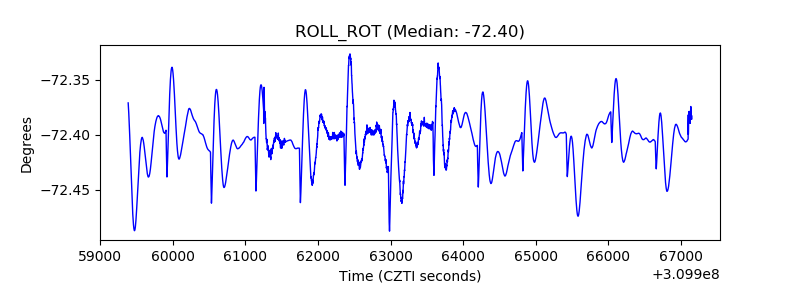 |
| _Roll_DEC | 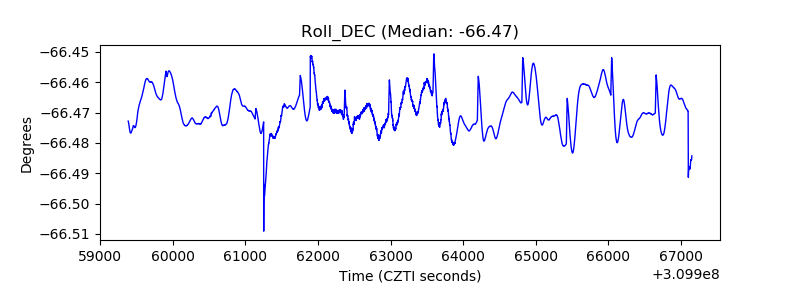 |
| _Roll_RA |  |
| Veto Counter | 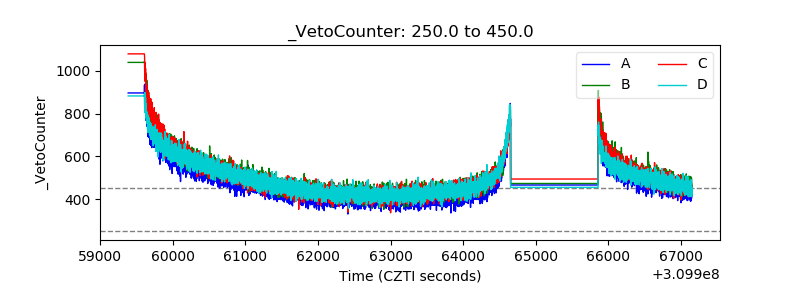 |