| Param | Original file | Final file |
|---|---|---|
| Filename | modeM0/AS1A07_138T08_9000003268_22076cztM0_level2.evt | modeM0/AS1A07_138T08_9000003268_22076cztM0_level2_quad_clean.evt |
| Size (bytes) | 493,456,320 | 104,080,320 |
| Size | 470.6 MB | 99.3 MB |
| Events in quadrant A | 3,219,231 | 687,814 |
| Events in quadrant B | 3,360,082 | 692,373 |
| Events in quadrant C | 3,276,271 | 665,141 |
| Events in quadrant D | 4,642,536 | 648,661 |
| Mode SS | |||
|---|---|---|---|
| Quadrant | BADHDUFLAG | Total packets | Discarded packets |
| A | 0 | 134 | 0 |
| B | 0 | 134 | 0 |
| C | 0 | 134 | 0 |
| D | 0 | 134 | 0 |
| Mode M9 | |||
|---|---|---|---|
| Quadrant | BADHDUFLAG | Total packets | Discarded packets |
| A | 0 | 14 | 0 |
| B | 0 | 15 | 0 |
| C | 0 | 15 | 0 |
| D | 0 | 15 | 0 |
| Mode M0 | |||
|---|---|---|---|
| Quadrant | BADHDUFLAG | Total packets | Discarded packets |
| A | 0 | 13698 | 0 |
| B | 0 | 14038 | 0 |
| C | 0 | 13856 | 0 |
| D | 0 | 18454 | 0 |
| Quadrant | Total seconds | Saturated seconds | Saturation percentage |
|---|---|---|---|
| A | 6566 | 124 | 1.888517% |
| B | 6566 | 165 | 2.512945% |
| C | 6566 | 148 | 2.254036% |
| D | 6565 | 422 | 6.428027% |
Noise dominated data is calculated using 1-second bins in cleaned event files. If a bin has >2000 counts, and if more than 50% of those come from <1% of pixels, then it is considered to be noise-dominated and hence unusable.
| Quadrant | # 1 sec bins | Bins with >0 counts | Bins with >2000 counts | High rate bins dominated by noise | Noise dominated (total time) | Noise dominated (detector-on time) | Marked lightcurve |
|---|---|---|---|---|---|---|---|
| A | 7506 | 6567 | 0 | 0 | 0.00% | 0.00% | 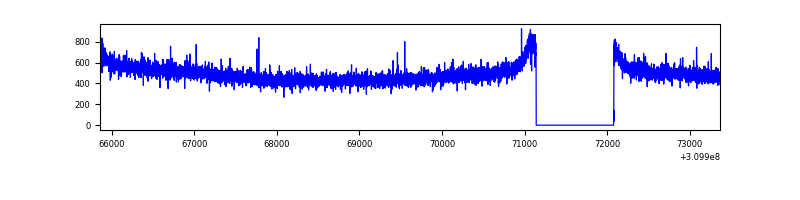 |
| B | 7506 | 6567 | 27 | 27 | 0.36% | 0.41% | 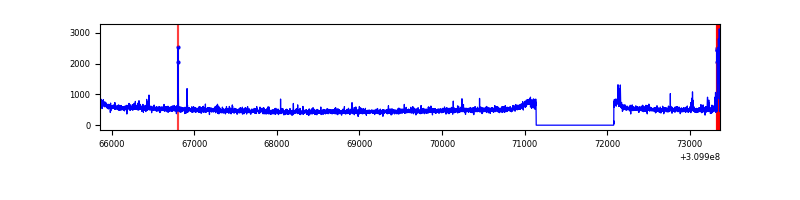 |
| C | 7506 | 6567 | 5 | 5 | 0.07% | 0.08% | 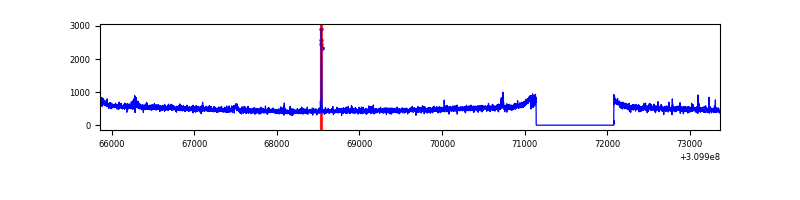 |
| D | 7505 | 6566 | 321 | 321 | 4.28% | 4.89% | 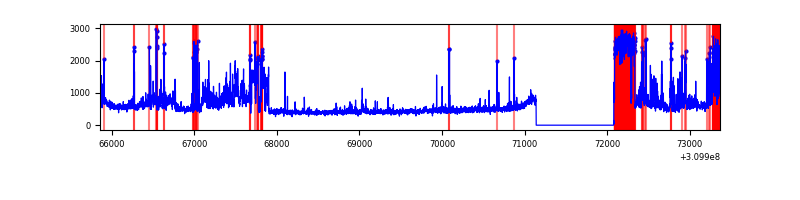 |
Top three noisy pixels from each quadrant. If the there are fewer than three noisy pixels in the level2.evt file, extra rows are filled as -1
| Pixel properties | Quadrant properties | ||||||
|---|---|---|---|---|---|---|---|
| Quadrant | DetID | PixID | Counts | Sigma | Mean | Median | Sigma |
| A | 13 | 254 | 10913 | 61.41 | 834 | 818 | 164.4 |
| A | 0 | 226 | 7180 | 38.7 | 834 | 818 | 164.4 |
| A | 3 | 137 | 6768 | 36.19 | 834 | 818 | 164.4 |
| B | 3 | 64 | 66442 | 427.1 | 827 | 807 | 153.7 |
| B | 0 | 197 | 20615 | 128.89 | 827 | 807 | 153.7 |
| B | 12 | 111 | 18090 | 112.46 | 827 | 807 | 153.7 |
| C | 14 | 238 | 127649 | 685.91 | 796 | 801 | 184.9 |
| C | 9 | 54 | 25848 | 135.44 | 796 | 801 | 184.9 |
| C | 10 | 22 | 18669 | 96.62 | 796 | 801 | 184.9 |
| D | 7 | 238 | 1115773 | 5939.12 | 782 | 760 | 187.7 |
| D | 13 | 104 | 211047 | 1120.09 | 782 | 760 | 187.7 |
| D | 1 | 52 | 118630 | 627.84 | 782 | 760 | 187.7 |
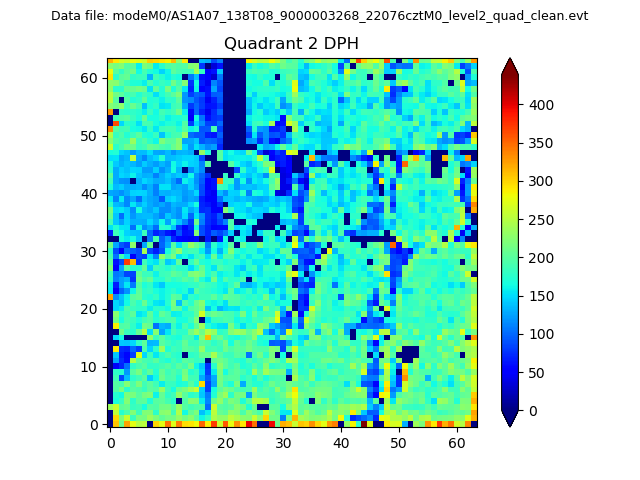
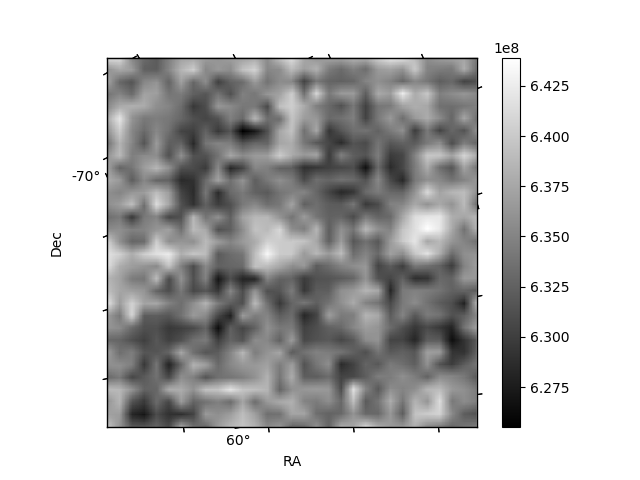
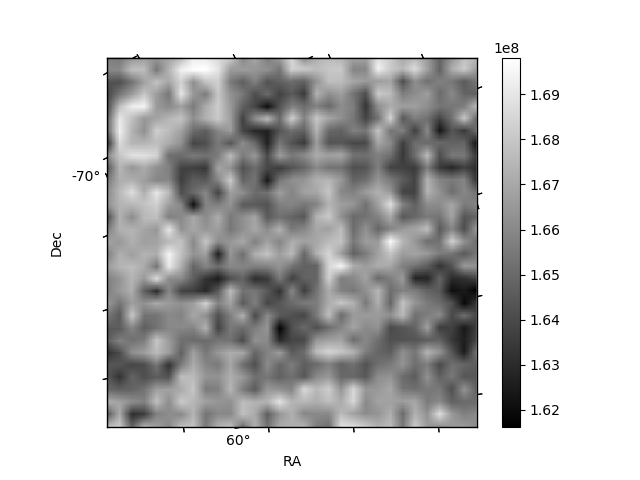
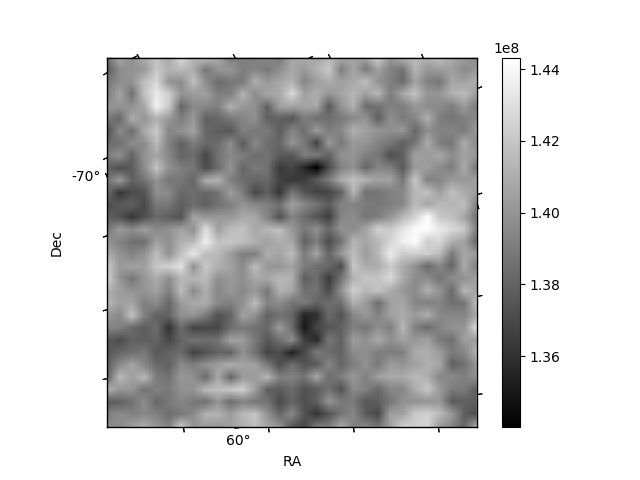
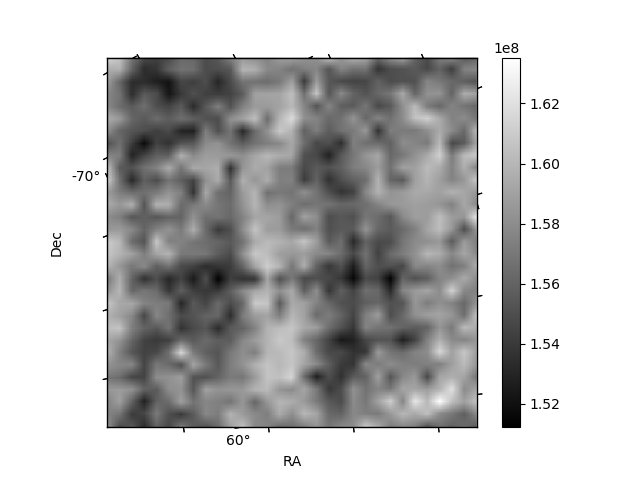
Histogram calculated using DETX and DETY for each event in the final _common_clean file
| Quadrant A | 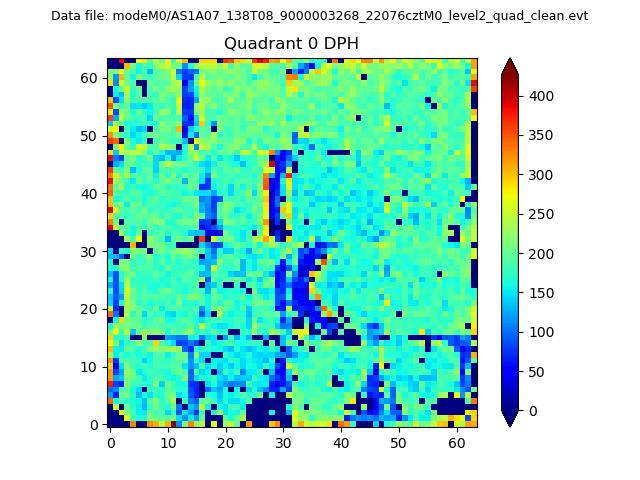 |
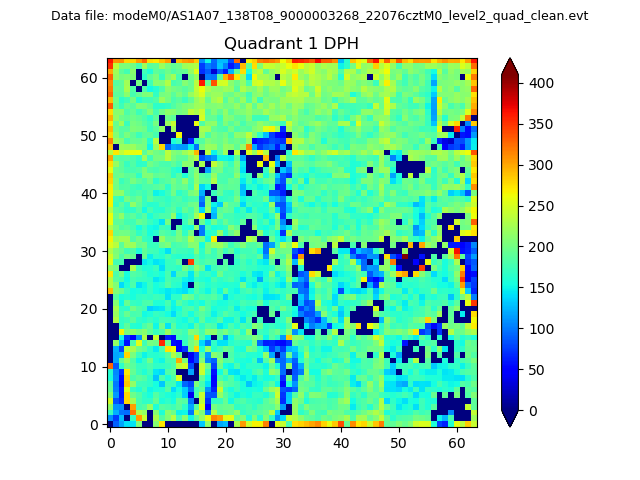 |
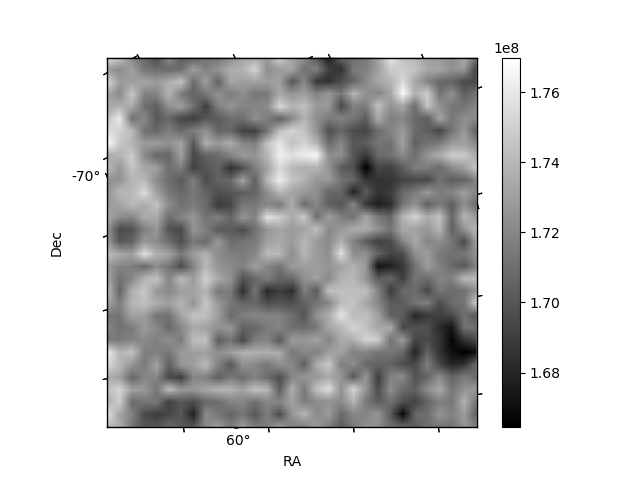
Quadrant B |
|---|---|---|---|
| Quadrant D | 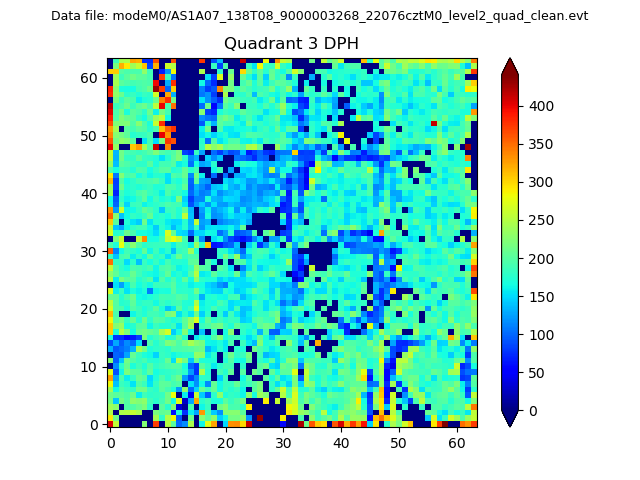 |
 |
Quadrant C |
| Plot type | Count rate plots | Images |
|---|---|---|
| Comparison with Poisson distribution Blue bars denote a histogram of data divided into 1 sec bins. Red curve is a Poisson curve with rate = median count rate of data. |
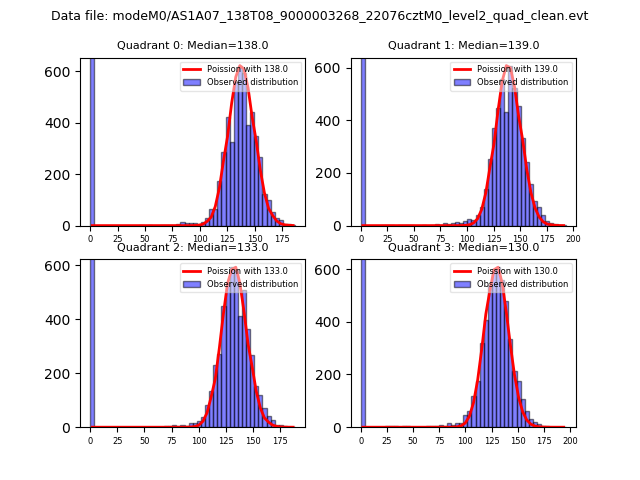 |
 |
| Quadrant-wise count rates Data is divided into 100 sec bins |
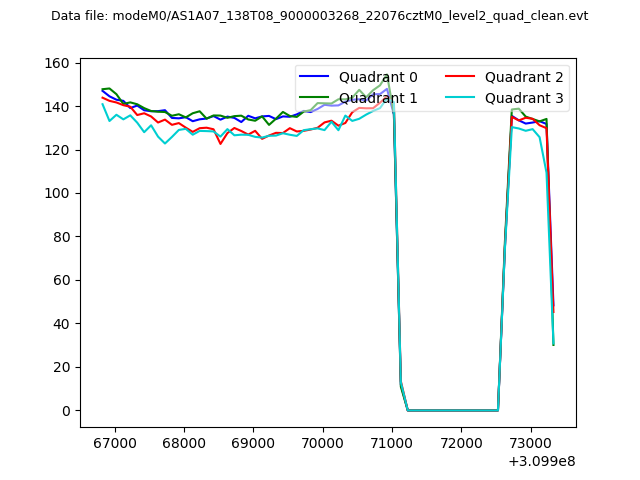 |
|
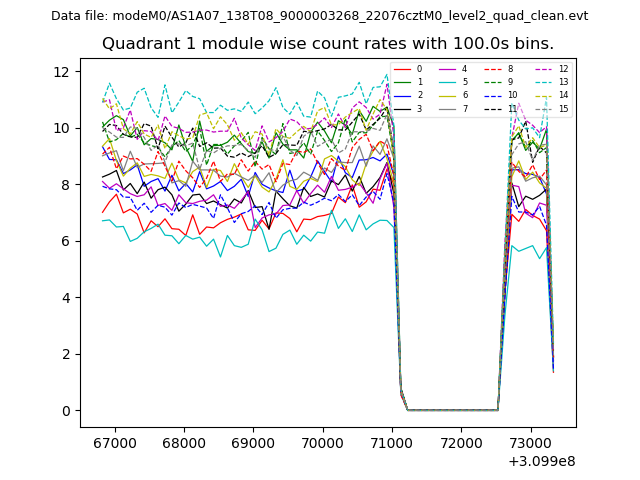
| Module-wise count rates for Quadrant A Data is divided into 100 sec bins |
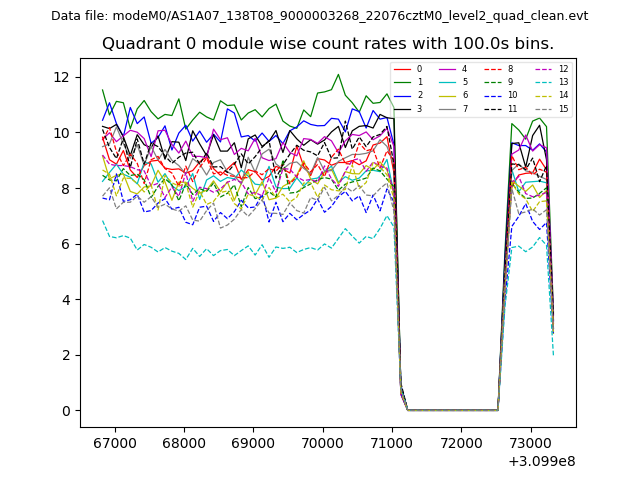 |
 |
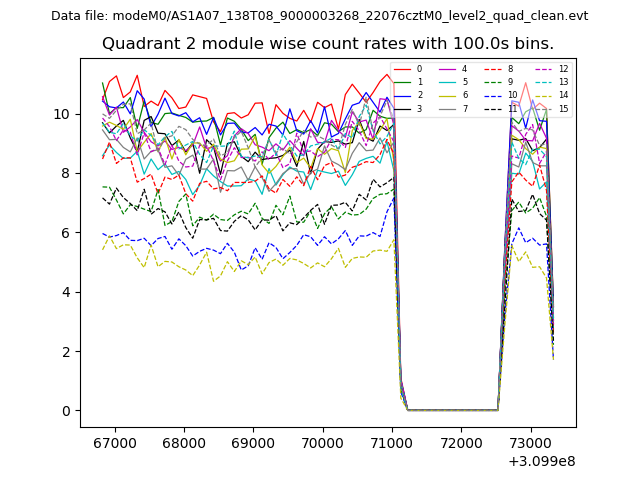
| Module-wise count rates for Quadrant B Data is divided into 100 sec bins |
 |
 |
| Module-wise count rates for Quadrant C Data is divided into 100 sec bins |
 |
 |
| Module-wise count rates for Quadrant D Data is divided into 100 sec bins |
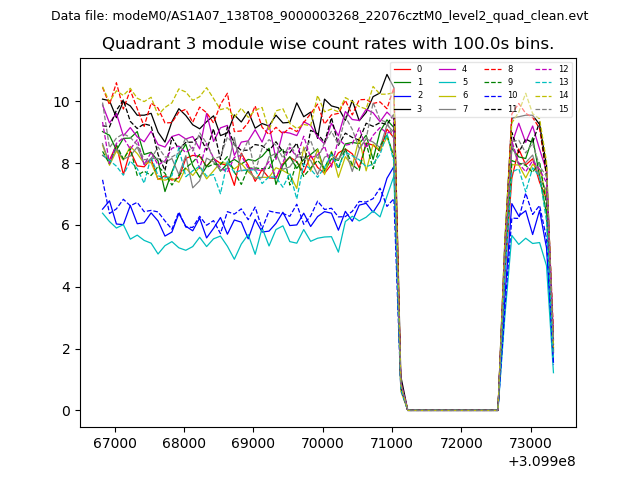 |
 |
| Parameter | Plot |
|---|---|
| CZT HV Monitor | 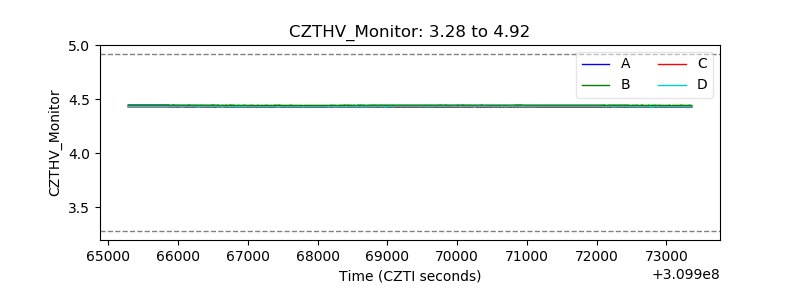 |
| D_VDD | 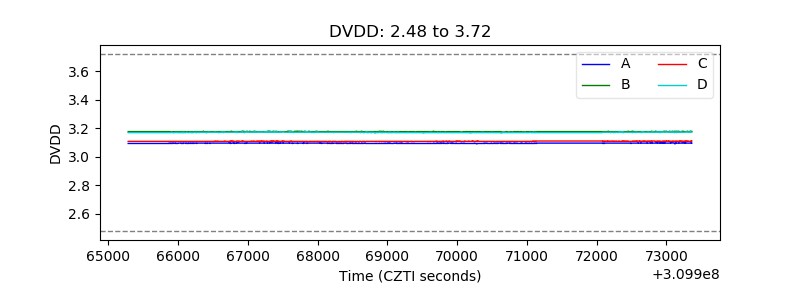 |
| Temperature 1 | 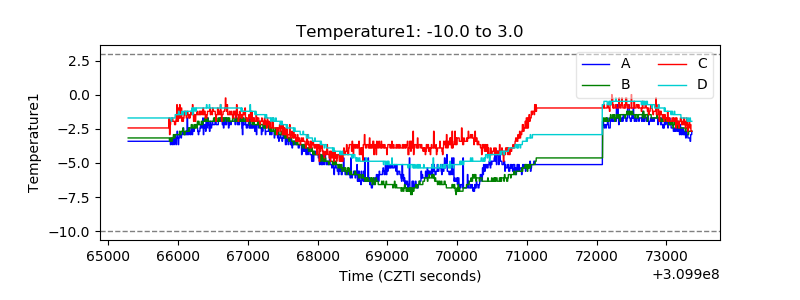 |
| Veto HV Monitor | 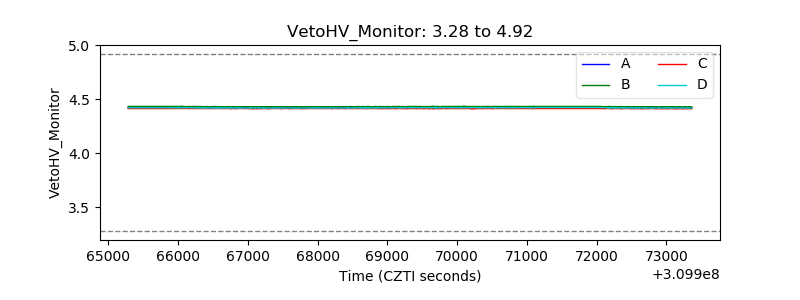 |
| Veto LLD | 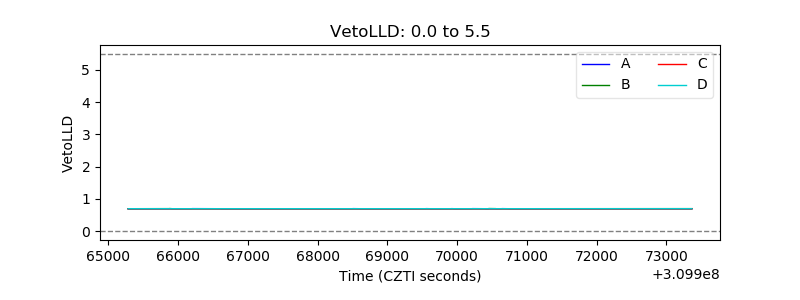 |
| Alpha Counter | 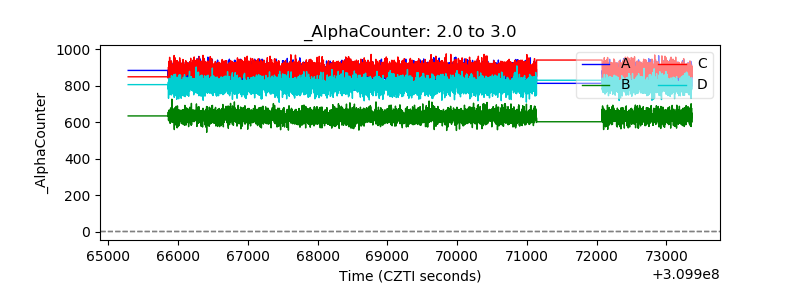 |
| _CPM_Rate | 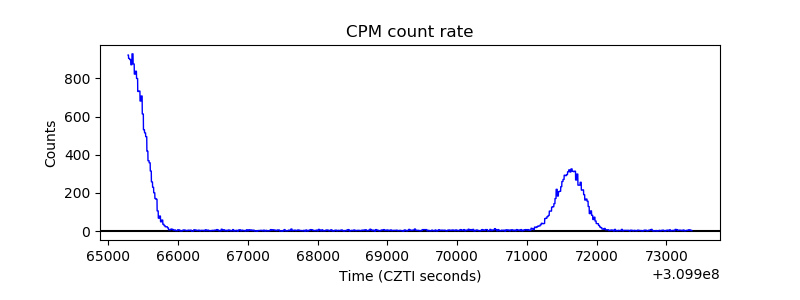 |
| CZT Counter | 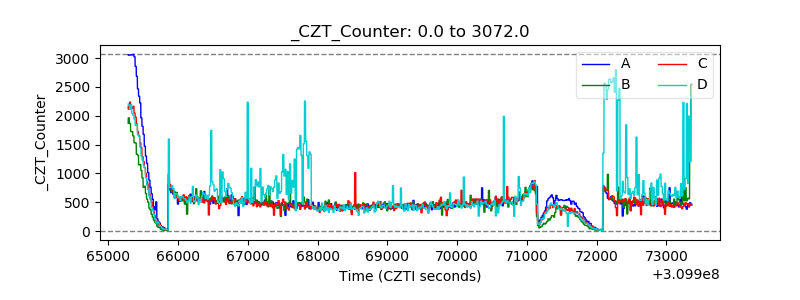 |
| +2.5 Volts monitor |  |
| +5 Volts monitor |  |
| _ROLL_ROT |  |
| _Roll_DEC |  |
| _Roll_RA | 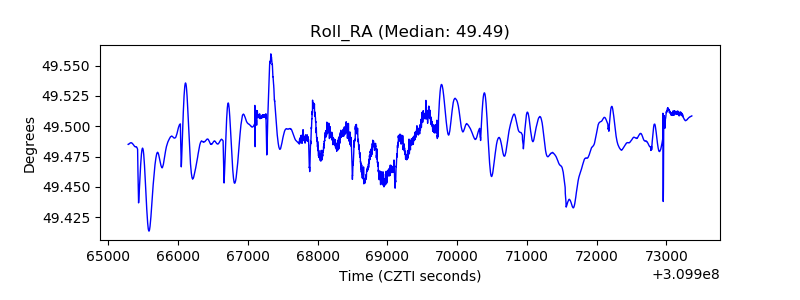 |
| Veto Counter | 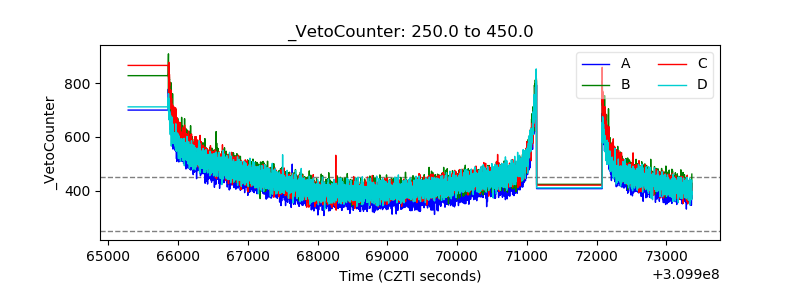 |