| Param | Original file | Final file |
|---|---|---|
| Filename | modeM0/AS1A07_138T08_9000003268_22082cztM0_level2.evt | modeM0/AS1A07_138T08_9000003268_22082cztM0_level2_quad_clean.evt |
| Size (bytes) | 2,571,995,520 | 469,468,800 |
| Size | 2.4 GB | 447.7 MB |
| Events in quadrant A | 16,329,160 | 3,022,585 |
| Events in quadrant B | 17,113,866 | 3,067,911 |
| Events in quadrant C | 18,135,281 | 2,911,121 |
| Events in quadrant D | 23,927,603 | 2,788,072 |
| Mode SS | |||
|---|---|---|---|
| Quadrant | BADHDUFLAG | Total packets | Discarded packets |
| A | 0 | 722 | 0 |
| B | 0 | 722 | 0 |
| C | 0 | 722 | 0 |
| D | 0 | 722 | 0 |
| Mode M9 | |||
|---|---|---|---|
| Quadrant | BADHDUFLAG | Total packets | Discarded packets |
| A | 0 | 30 | 0 |
| B | 0 | 30 | 0 |
| C | 0 | 30 | 0 |
| D | 0 | 30 | 0 |
| Mode M0 | |||
|---|---|---|---|
| Quadrant | BADHDUFLAG | Total packets | Discarded packets |
| A | 0 | 72168 | 0 |
| B | 0 | 73848 | 0 |
| C | 0 | 77331 | 0 |
| D | 0 | 95316 | 0 |
| Quadrant | Total seconds | Saturated seconds | Saturation percentage |
|---|---|---|---|
| A | 35369 | 171 | 0.483474% |
| B | 35370 | 292 | 0.825558% |
| C | 35370 | 422 | 1.193101% |
| D | 35369 | 1822 | 5.151404% |
Noise dominated data is calculated using 1-second bins in cleaned event files. If a bin has >2000 counts, and if more than 50% of those come from <1% of pixels, then it is considered to be noise-dominated and hence unusable.
| Quadrant | # 1 sec bins | Bins with >0 counts | Bins with >2000 counts | High rate bins dominated by noise | Noise dominated (total time) | Noise dominated (detector-on time) | Marked lightcurve |
|---|---|---|---|---|---|---|---|
| A | 38499 | 35375 | 1 | 1 | 0.00% | 0.00% | 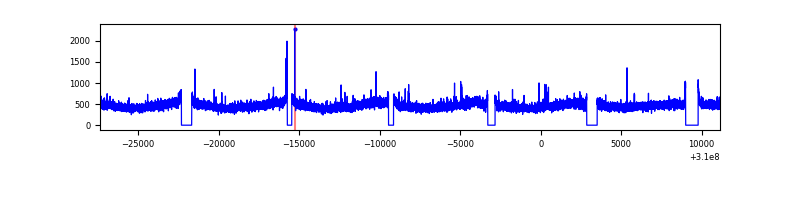 |
| B | 38500 | 35376 | 48 | 48 | 0.12% | 0.14% | 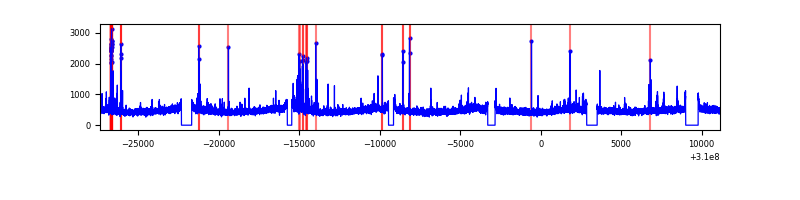 |
| C | 38500 | 35376 | 45 | 45 | 0.12% | 0.13% | 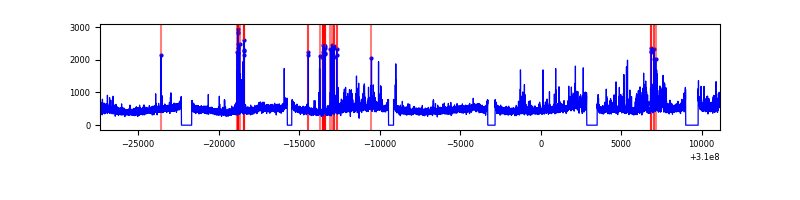 |
| D | 38499 | 35375 | 1592 | 1592 | 4.14% | 4.50% | 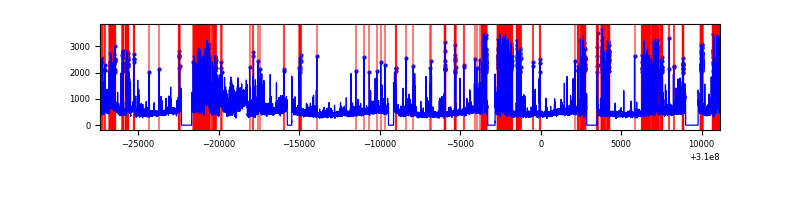 |
Top three noisy pixels from each quadrant. If the there are fewer than three noisy pixels in the level2.evt file, extra rows are filled as -1
| Pixel properties | Quadrant properties | ||||||
|---|---|---|---|---|---|---|---|
| Quadrant | DetID | PixID | Counts | Sigma | Mean | Median | Sigma |
| A | 13 | 254 | 57819 | 63.73 | 4216 | 4130 | 842.4 |
| A | 14 | 235 | 43292 | 46.49 | 4216 | 4130 | 842.4 |
| A | 0 | 226 | 36369 | 38.27 | 4216 | 4130 | 842.4 |
| B | 3 | 64 | 140695 | 173.3 | 4211 | 4107 | 788.2 |
| B | 0 | 190 | 136432 | 167.89 | 4211 | 4107 | 788.2 |
| B | 0 | 228 | 136289 | 167.71 | 4211 | 4107 | 788.2 |
| C | 0 | 239 | 1346721 | 1430.28 | 4046 | 4061 | 938.7 |
| C | 14 | 238 | 637390 | 674.66 | 4046 | 4061 | 938.7 |
| C | 9 | 54 | 340980 | 358.9 | 4046 | 4061 | 938.7 |
| D | 1 | 52 | 6171657 | 6393.44 | 4016 | 3909 | 964.7 |
| D | 13 | 172 | 607537 | 625.72 | 4016 | 3909 | 964.7 |
| D | 7 | 238 | 488006 | 501.81 | 4016 | 3909 | 964.7 |
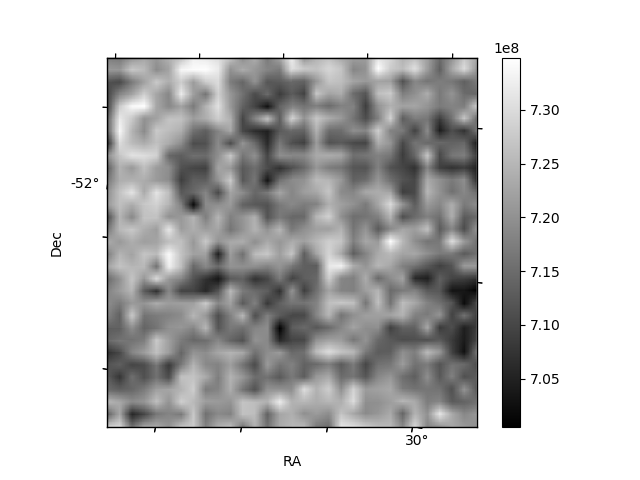
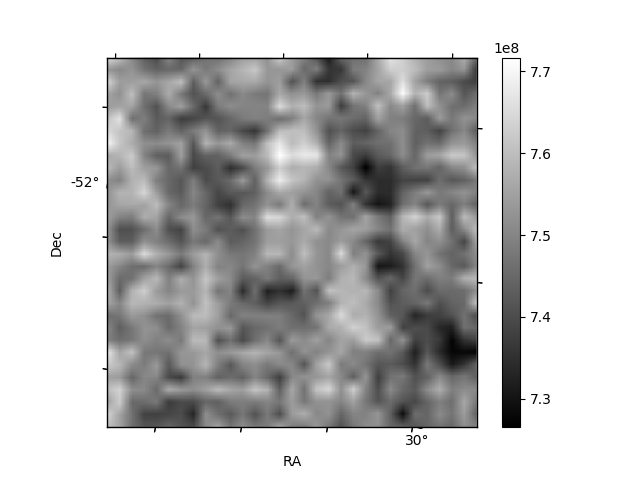
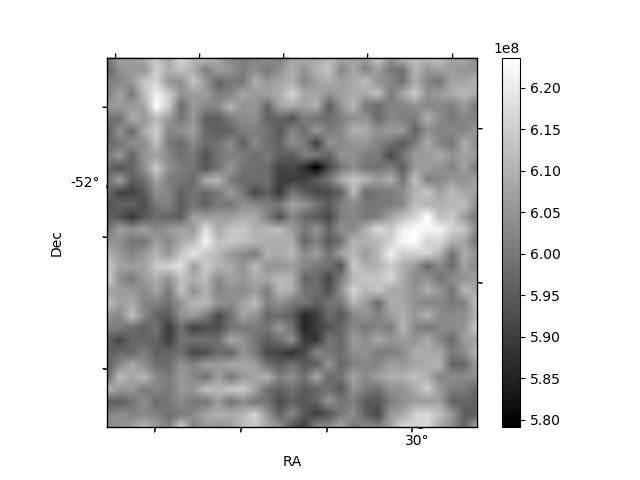
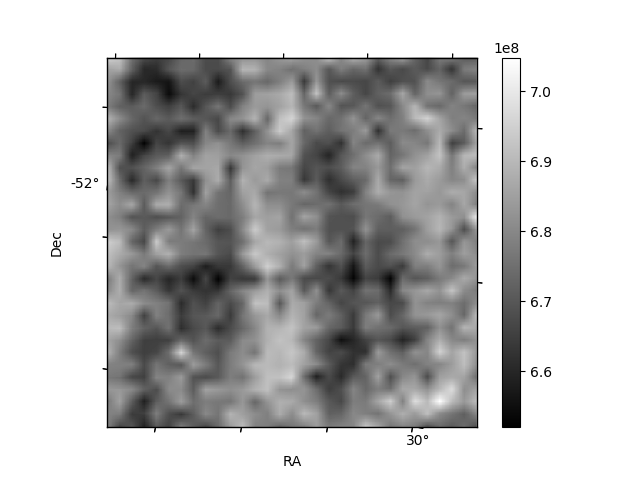
Histogram calculated using DETX and DETY for each event in the final _common_clean file
| Quadrant A |  |
 |
Quadrant B |
|---|---|---|---|
| Quadrant D |  |
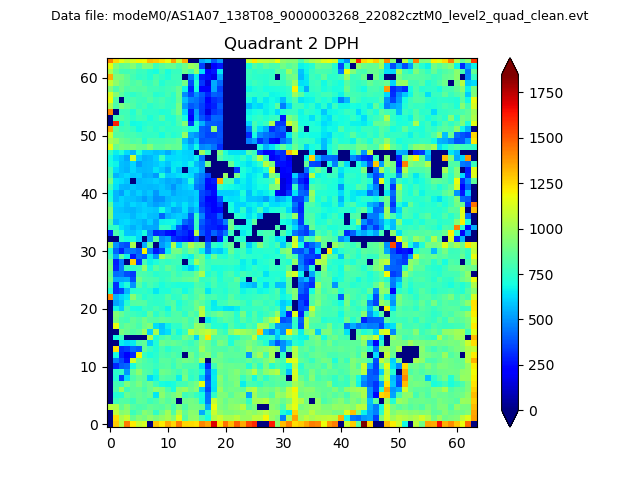 |
Quadrant C |
| Plot type | Count rate plots | Images |
|---|---|---|
| Comparison with Poisson distribution Blue bars denote a histogram of data divided into 1 sec bins. Red curve is a Poisson curve with rate = median count rate of data. |
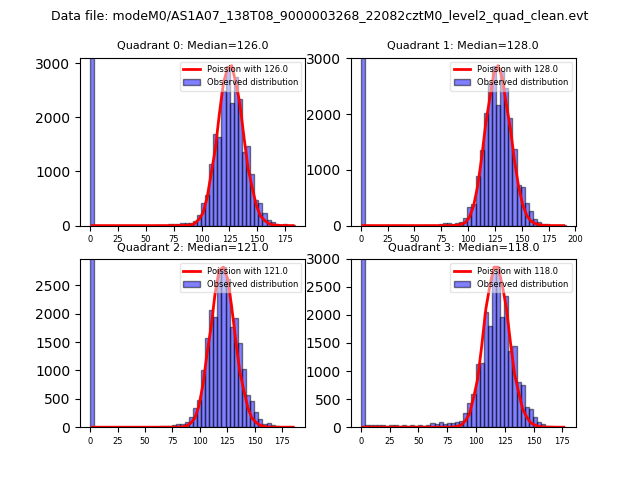 |
 |
| Quadrant-wise count rates Data is divided into 100 sec bins |
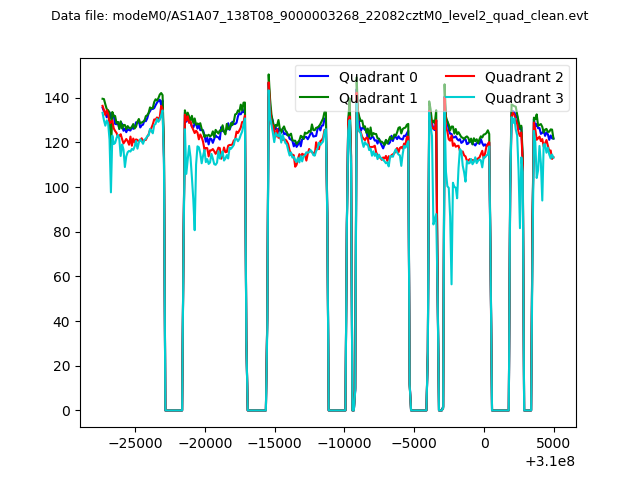 |
|
| Module-wise count rates for Quadrant A Data is divided into 100 sec bins |
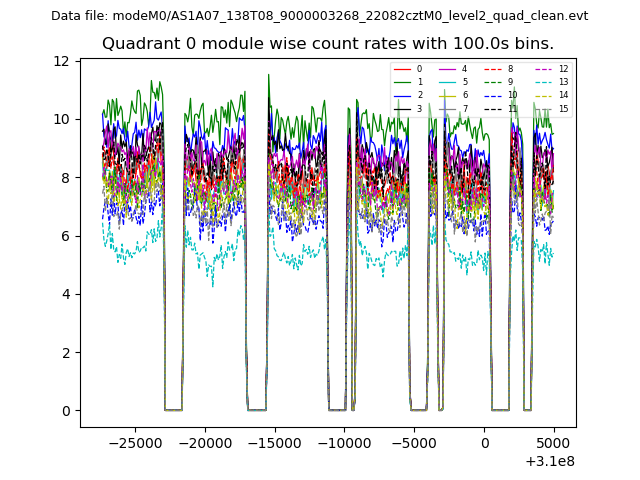 |
 |
| Module-wise count rates for Quadrant B Data is divided into 100 sec bins |
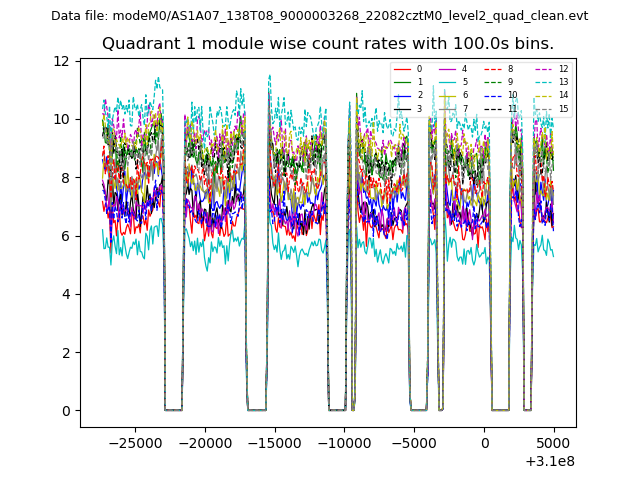 |
 |
| Module-wise count rates for Quadrant C Data is divided into 100 sec bins |
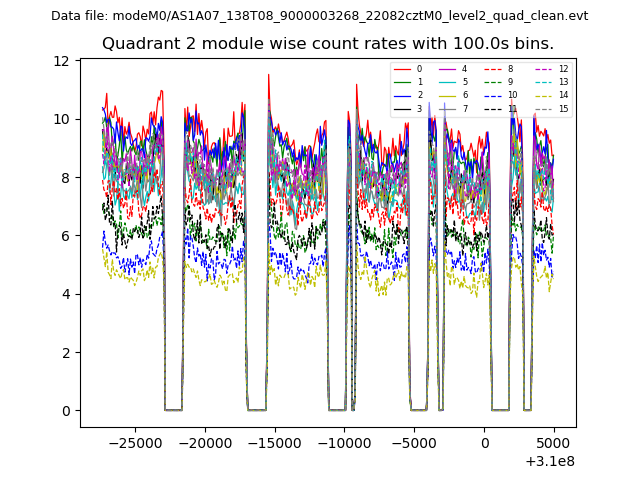 |
 |
| Module-wise count rates for Quadrant D Data is divided into 100 sec bins |
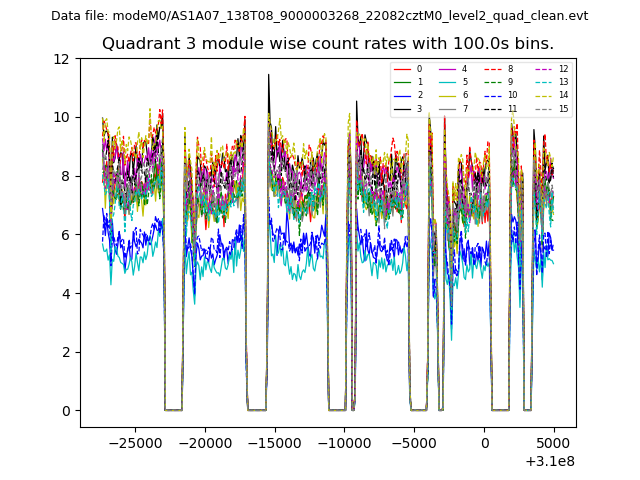 |
 |
| Parameter | Plot |
|---|---|
| CZT HV Monitor | 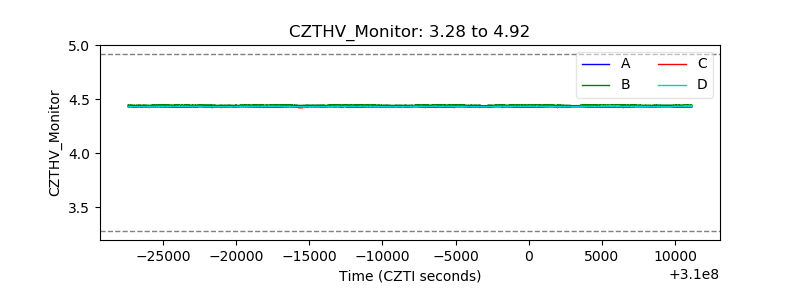 |
| D_VDD | 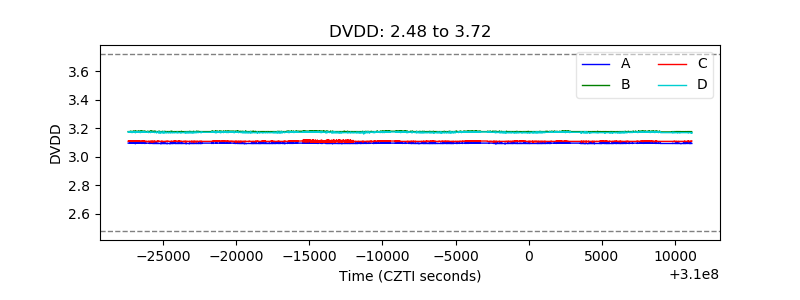 |
| Temperature 1 | 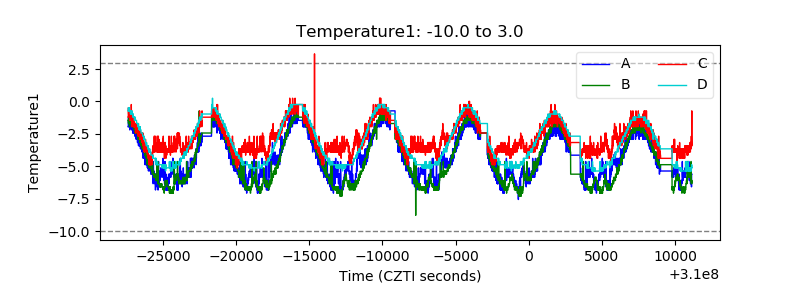 |
| Veto HV Monitor | 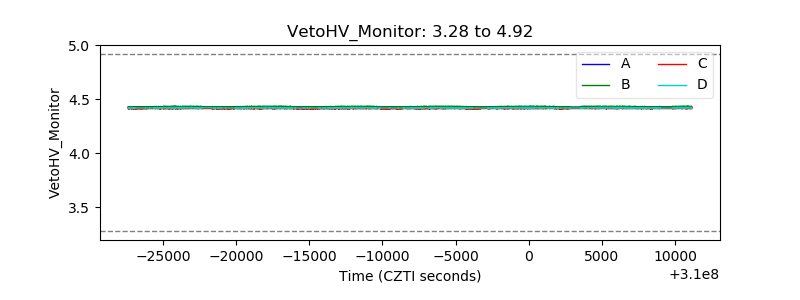 |
| Veto LLD | 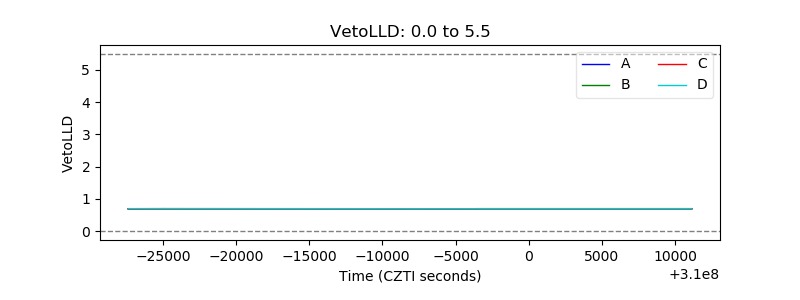 |
| Alpha Counter | 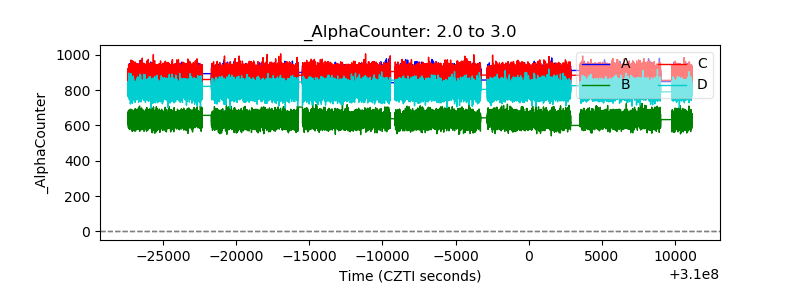 |
| _CPM_Rate | 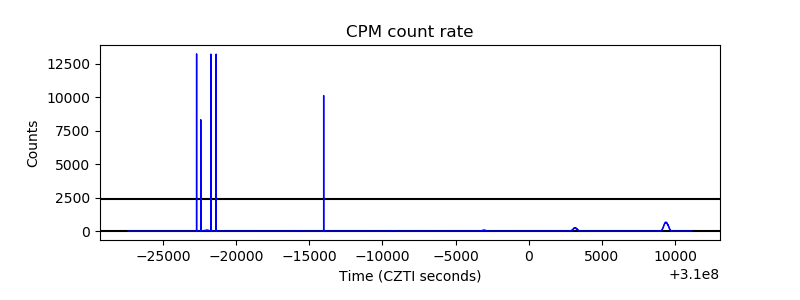 |
| CZT Counter | 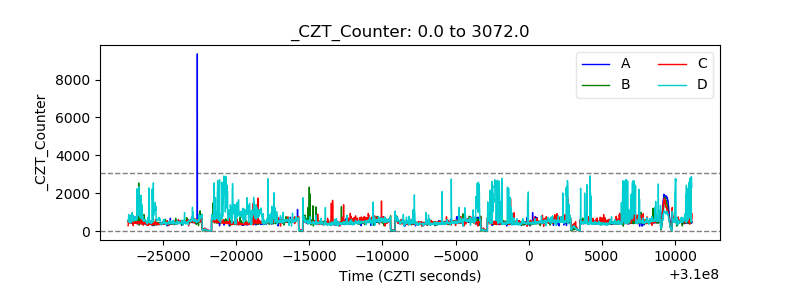 |
| +2.5 Volts monitor |  |
| +5 Volts monitor | 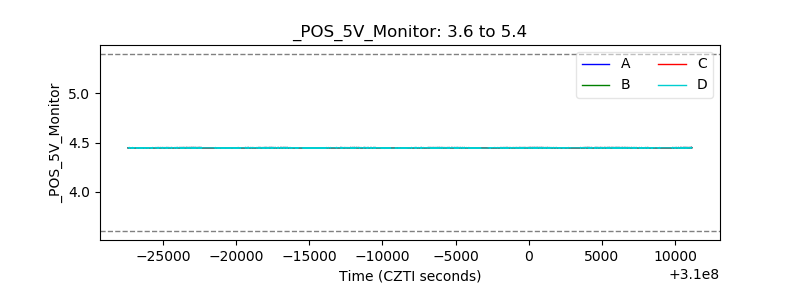 |
| _ROLL_ROT | 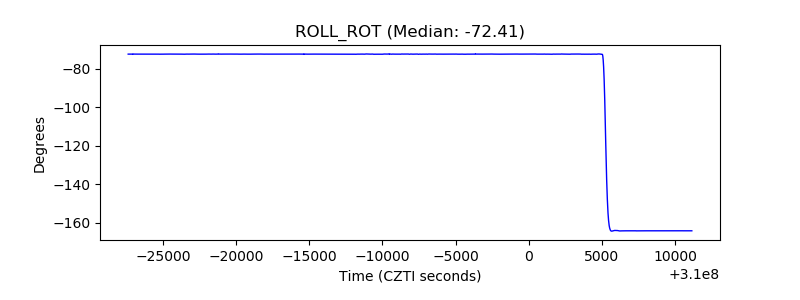 |
| _Roll_DEC | 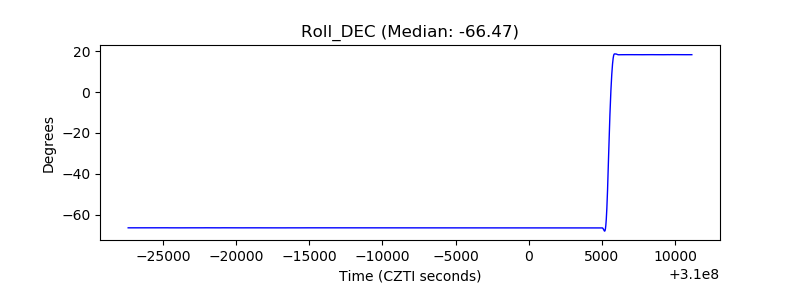 |
| _Roll_RA | 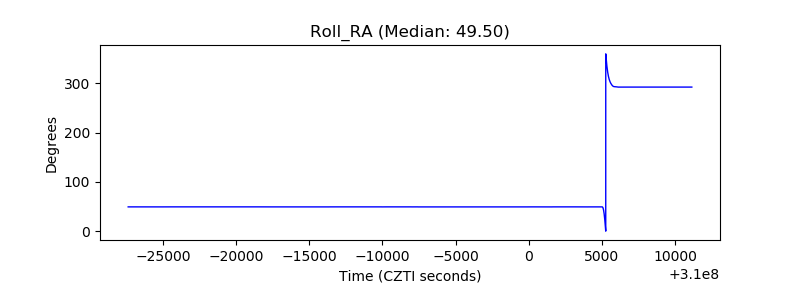 |
| Veto Counter | 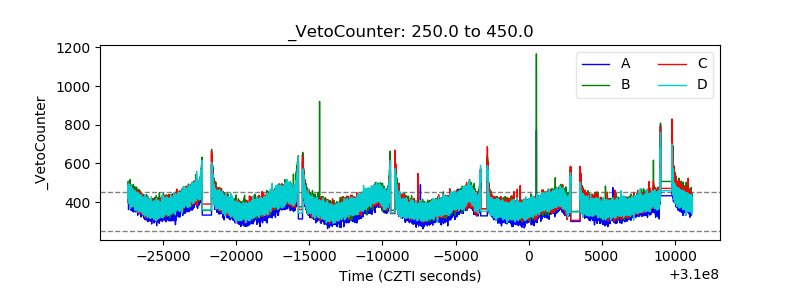 |