| Param | Original file | Final file |
|---|---|---|
| Filename | modeM0/AS1A07_007T05_9000003274cztM0_level2.fits | modeM0/AS1A07_007T05_9000003274cztM0_level2_quad_clean.evt |
| Size (bytes) | 512,147,520 | 434,355,840 |
| Size | 488.4 MB | 414.2 MB |
| Events in quadrant A | 3,214,362 | 2,550,611 |
| Events in quadrant B | 3,068,002 | 2,554,313 |
| Events in quadrant C | 3,066,768 | 2,411,007 |
| Events in quadrant D | 2,619,408 | 2,095,723 |
| Mode SS | |||
|---|---|---|---|
| Quadrant | BADHDUFLAG | Total packets | Discarded packets |
| A | 0 | 1050 | 0 |
| B | 0 | 1050 | 0 |
| C | 0 | 1050 | 0 |
| D | 0 | 1050 | 0 |
| Mode M9 | |||
|---|---|---|---|
| Quadrant | BADHDUFLAG | Total packets | Discarded packets |
| A | 0 | 76 | 0 |
| B | 0 | 76 | 0 |
| C | 0 | 76 | 0 |
| D | 0 | 76 | 0 |
| Mode M0 | |||
|---|---|---|---|
| Quadrant | BADHDUFLAG | Total packets | Discarded packets |
| A | 0 | 107176 | 0 |
| B | 0 | 108879 | 0 |
| C | 0 | 107783 | 0 |
| D | 0 | 144900 | 0 |
| Quadrant | Total seconds | Saturated seconds | Saturation percentage |
|---|---|---|---|
| A | 51605 | 315 | 0.610406% |
| B | 51605 | 461 | 0.893324% |
| C | 51605 | 591 | 1.145238% |
| D | 51605 | 3761 | 7.288053% |
Noise dominated data is calculated using 1-second bins in cleaned event files. If a bin has >2000 counts, and if more than 50% of those come from <1% of pixels, then it is considered to be noise-dominated and hence unusable.
| Quadrant | # 1 sec bins | Bins with >0 counts | Bins with >2000 counts | High rate bins dominated by noise | Noise dominated (total time) | Noise dominated (detector-on time) | Marked lightcurve |
|---|---|---|---|---|---|---|---|
| A | 59185 | 51605 | 0 | 0 | 0.00% | 0.00% |  |
| B | 59185 | 51599 | 0 | 0 | 0.00% | 0.00% |  |
| C | 59184 | 51604 | 0 | 0 | 0.00% | 0.00% | 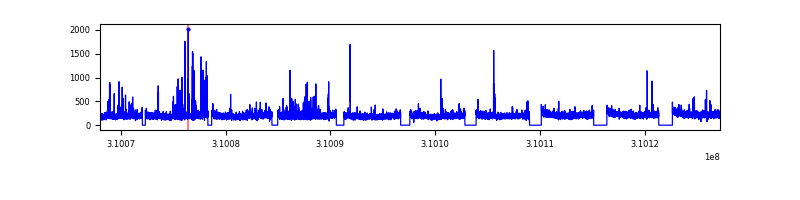 |
| D | 59185 | 51595 | 0 | 0 | 0.00% | 0.00% |  |
Top three noisy pixels from each quadrant. If the there are fewer than three noisy pixels in the level2.evt file, extra rows are filled as -1
| Pixel properties | Quadrant properties | ||||||
|---|---|---|---|---|---|---|---|
| Quadrant | DetID | PixID | Counts | Sigma | Mean | Median | Sigma |
| A | 0 | 29 | 3048 | 11.16 | 835 | 784 | 202.9 |
| A | 7 | 110 | 2552 | 8.71 | 835 | 784 | 202.9 |
| A | 0 | 30 | 2392 | 7.92 | 835 | 784 | 202.9 |
| B | 2 | 9 | 2449 | 10.63 | 809 | 775 | 157.5 |
| B | 2 | 8 | 2075 | 8.26 | 809 | 775 | 157.5 |
| B | 5 | 128 | 2052 | 8.11 | 809 | 775 | 157.5 |
| C | 12 | 241 | 2135 | 6.6 | 809 | 756 | 208.9 |
| C | 3 | 234 | 2101 | 6.44 | 809 | 756 | 208.9 |
| C | 3 | 126 | 2089 | 6.38 | 809 | 756 | 208.9 |
| D | 10 | 189 | 1891 | 6.11 | 748 | 683 | 197.8 |
| D | 3 | 14 | 1888 | 6.09 | 748 | 683 | 197.8 |
| D | 6 | 231 | 1855 | 5.92 | 748 | 683 | 197.8 |
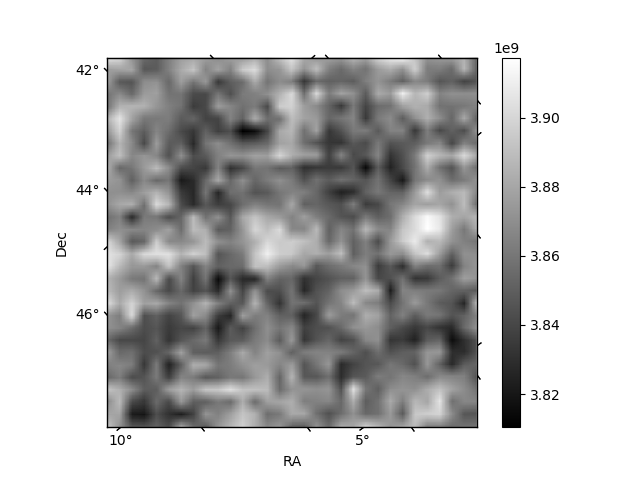
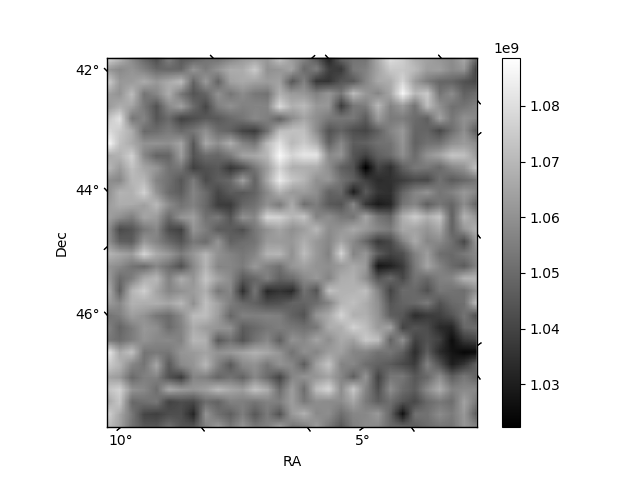
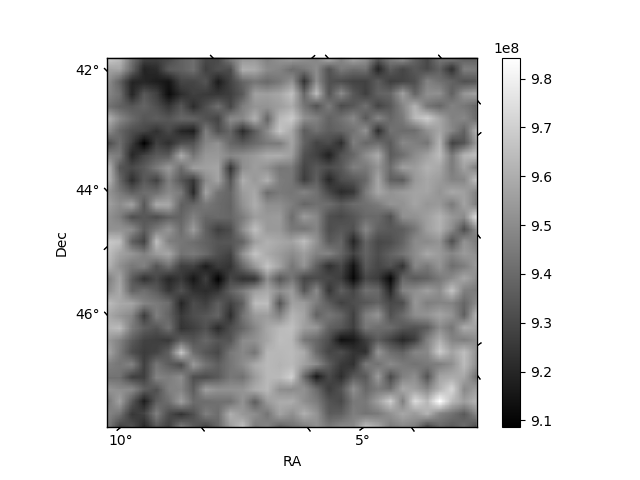
Histogram calculated using DETX and DETY for each event in the final _common_clean file
| Quadrant A | 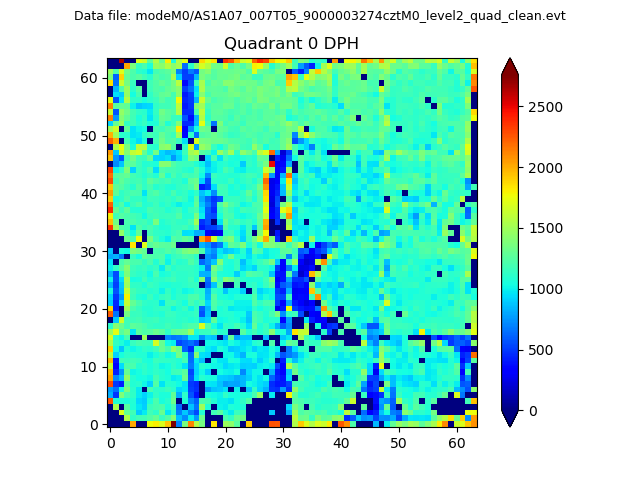 |
 |
Quadrant B |
|---|---|---|---|
| Quadrant D | 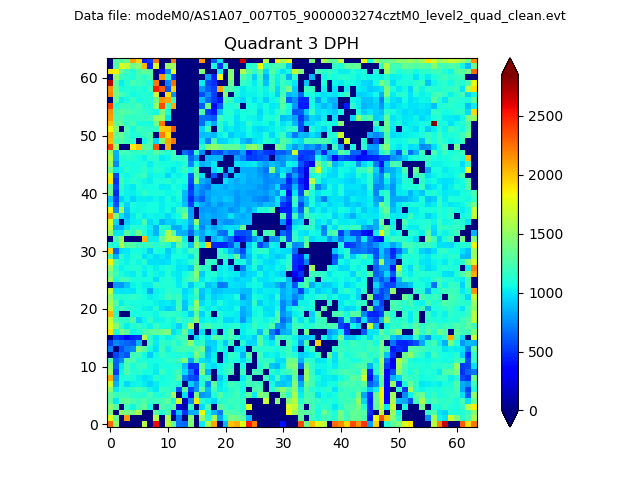 |
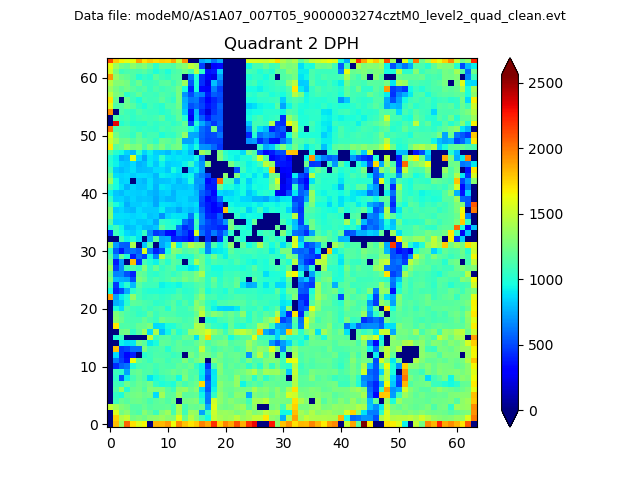 |
Quadrant C |
| Plot type | Count rate plots | Images |
|---|---|---|
| Comparison with Poisson distribution Blue bars denote a histogram of data divided into 1 sec bins. Red curve is a Poisson curve with rate = median count rate of data. |
 |
 |
| Quadrant-wise count rates Data is divided into 100 sec bins |
 |
|
| Module-wise count rates for Quadrant A Data is divided into 100 sec bins |
 |
 |
| Module-wise count rates for Quadrant B Data is divided into 100 sec bins |
 |
 |
| Module-wise count rates for Quadrant C Data is divided into 100 sec bins |
 |
 |
| Module-wise count rates for Quadrant D Data is divided into 100 sec bins |
 |
 |
| Parameter | Plot |
|---|---|
| CZT HV Monitor | 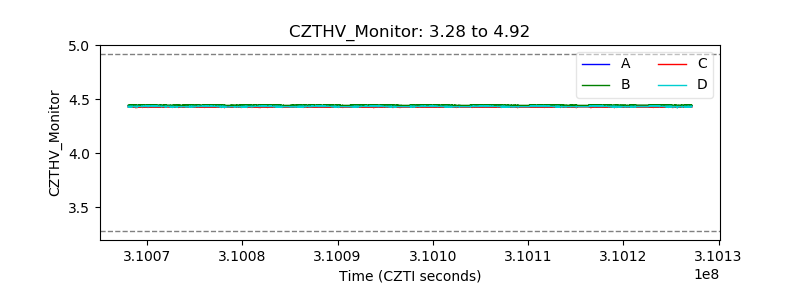 |
| D_VDD |  |
| Temperature 1 |  |
| Veto HV Monitor |  |
| Veto LLD |  |
| Alpha Counter |  |
| _CPM_Rate |  |
| CZT Counter |  |
| +2.5 Volts monitor |  |
| +5 Volts monitor |  |
| _ROLL_ROT |  |
| _Roll_DEC |  |
| _Roll_RA | 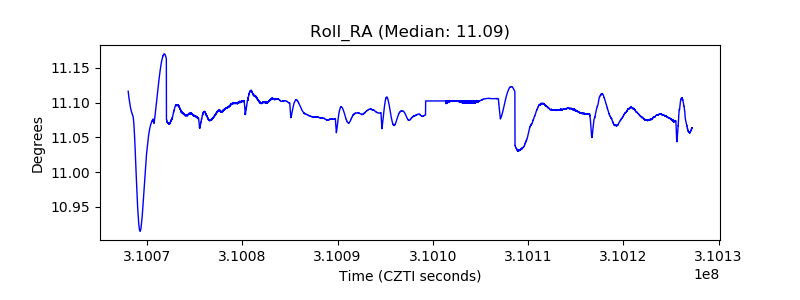 |
| Veto Counter |  |