| Param | Original file | Final file |
|---|---|---|
| Filename | modeM0/AS1A07_007T05_9000003274_22094cztM0_level2.evt | modeM0/AS1A07_007T05_9000003274_22094cztM0_level2_quad_clean.evt |
| Size (bytes) | 563,446,080 | 107,314,560 |
| Size | 537.3 MB | 102.3 MB |
| Events in quadrant A | 3,553,388 | 696,959 |
| Events in quadrant B | 3,691,736 | 705,311 |
| Events in quadrant C | 3,766,670 | 678,906 |
| Events in quadrant D | 5,543,620 | 646,961 |
| Mode SS | |||
|---|---|---|---|
| Quadrant | BADHDUFLAG | Total packets | Discarded packets |
| A | 0 | 154 | 0 |
| B | 0 | 154 | 0 |
| C | 0 | 154 | 0 |
| D | 0 | 154 | 0 |
| Mode M9 | |||
|---|---|---|---|
| Quadrant | BADHDUFLAG | Total packets | Discarded packets |
| A | 0 | 3 | 0 |
| B | 0 | 4 | 0 |
| C | 0 | 4 | 0 |
| D | 0 | 4 | 0 |
| Mode M0 | |||
|---|---|---|---|
| Quadrant | BADHDUFLAG | Total packets | Discarded packets |
| A | 0 | 15649 | 2 |
| B | 0 | 15965 | 2 |
| C | 0 | 16118 | 3 |
| D | 0 | 21628 | 2 |
| Quadrant | Total seconds | Saturated seconds | Saturation percentage |
|---|---|---|---|
| A | 7491 | 87 | 1.161394% |
| B | 7491 | 117 | 1.561874% |
| C | 7490 | 157 | 2.096128% |
| D | 7490 | 415 | 5.540721% |
Noise dominated data is calculated using 1-second bins in cleaned event files. If a bin has >2000 counts, and if more than 50% of those come from <1% of pixels, then it is considered to be noise-dominated and hence unusable.
| Quadrant | # 1 sec bins | Bins with >0 counts | Bins with >2000 counts | High rate bins dominated by noise | Noise dominated (total time) | Noise dominated (detector-on time) | Marked lightcurve |
|---|---|---|---|---|---|---|---|
| A | 7851 | 7492 | 3 | 3 | 0.04% | 0.04% | 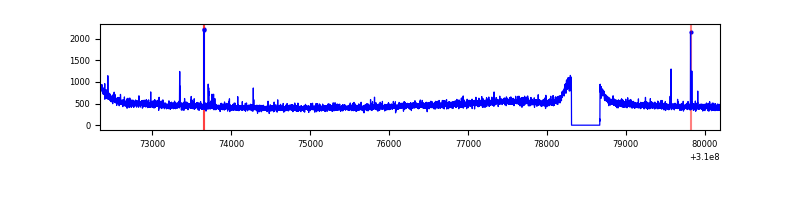 |
| B | 7851 | 7492 | 4 | 4 | 0.05% | 0.05% | 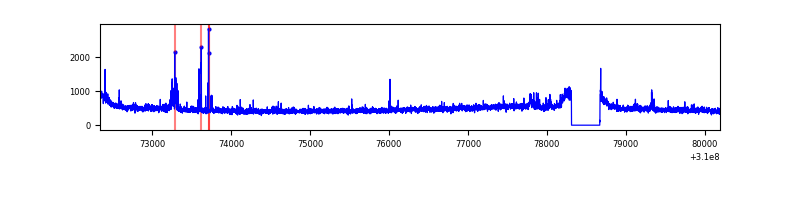 |
| C | 7850 | 7491 | 5 | 5 | 0.06% | 0.07% | 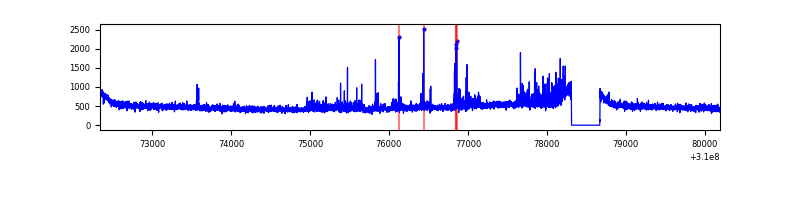 |
| D | 7850 | 7491 | 255 | 255 | 3.25% | 3.40% | 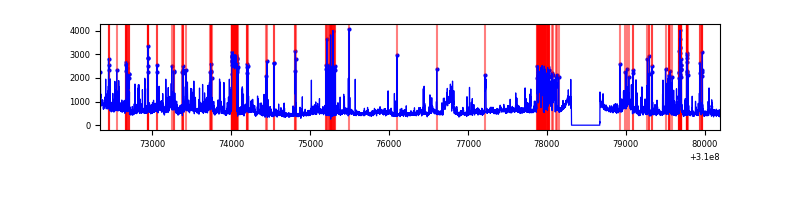 |
Top three noisy pixels from each quadrant. If the there are fewer than three noisy pixels in the level2.evt file, extra rows are filled as -1
| Pixel properties | Quadrant properties | ||||||
|---|---|---|---|---|---|---|---|
| Quadrant | DetID | PixID | Counts | Sigma | Mean | Median | Sigma |
| A | 15 | 174 | 29700 | 155.73 | 913 | 892 | 185.0 |
| A | 13 | 254 | 12812 | 64.44 | 913 | 892 | 185.0 |
| A | 0 | 226 | 7994 | 38.39 | 913 | 892 | 185.0 |
| B | 0 | 190 | 69811 | 397.36 | 908 | 884 | 173.5 |
| B | 3 | 64 | 30352 | 169.88 | 908 | 884 | 173.5 |
| B | 12 | 111 | 21146 | 116.81 | 908 | 884 | 173.5 |
| C | 0 | 239 | 192352 | 913.4 | 881 | 886 | 209.6 |
| C | 14 | 238 | 137293 | 650.74 | 881 | 886 | 209.6 |
| C | 13 | 61 | 6266 | 25.66 | 881 | 886 | 209.6 |
| D | 1 | 52 | 1876557 | 8771.27 | 878 | 853 | 213.8 |
| D | 2 | 16 | 99984 | 463.56 | 878 | 853 | 213.8 |
| D | 13 | 172 | 85530 | 395.97 | 878 | 853 | 213.8 |
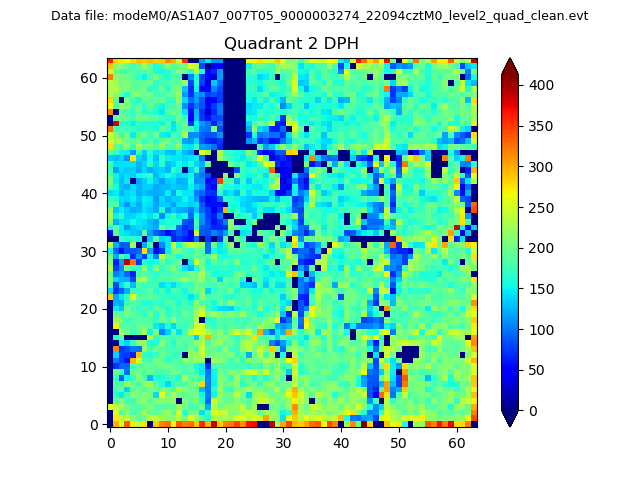
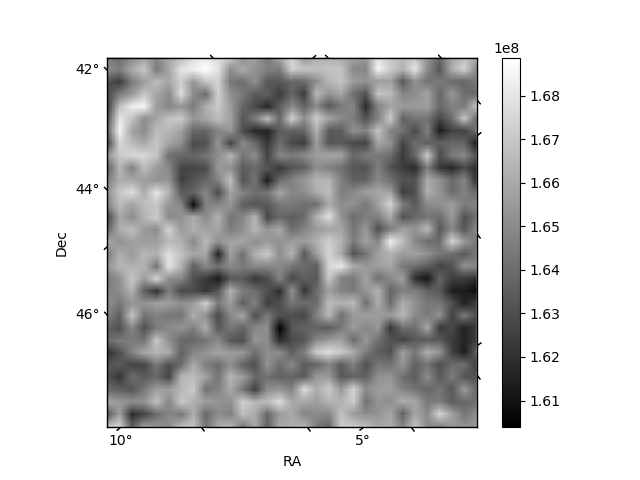
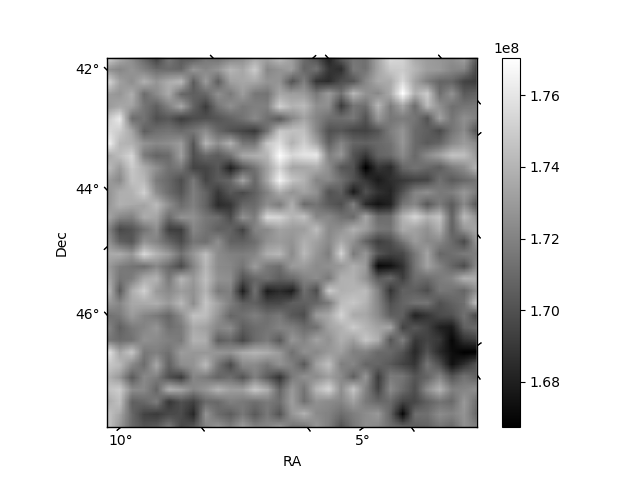
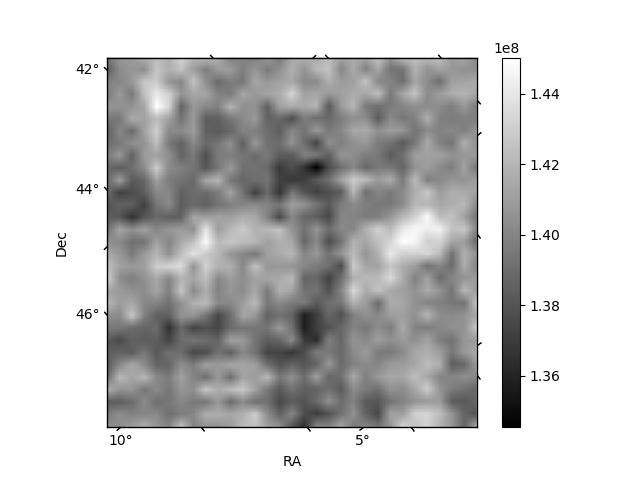
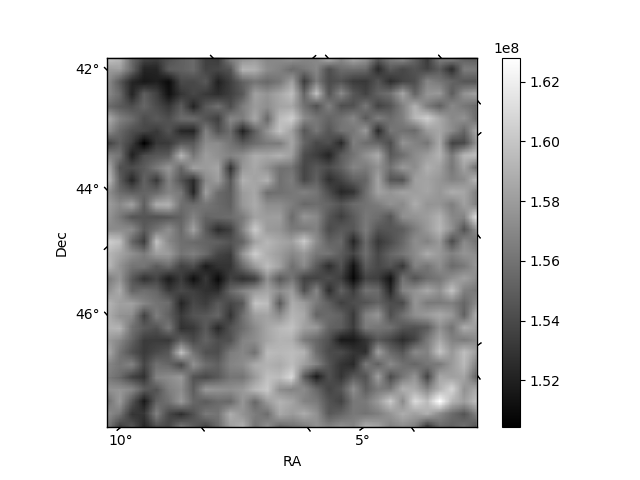
Histogram calculated using DETX and DETY for each event in the final _common_clean file
| Quadrant A |  |
 |
Quadrant B |
|---|---|---|---|
| Quadrant D |  |
 |
Quadrant C |
| Plot type | Count rate plots | Images |
|---|---|---|
| Comparison with Poisson distribution Blue bars denote a histogram of data divided into 1 sec bins. Red curve is a Poisson curve with rate = median count rate of data. |
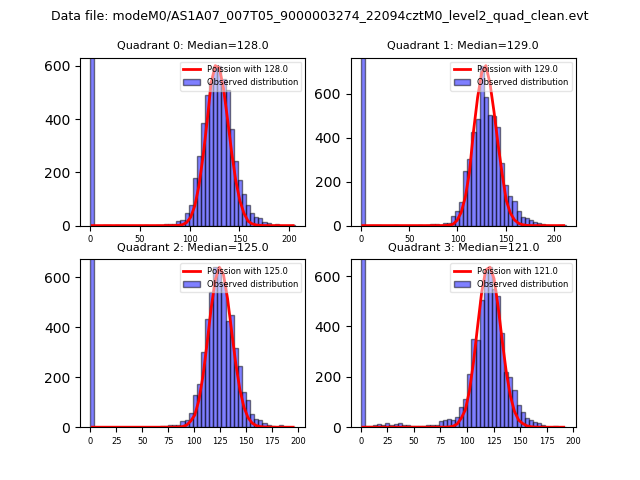 |
 |
| Quadrant-wise count rates Data is divided into 100 sec bins |
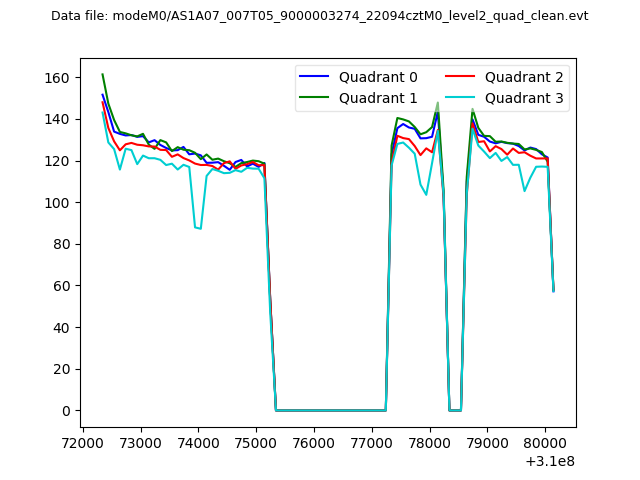 |
|
| Module-wise count rates for Quadrant A Data is divided into 100 sec bins |
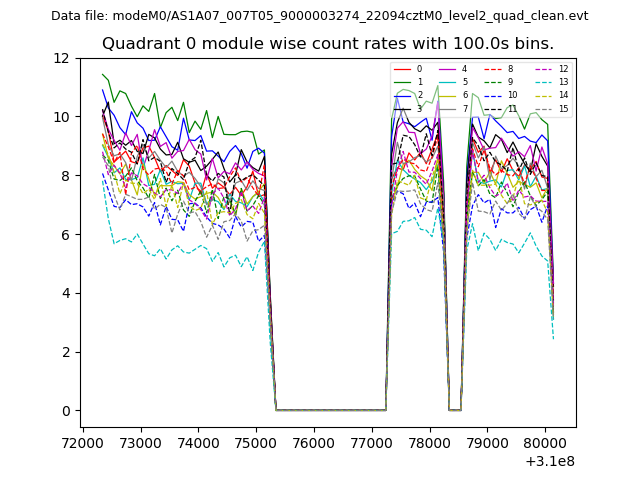 |
 |
| Module-wise count rates for Quadrant B Data is divided into 100 sec bins |
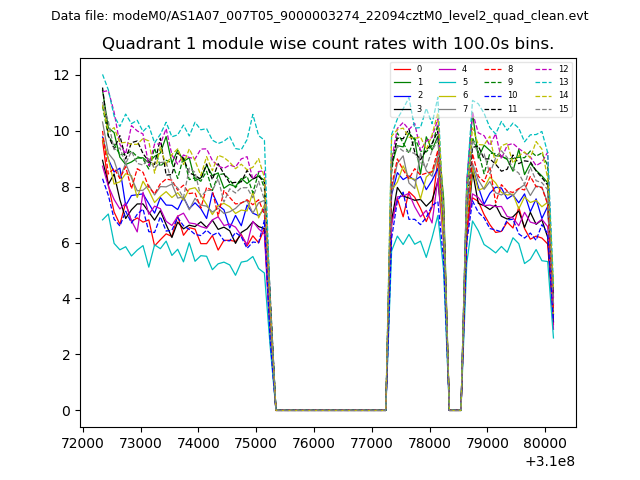 |
 |
| Module-wise count rates for Quadrant C Data is divided into 100 sec bins |
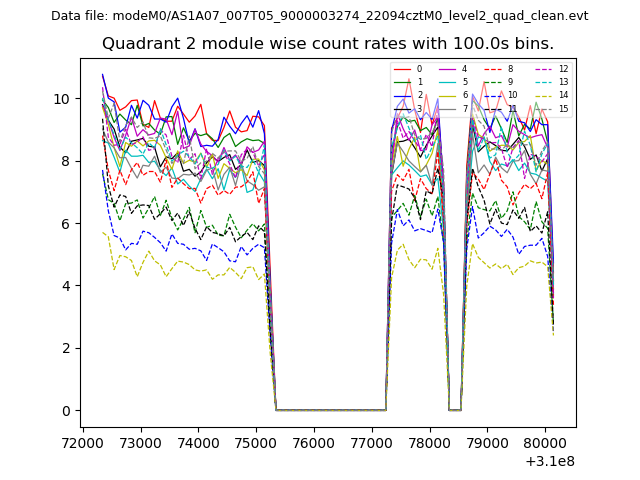 |
 |
| Module-wise count rates for Quadrant D Data is divided into 100 sec bins |
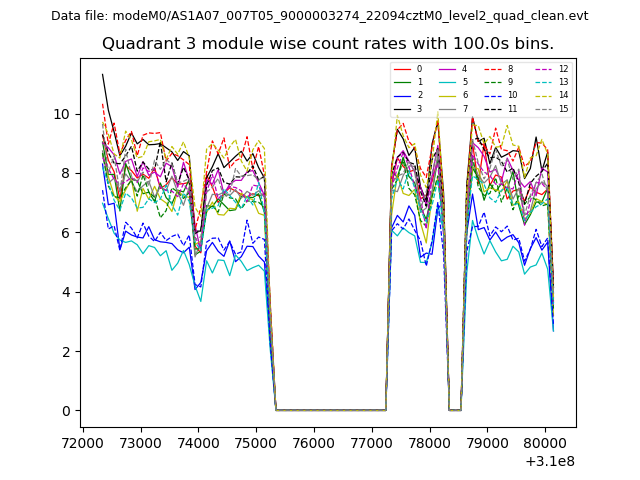 |
 |
| Parameter | Plot |
|---|---|
| CZT HV Monitor | 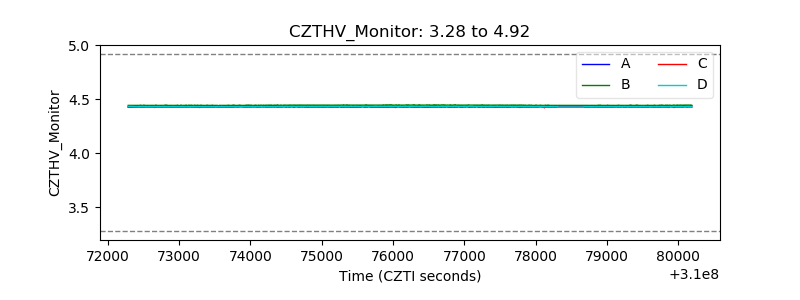 |
| D_VDD | 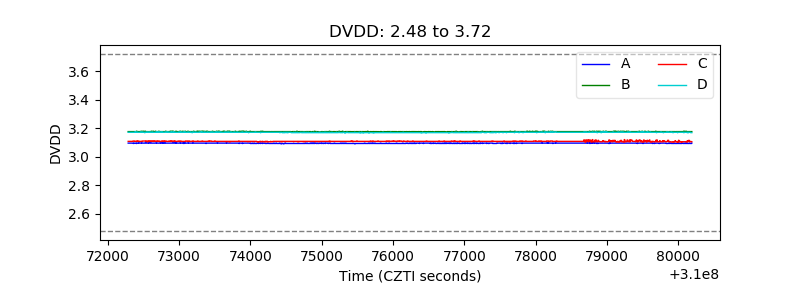 |
| Temperature 1 | 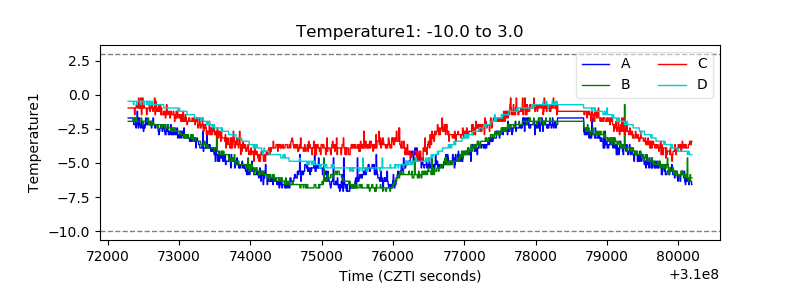 |
| Veto HV Monitor | 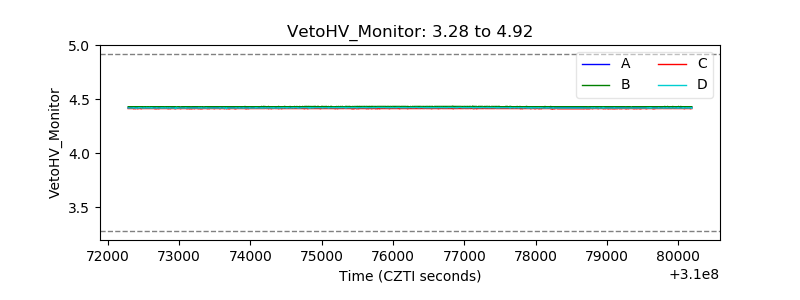 |
| Veto LLD | 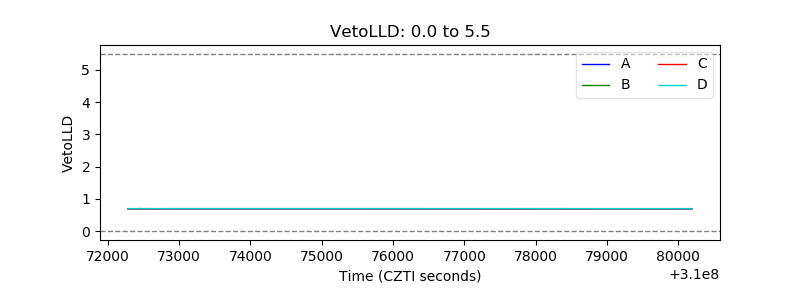 |
| Alpha Counter | 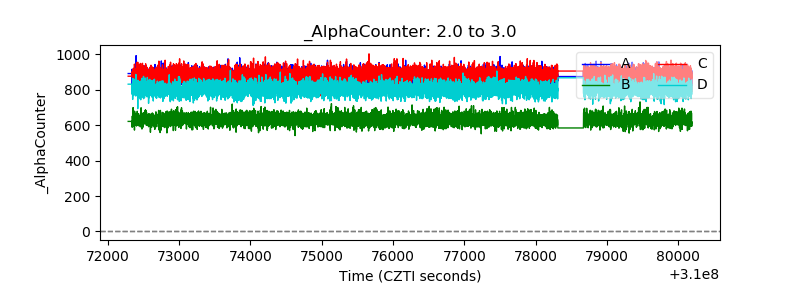 |
| _CPM_Rate | 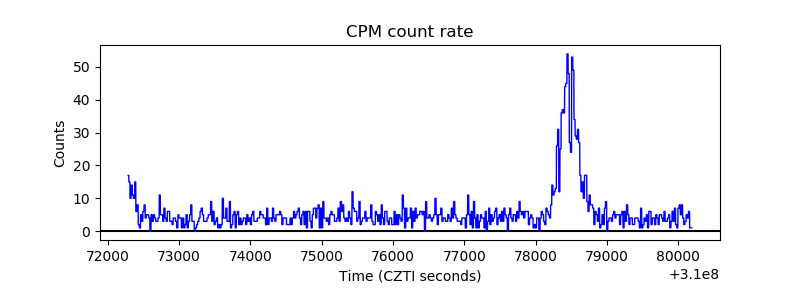 |
| CZT Counter | 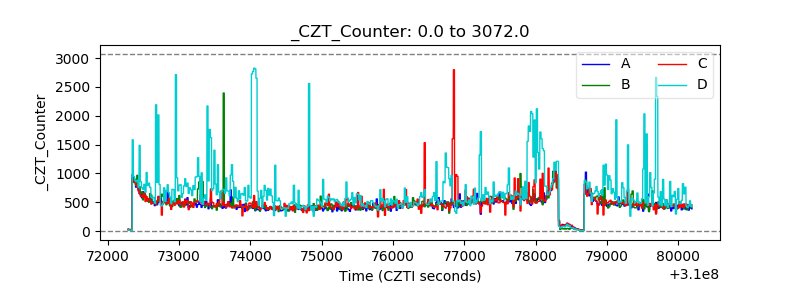 |
| +2.5 Volts monitor |  |
| +5 Volts monitor | 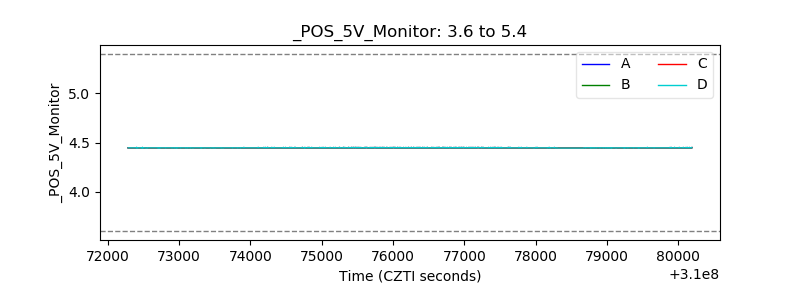 |
| _ROLL_ROT | 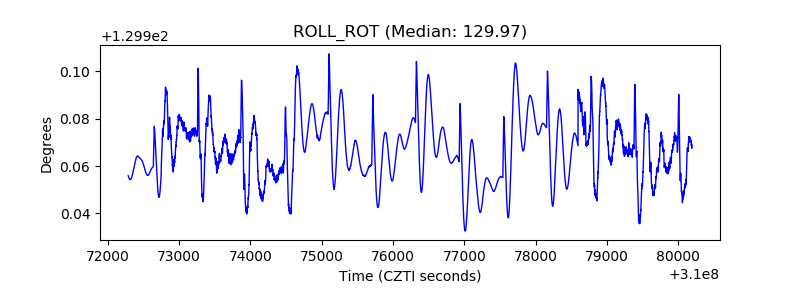 |
| _Roll_DEC | 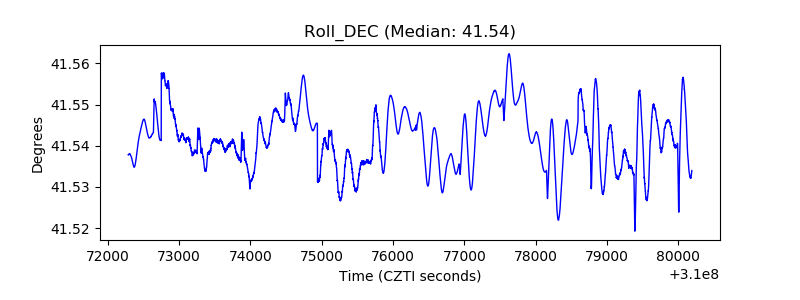 |
| _Roll_RA | 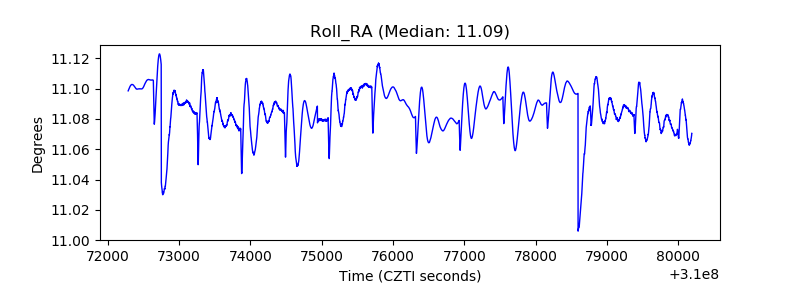 |
| Veto Counter | 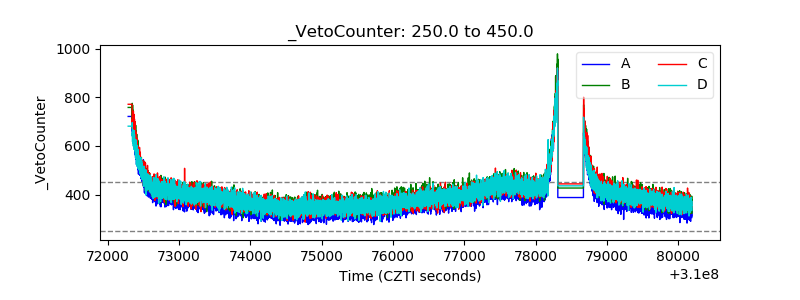 |