| Param | Original file | Final file |
|---|---|---|
| Filename | modeM0/AS1A07_007T05_9000003274_22096cztM0_level2.evt | modeM0/AS1A07_007T05_9000003274_22096cztM0_level2_quad_clean.evt |
| Size (bytes) | 894,997,440 | 184,340,160 |
| Size | 853.5 MB | 175.8 MB |
| Events in quadrant A | 6,220,083 | 1,181,636 |
| Events in quadrant B | 6,392,705 | 1,199,591 |
| Events in quadrant C | 6,462,514 | 1,152,909 |
| Events in quadrant D | 7,123,864 | 1,124,924 |
| Mode SS | |||
|---|---|---|---|
| Quadrant | BADHDUFLAG | Total packets | Discarded packets |
| A | 0 | 274 | 0 |
| B | 0 | 274 | 0 |
| C | 0 | 274 | 0 |
| D | 0 | 274 | 0 |
| Mode M9 | |||
|---|---|---|---|
| Quadrant | BADHDUFLAG | Total packets | Discarded packets |
| A | 0 | 16 | 0 |
| B | 0 | 16 | 0 |
| C | 0 | 16 | 0 |
| D | 0 | 16 | 0 |
| Mode M0 | |||
|---|---|---|---|
| Quadrant | BADHDUFLAG | Total packets | Discarded packets |
| A | 0 | 27593 | 3 |
| B | 0 | 27890 | 3 |
| C | 0 | 28003 | 3 |
| D | 0 | 30390 | 3 |
| Quadrant | Total seconds | Saturated seconds | Saturation percentage |
|---|---|---|---|
| A | 13374 | 91 | 0.680425% |
| B | 13375 | 117 | 0.874766% |
| C | 13375 | 178 | 1.330841% |
| D | 13375 | 246 | 1.839252% |
Noise dominated data is calculated using 1-second bins in cleaned event files. If a bin has >2000 counts, and if more than 50% of those come from <1% of pixels, then it is considered to be noise-dominated and hence unusable.
| Quadrant | # 1 sec bins | Bins with >0 counts | Bins with >2000 counts | High rate bins dominated by noise | Noise dominated (total time) | Noise dominated (detector-on time) | Marked lightcurve |
|---|---|---|---|---|---|---|---|
| A | 15024 | 13377 | 2 | 2 | 0.01% | 0.01% | 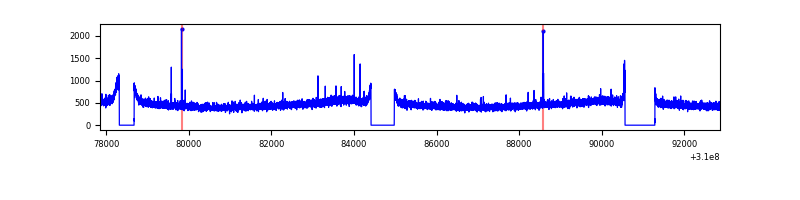 |
| B | 15025 | 13378 | 3 | 3 | 0.02% | 0.02% | 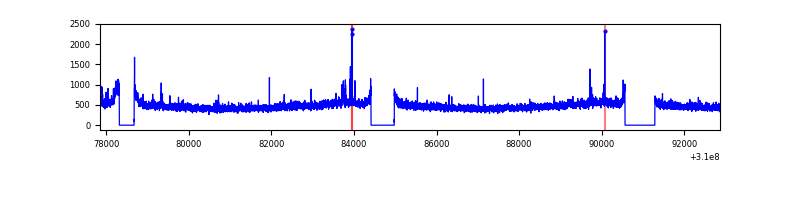 |
| C | 15025 | 13378 | 4 | 4 | 0.03% | 0.03% | 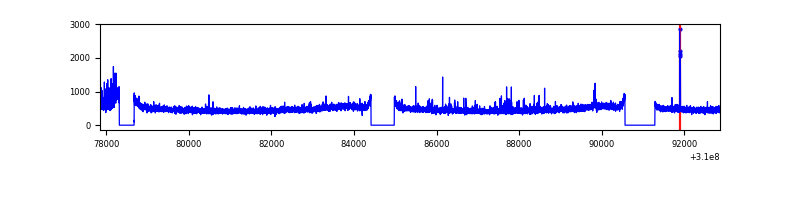 |
| D | 15025 | 13378 | 121 | 121 | 0.81% | 0.90% | 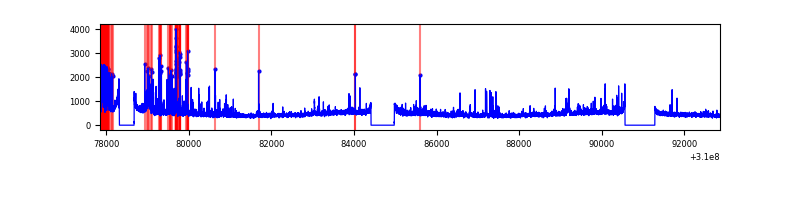 |
Top three noisy pixels from each quadrant. If the there are fewer than three noisy pixels in the level2.evt file, extra rows are filled as -1
| Pixel properties | Quadrant properties | ||||||
|---|---|---|---|---|---|---|---|
| Quadrant | DetID | PixID | Counts | Sigma | Mean | Median | Sigma |
| A | 13 | 254 | 22546 | 64.66 | 1606 | 1567 | 324.4 |
| A | 15 | 174 | 21078 | 60.14 | 1606 | 1567 | 324.4 |
| A | 3 | 137 | 13984 | 38.27 | 1606 | 1567 | 324.4 |
| B | 0 | 190 | 43859 | 137.91 | 1601 | 1560 | 306.7 |
| B | 12 | 111 | 37538 | 117.3 | 1601 | 1560 | 306.7 |
| B | 11 | 111 | 32840 | 101.98 | 1601 | 1560 | 306.7 |
| C | 14 | 238 | 242860 | 665.7 | 1546 | 1556 | 362.5 |
| C | 0 | 239 | 142842 | 389.77 | 1546 | 1556 | 362.5 |
| C | 10 | 22 | 30733 | 80.49 | 1546 | 1556 | 362.5 |
| D | 1 | 52 | 820612 | 2162.27 | 1561 | 1515 | 378.8 |
| D | 2 | 136 | 126536 | 330.03 | 1561 | 1515 | 378.8 |
| D | 2 | 16 | 121904 | 317.81 | 1561 | 1515 | 378.8 |
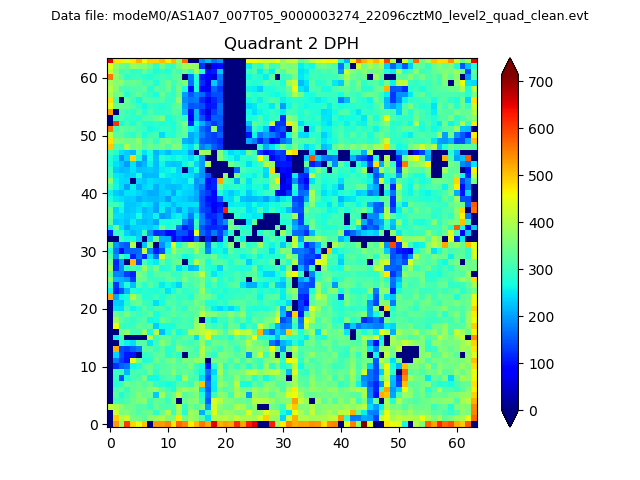
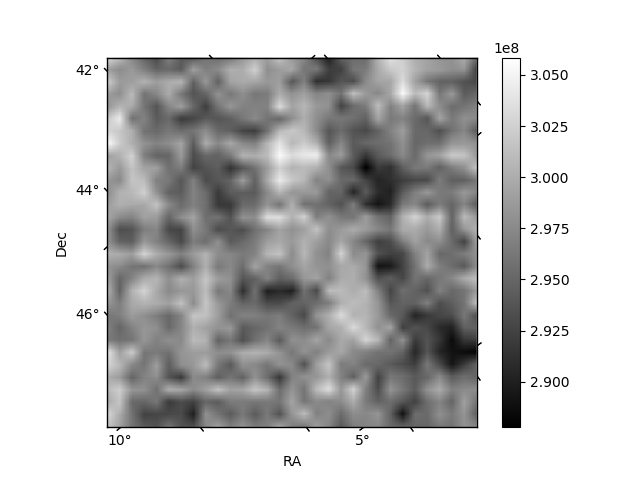
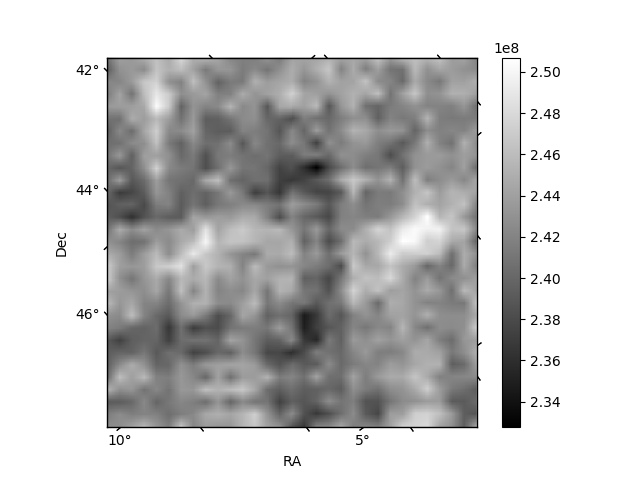
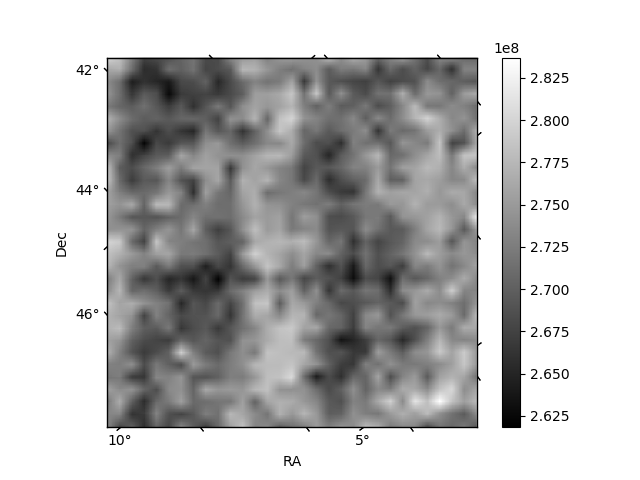
Histogram calculated using DETX and DETY for each event in the final _common_clean file
| Quadrant A | 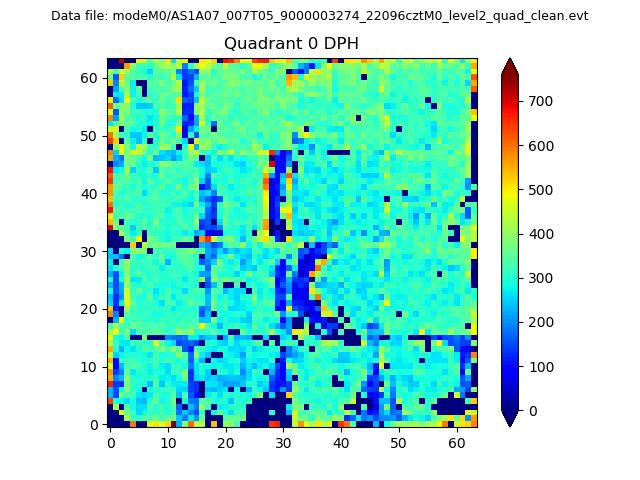 |
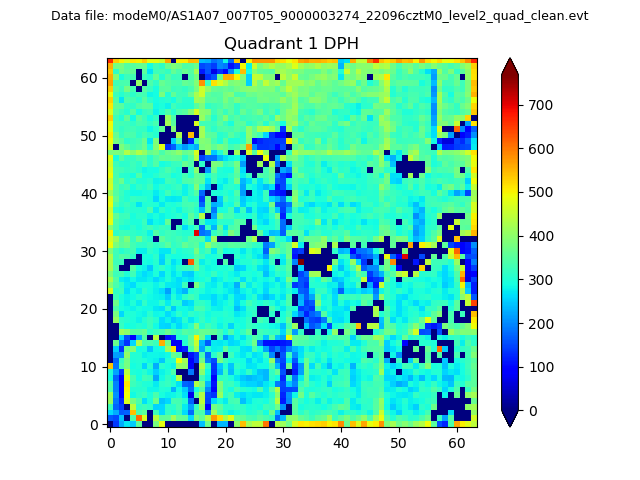 |
Quadrant B |
|---|---|---|---|
| Quadrant D | 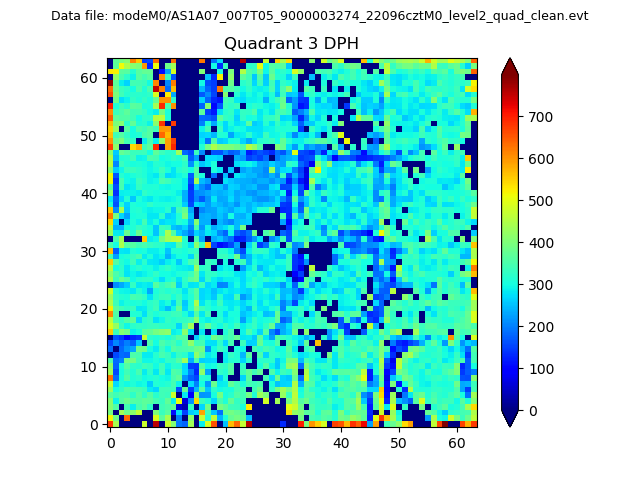 |
 |
Quadrant C |
| Plot type | Count rate plots | Images |
|---|---|---|
| Comparison with Poisson distribution Blue bars denote a histogram of data divided into 1 sec bins. Red curve is a Poisson curve with rate = median count rate of data. |
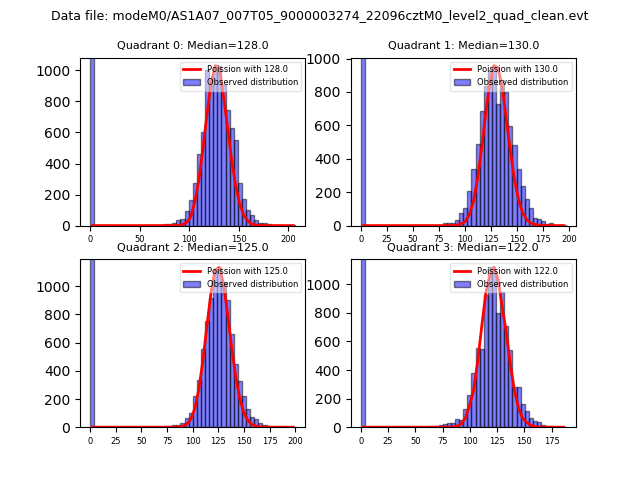 |
 |
| Quadrant-wise count rates Data is divided into 100 sec bins |
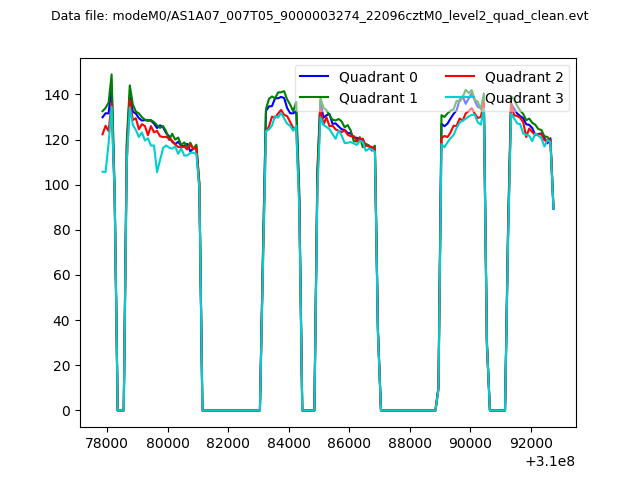 |
|
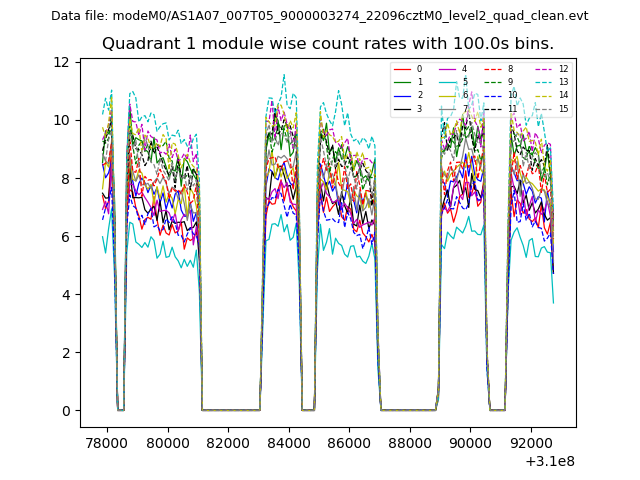
| Module-wise count rates for Quadrant A Data is divided into 100 sec bins |
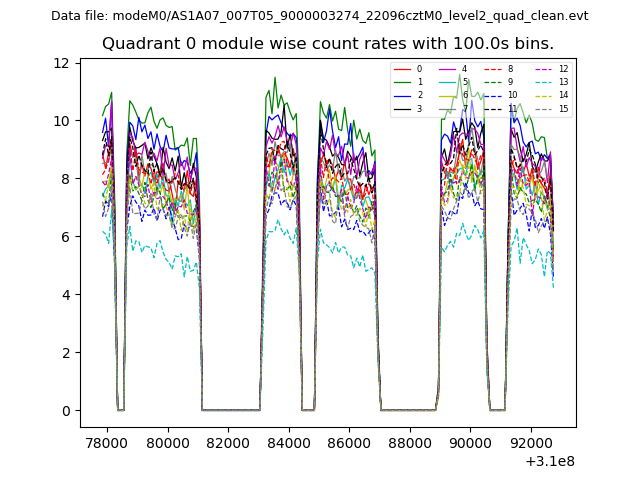 |
 |
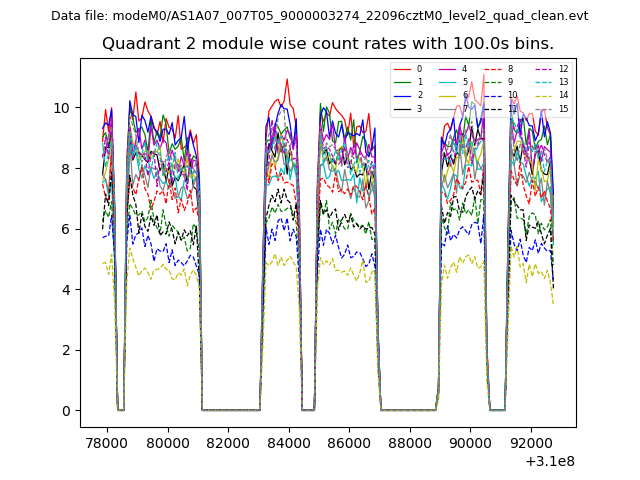
| Module-wise count rates for Quadrant B Data is divided into 100 sec bins |
 |
 |
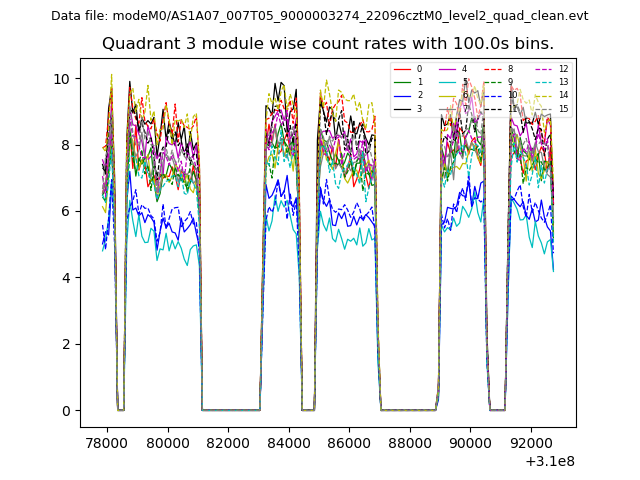
| Module-wise count rates for Quadrant C Data is divided into 100 sec bins |
 |
 |
| Module-wise count rates for Quadrant D Data is divided into 100 sec bins |
 |
 |
| Parameter | Plot |
|---|---|
| CZT HV Monitor | 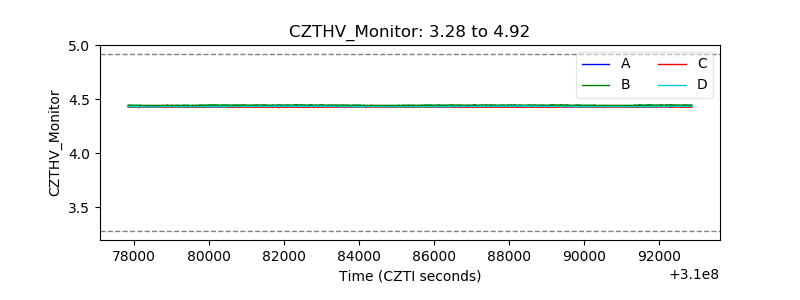 |
| D_VDD | 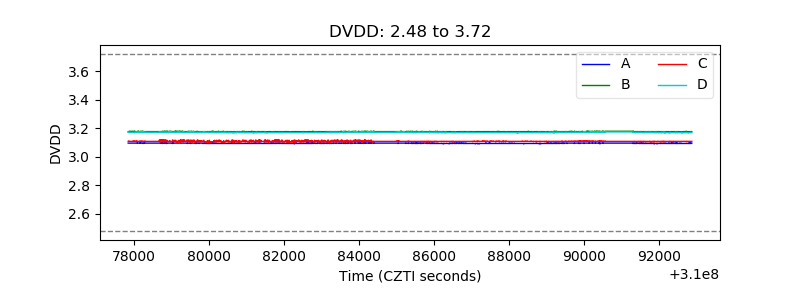 |
| Temperature 1 | 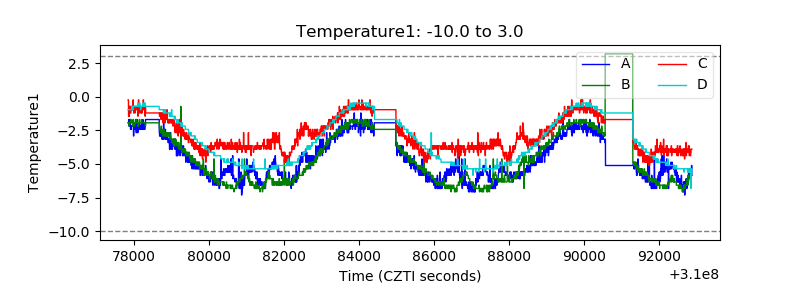 |
| Veto HV Monitor | 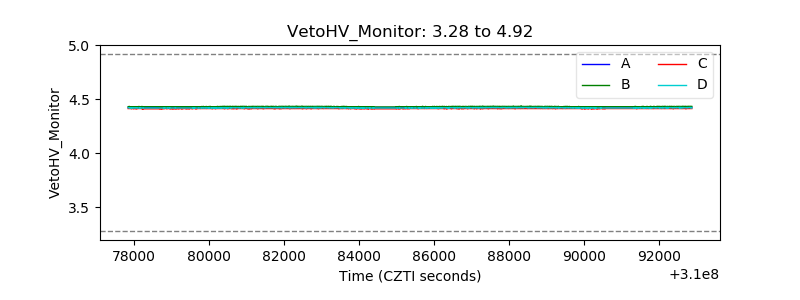 |
| Veto LLD | 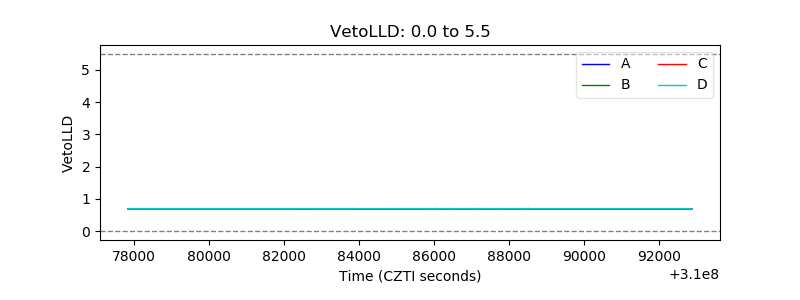 |
| Alpha Counter | 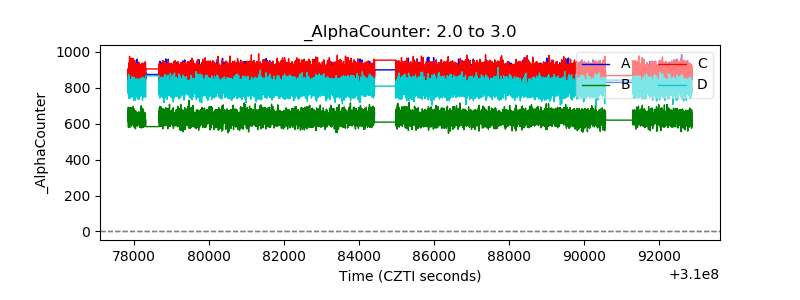 |
| _CPM_Rate | 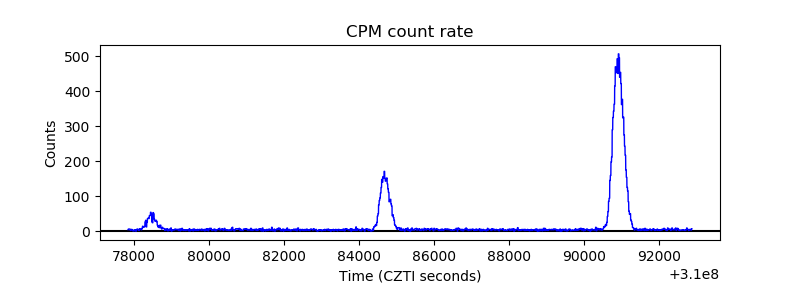 |
| CZT Counter | 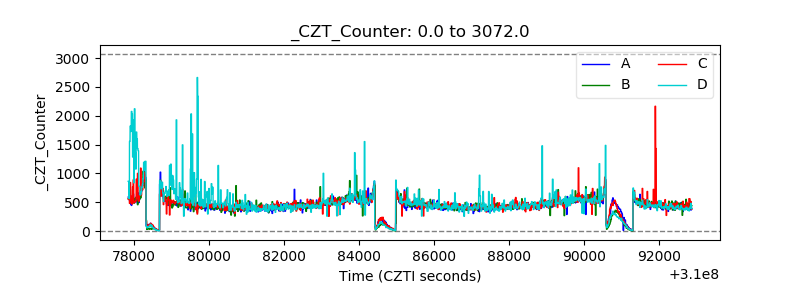 |
| +2.5 Volts monitor |  |
| +5 Volts monitor |  |
| _ROLL_ROT | 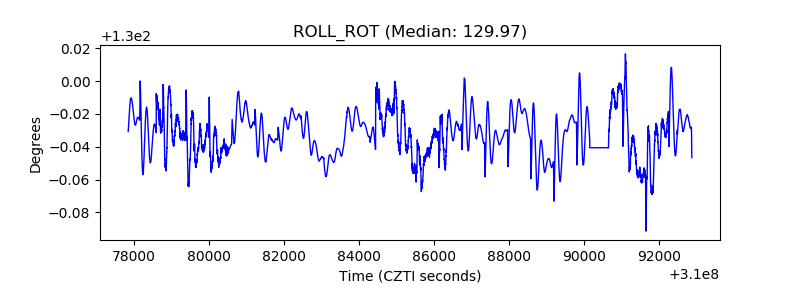 |
| _Roll_DEC | 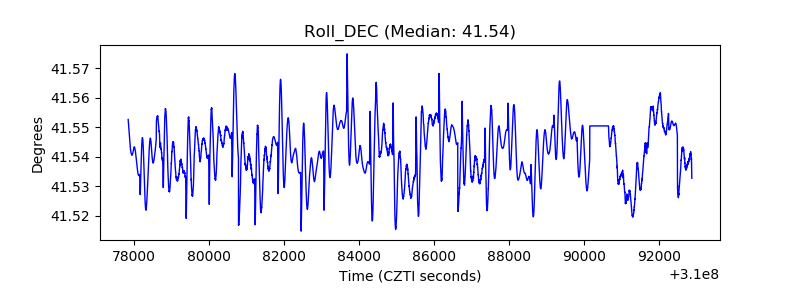 |
| _Roll_RA | 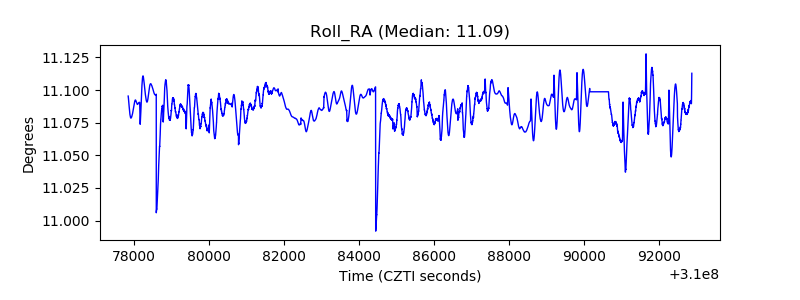 |
| Veto Counter | 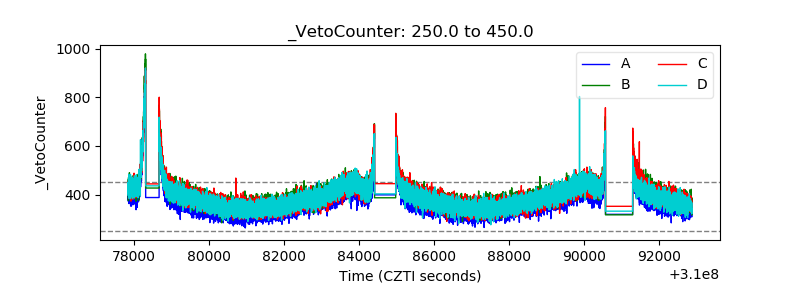 |