| Param | Original file | Final file |
|---|---|---|
| Filename | modeM0/AS1A07_007T05_9000003274_22102cztM0_level2.evt | modeM0/AS1A07_007T05_9000003274_22102cztM0_level2_quad_clean.evt |
| Size (bytes) | 507,312,000 | 72,141,120 |
| Size | 483.8 MB | 68.8 MB |
| Events in quadrant A | 3,393,586 | 453,801 |
| Events in quadrant B | 3,421,314 | 460,554 |
| Events in quadrant C | 3,332,693 | 429,717 |
| Events in quadrant D | 4,798,692 | 410,324 |
| Mode SS | |||
|---|---|---|---|
| Quadrant | BADHDUFLAG | Total packets | Discarded packets |
| A | 0 | 124 | 0 |
| B | 0 | 124 | 0 |
| C | 0 | 124 | 0 |
| D | 0 | 124 | 0 |
| Mode M9 | |||
|---|---|---|---|
| Quadrant | BADHDUFLAG | Total packets | Discarded packets |
| A | 0 | 17 | 0 |
| B | 0 | 18 | 0 |
| C | 0 | 18 | 0 |
| D | 0 | 18 | 0 |
| Mode M0 | |||
|---|---|---|---|
| Quadrant | BADHDUFLAG | Total packets | Discarded packets |
| A | 0 | 13834 | 2 |
| B | 0 | 13904 | 2 |
| C | 0 | 13554 | 2 |
| D | 0 | 18108 | 2 |
| Quadrant | Total seconds | Saturated seconds | Saturation percentage |
|---|---|---|---|
| A | 6162 | 92 | 1.493022% |
| B | 6162 | 100 | 1.622850% |
| C | 6162 | 109 | 1.768906% |
| D | 6162 | 486 | 7.887050% |
Noise dominated data is calculated using 1-second bins in cleaned event files. If a bin has >2000 counts, and if more than 50% of those come from <1% of pixels, then it is considered to be noise-dominated and hence unusable.
| Quadrant | # 1 sec bins | Bins with >0 counts | Bins with >2000 counts | High rate bins dominated by noise | Noise dominated (total time) | Noise dominated (detector-on time) | Marked lightcurve |
|---|---|---|---|---|---|---|---|
| A | 7467 | 6163 | 1 | 1 | 0.01% | 0.02% | 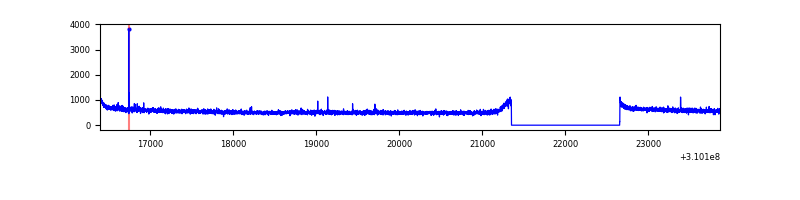 |
| B | 7467 | 6163 | 0 | 0 | 0.00% | 0.00% | 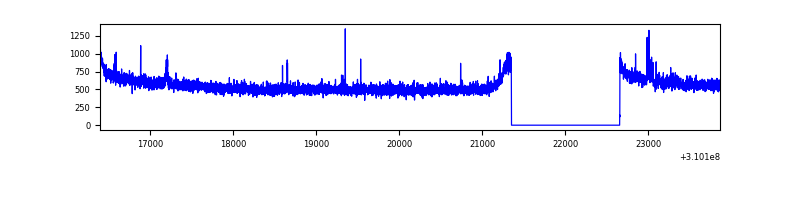 |
| C | 7467 | 6163 | 0 | 0 | 0.00% | 0.00% | 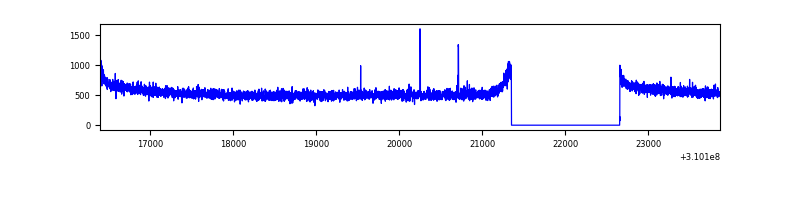 |
| D | 7467 | 6163 | 440 | 440 | 5.89% | 7.14% | 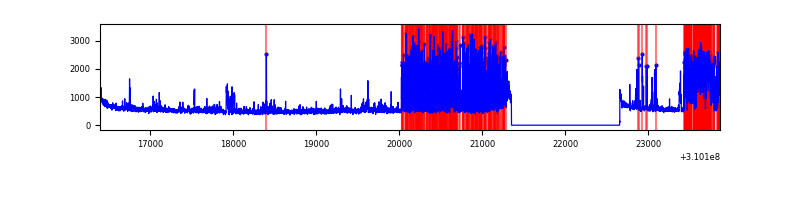 |
Top three noisy pixels from each quadrant. If the there are fewer than three noisy pixels in the level2.evt file, extra rows are filled as -1
| Pixel properties | Quadrant properties | ||||||
|---|---|---|---|---|---|---|---|
| Quadrant | DetID | PixID | Counts | Sigma | Mean | Median | Sigma |
| A | 5 | 16 | 14125 | 76.72 | 876 | 863 | 172.9 |
| A | 13 | 254 | 10210 | 54.07 | 876 | 863 | 172.9 |
| A | 0 | 226 | 7639 | 39.2 | 876 | 863 | 172.9 |
| B | 0 | 230 | 30252 | 182.31 | 868 | 851 | 161.3 |
| B | 12 | 111 | 18671 | 110.5 | 868 | 851 | 161.3 |
| B | 11 | 111 | 16645 | 97.93 | 868 | 851 | 161.3 |
| C | 14 | 238 | 132392 | 702.56 | 817 | 825 | 187.3 |
| C | 10 | 22 | 12196 | 60.72 | 817 | 825 | 187.3 |
| C | 13 | 61 | 5747 | 26.28 | 817 | 825 | 187.3 |
| D | 1 | 52 | 1339327 | 6838.84 | 819 | 796 | 195.7 |
| D | 2 | 16 | 152852 | 776.89 | 819 | 796 | 195.7 |
| D | 11 | 176 | 149873 | 761.67 | 819 | 796 | 195.7 |
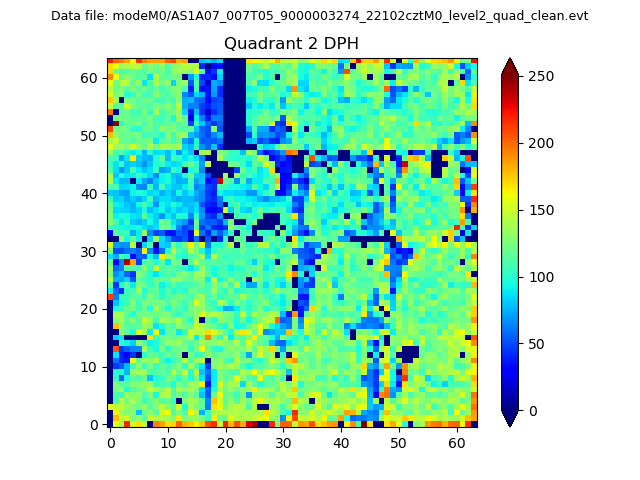
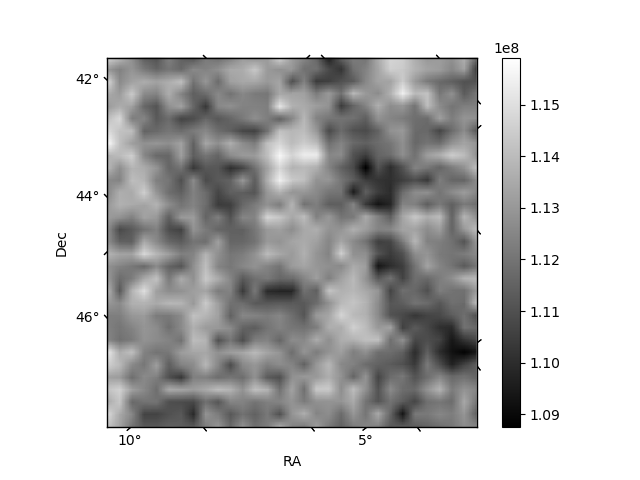
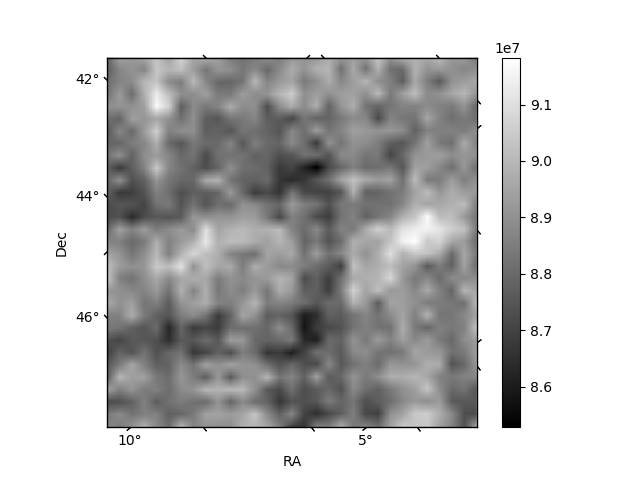
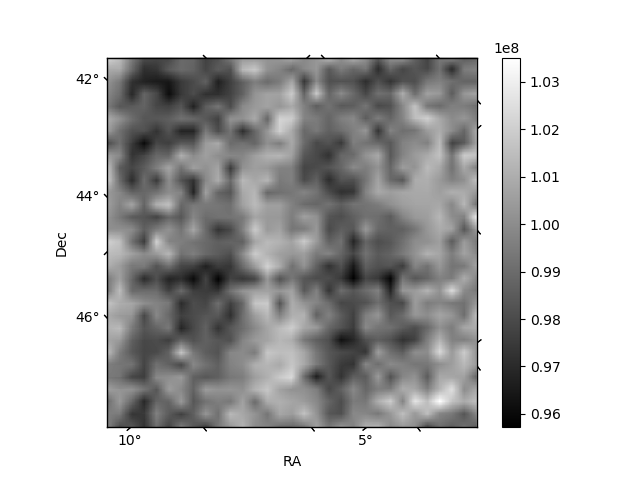
Histogram calculated using DETX and DETY for each event in the final _common_clean file
| Quadrant A | 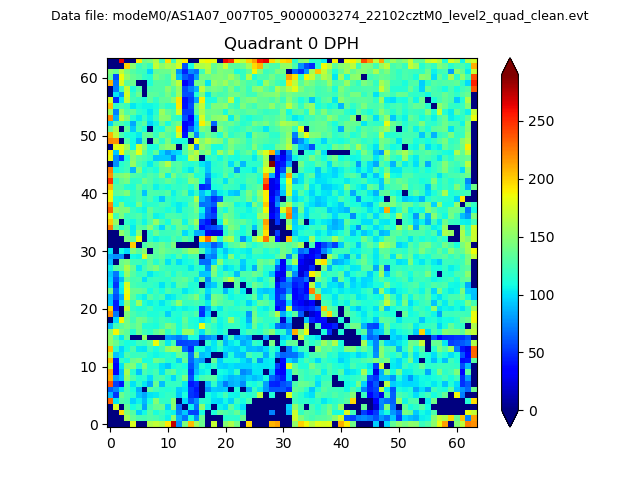 |
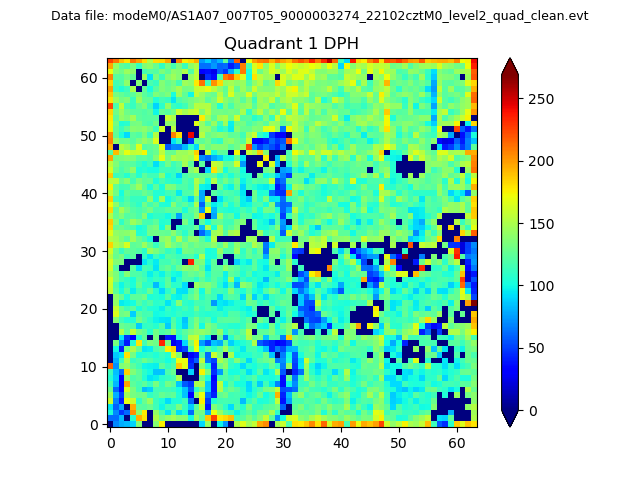 |
Quadrant B |
|---|---|---|---|
| Quadrant D | 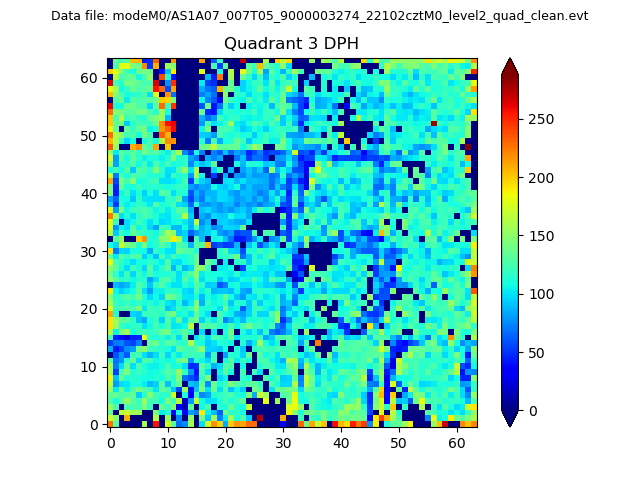 |
 |
Quadrant C |
| Plot type | Count rate plots | Images |
|---|---|---|
| Comparison with Poisson distribution Blue bars denote a histogram of data divided into 1 sec bins. Red curve is a Poisson curve with rate = median count rate of data. |
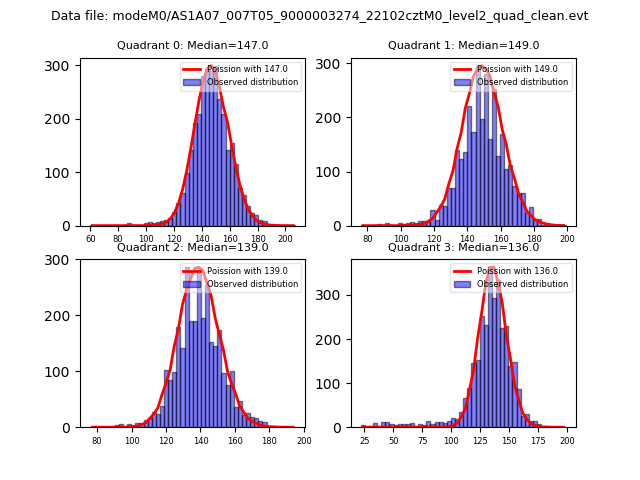 |
 |
| Quadrant-wise count rates Data is divided into 100 sec bins |
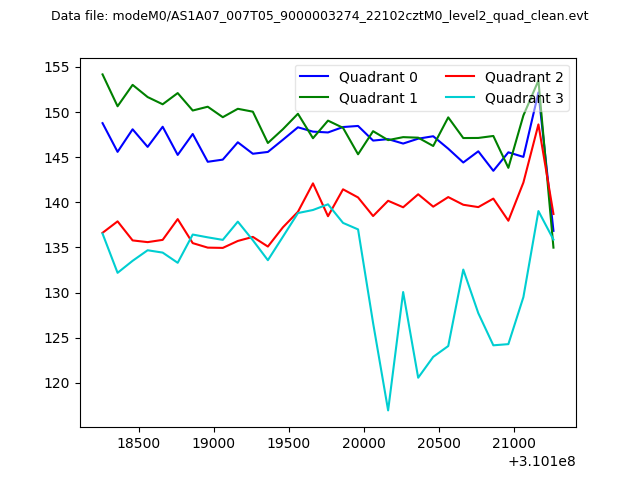 |
|
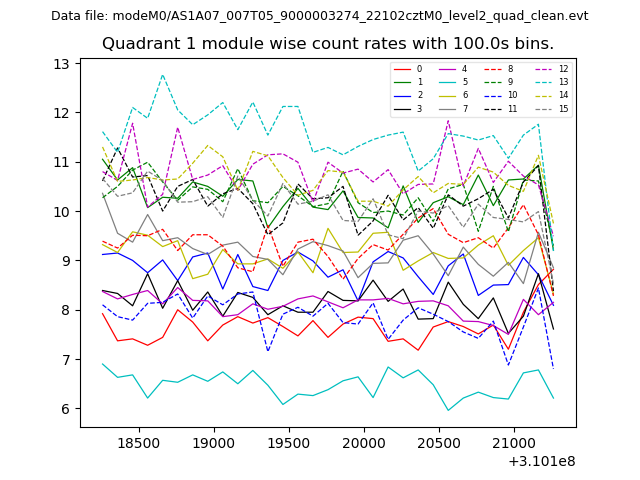
| Module-wise count rates for Quadrant A Data is divided into 100 sec bins |
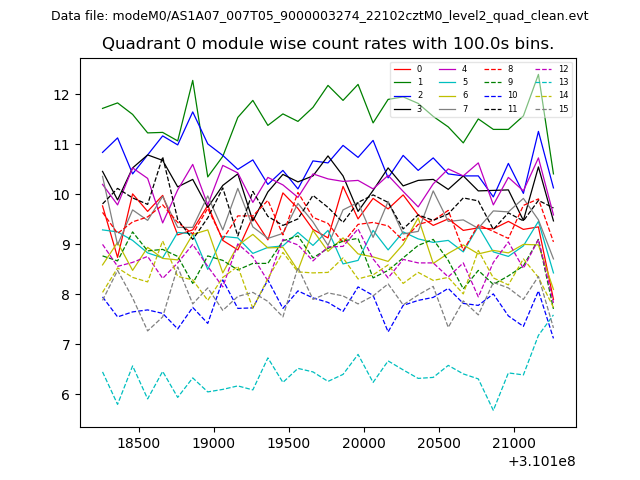 |
 |
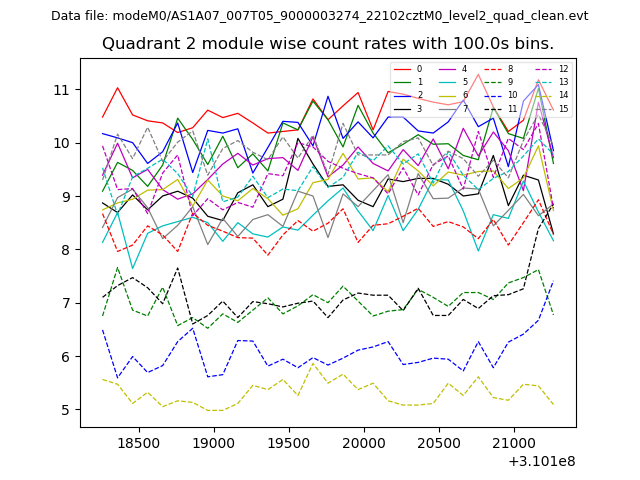
| Module-wise count rates for Quadrant B Data is divided into 100 sec bins |
 |
 |
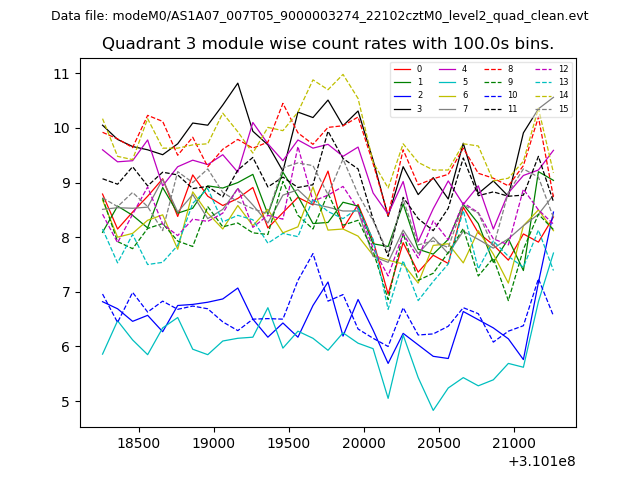
| Module-wise count rates for Quadrant C Data is divided into 100 sec bins |
 |
 |
| Module-wise count rates for Quadrant D Data is divided into 100 sec bins |
 |
 |
| Parameter | Plot |
|---|---|
| CZT HV Monitor | 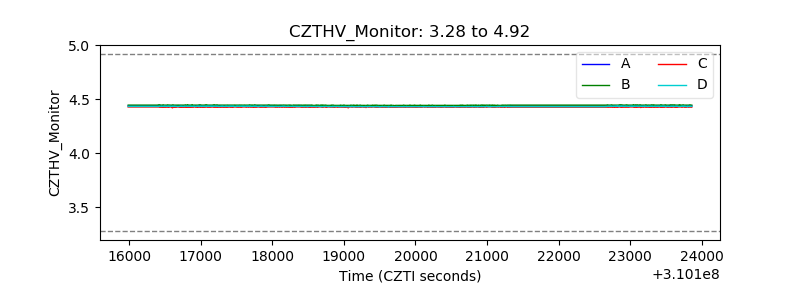 |
| D_VDD | 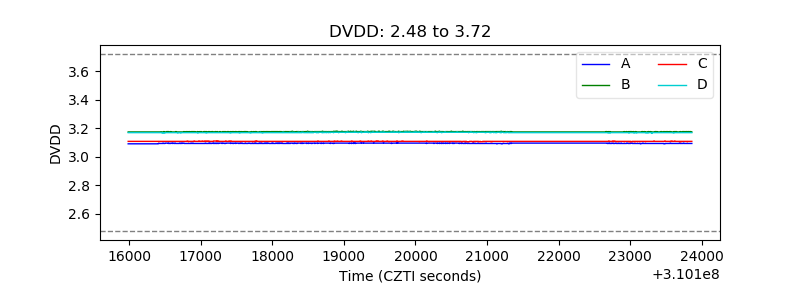 |
| Temperature 1 | 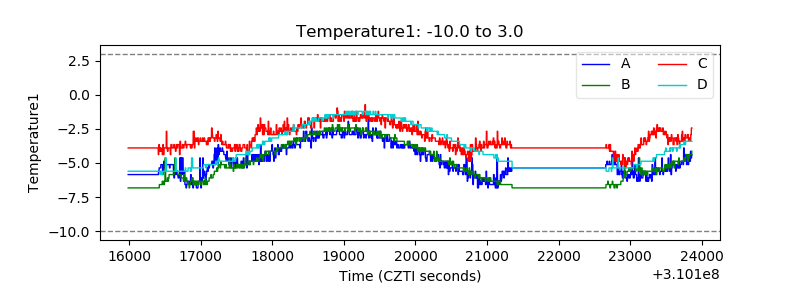 |
| Veto HV Monitor | 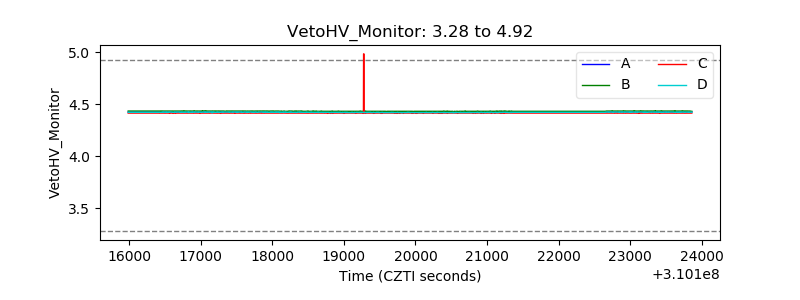 |
| Veto LLD | 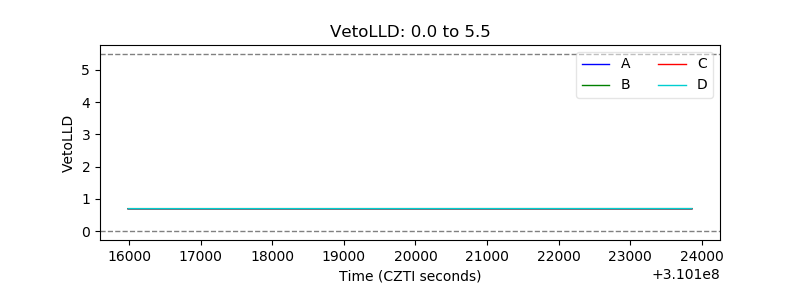 |
| Alpha Counter |  |
| _CPM_Rate | 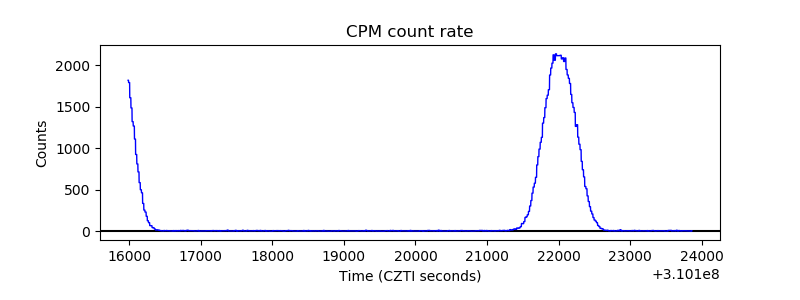 |
| CZT Counter | 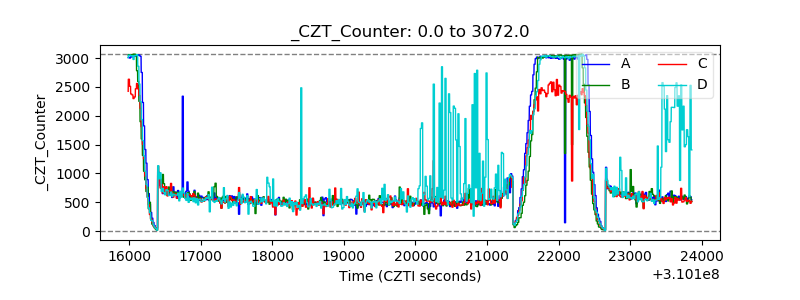 |
| +2.5 Volts monitor |  |
| +5 Volts monitor |  |
| _ROLL_ROT | 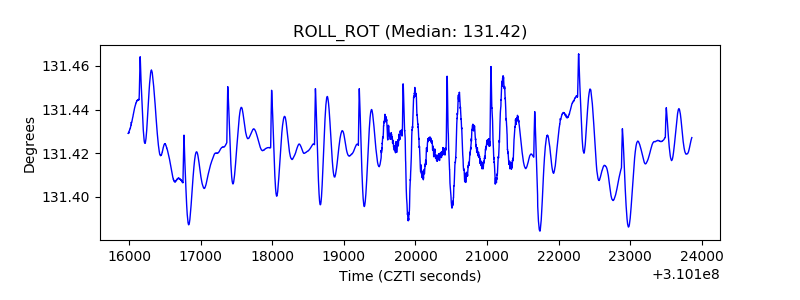 |
| _Roll_DEC | 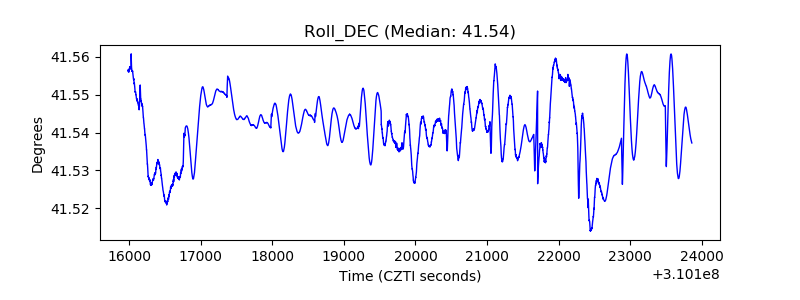 |
| _Roll_RA | 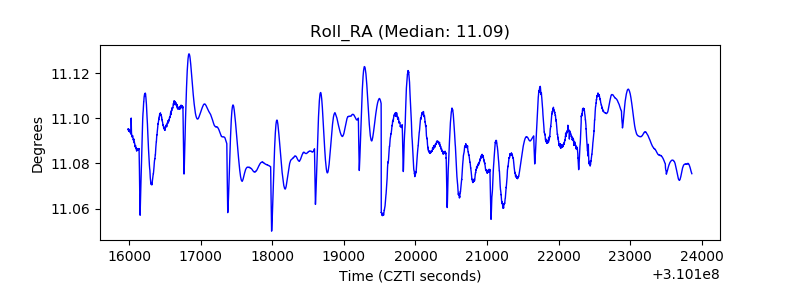 |
| Veto Counter | 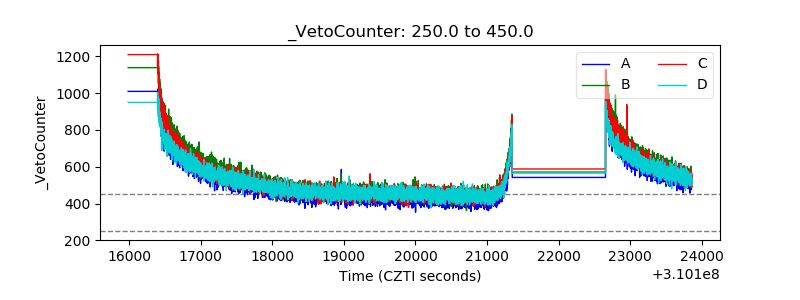 |