| Param | Original file | Final file |
|---|---|---|
| Filename | modeM0/AS1A07_007T05_9000003274_22103cztM0_level2.evt | modeM0/AS1A07_007T05_9000003274_22103cztM0_level2_quad_clean.evt |
| Size (bytes) | 543,113,280 | 74,666,880 |
| Size | 518.0 MB | 71.2 MB |
| Events in quadrant A | 2,635,087 | 520,191 |
| Events in quadrant B | 2,753,081 | 521,114 |
| Events in quadrant C | 2,615,890 | 490,784 |
| Events in quadrant D | 8,109,303 | 381,700 |
| Mode SS | |||
|---|---|---|---|
| Quadrant | BADHDUFLAG | Total packets | Discarded packets |
| A | 0 | 102 | 0 |
| B | 0 | 102 | 0 |
| C | 0 | 102 | 0 |
| D | 0 | 102 | 0 |
| Mode M9 | |||
|---|---|---|---|
| Quadrant | BADHDUFLAG | Total packets | Discarded packets |
| A | 0 | 13 | 0 |
| B | 0 | 13 | 0 |
| C | 0 | 13 | 0 |
| D | 0 | 13 | 0 |
| Mode M0 | |||
|---|---|---|---|
| Quadrant | BADHDUFLAG | Total packets | Discarded packets |
| A | 0 | 10778 | 1 |
| B | 0 | 11103 | 1 |
| C | 0 | 10650 | 1 |
| D | 0 | 27423 | 1 |
| Quadrant | Total seconds | Saturated seconds | Saturation percentage |
|---|---|---|---|
| A | 4932 | 69 | 1.399027% |
| B | 4932 | 110 | 2.230333% |
| C | 4932 | 87 | 1.763990% |
| D | 4933 | 2302 | 46.665315% |
Noise dominated data is calculated using 1-second bins in cleaned event files. If a bin has >2000 counts, and if more than 50% of those come from <1% of pixels, then it is considered to be noise-dominated and hence unusable.
| Quadrant | # 1 sec bins | Bins with >0 counts | Bins with >2000 counts | High rate bins dominated by noise | Noise dominated (total time) | Noise dominated (detector-on time) | Marked lightcurve |
|---|---|---|---|---|---|---|---|
| A | 6237 | 4933 | 0 | 0 | 0.00% | 0.00% | 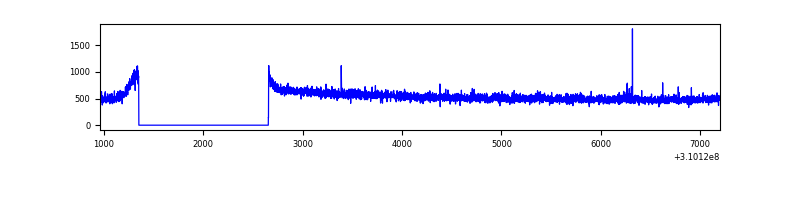 |
| B | 6237 | 4933 | 24 | 24 | 0.38% | 0.49% | 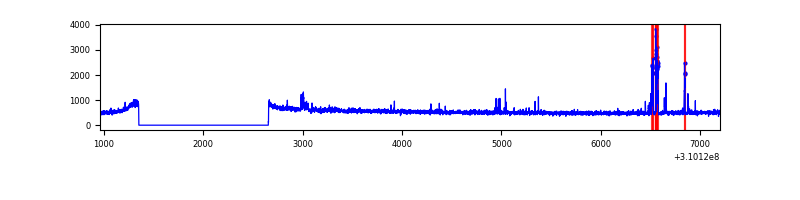 |
| C | 6237 | 4933 | 0 | 0 | 0.00% | 0.00% | 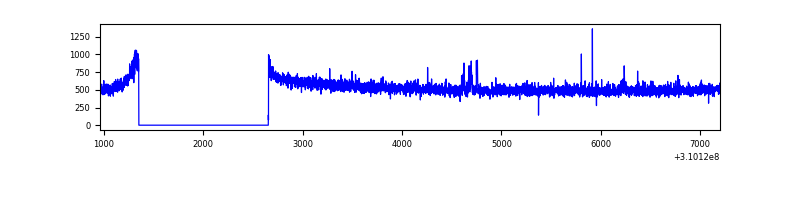 |
| D | 6238 | 4934 | 2338 | 2338 | 37.48% | 47.39% | 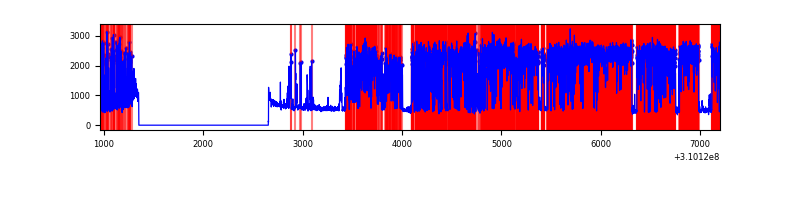 |
Top three noisy pixels from each quadrant. If the there are fewer than three noisy pixels in the level2.evt file, extra rows are filled as -1
| Pixel properties | Quadrant properties | ||||||
|---|---|---|---|---|---|---|---|
| Quadrant | DetID | PixID | Counts | Sigma | Mean | Median | Sigma |
| A | 5 | 16 | 10298 | 71.22 | 681 | 670 | 135.2 |
| A | 13 | 254 | 7983 | 54.09 | 681 | 670 | 135.2 |
| A | 0 | 226 | 6021 | 39.58 | 681 | 670 | 135.2 |
| B | 3 | 64 | 113355 | 898.27 | 670 | 656 | 125.5 |
| B | 0 | 230 | 19651 | 151.4 | 670 | 656 | 125.5 |
| B | 12 | 111 | 14496 | 110.31 | 670 | 656 | 125.5 |
| C | 14 | 238 | 102461 | 691.16 | 640 | 646 | 147.3 |
| C | 10 | 22 | 19113 | 125.36 | 640 | 646 | 147.3 |
| C | 13 | 61 | 4530 | 26.37 | 640 | 646 | 147.3 |
| D | 1 | 52 | 5577758 | 39460.09 | 583 | 567 | 141.3 |
| D | 11 | 176 | 141265 | 995.48 | 583 | 567 | 141.3 |
| D | 7 | 238 | 64635 | 453.3 | 583 | 567 | 141.3 |
Histogram calculated using DETX and DETY for each event in the final _common_clean file
| Quadrant A |  |
 |
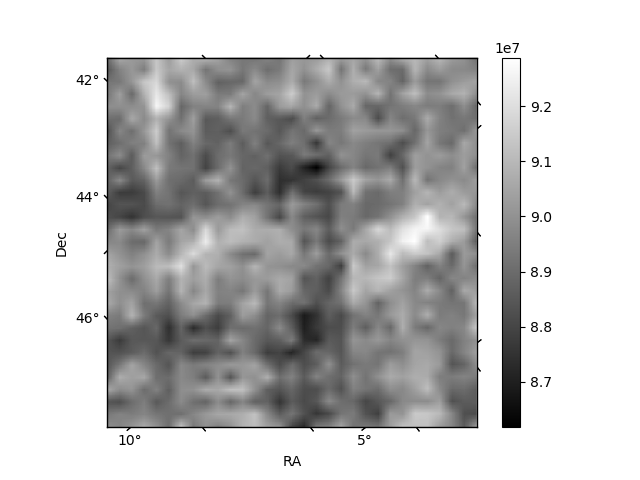
Quadrant B |
|---|---|---|---|
| Quadrant D |  |
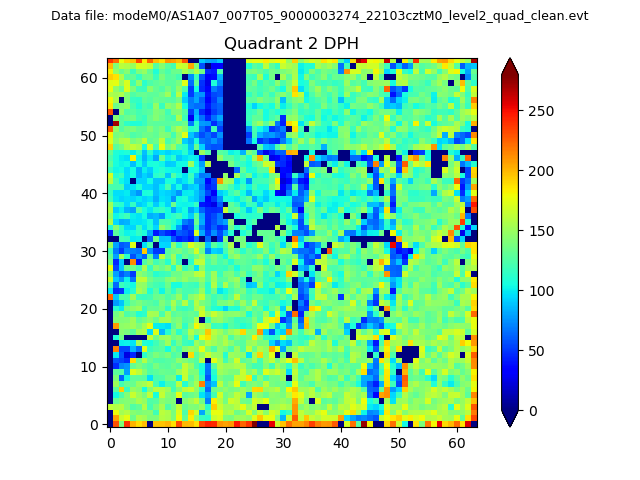 |
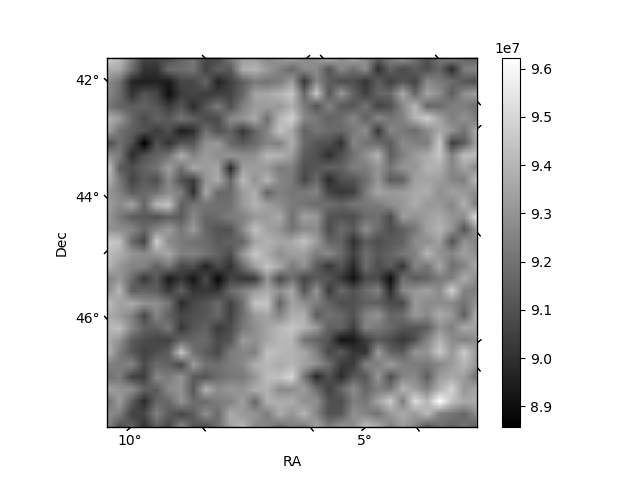
Quadrant C |
| Plot type | Count rate plots | Images |
|---|---|---|
| Comparison with Poisson distribution Blue bars denote a histogram of data divided into 1 sec bins. Red curve is a Poisson curve with rate = median count rate of data. |
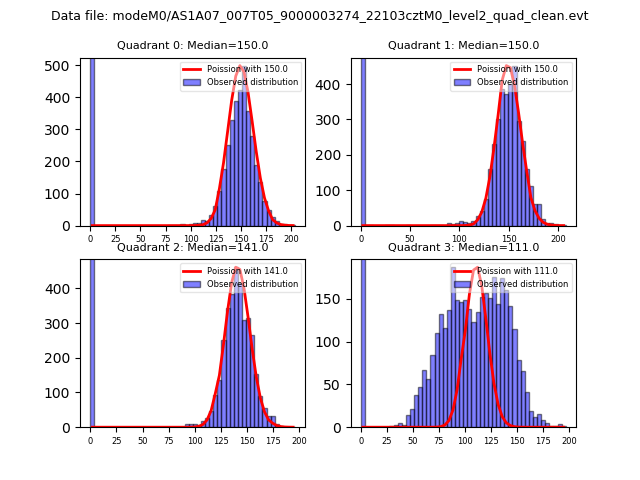 |
 |
| Quadrant-wise count rates Data is divided into 100 sec bins |
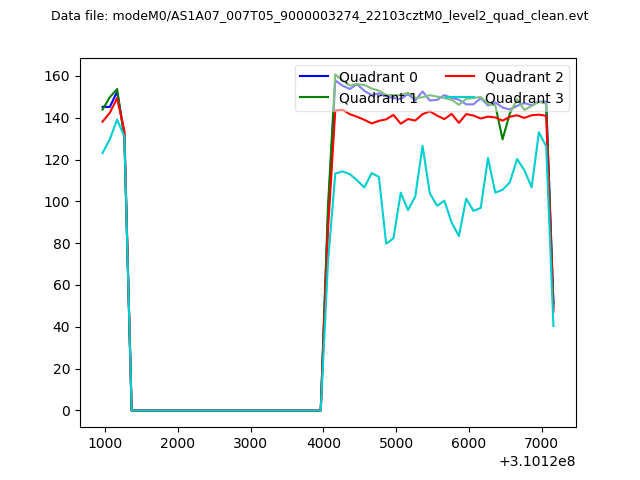 |
|
| Module-wise count rates for Quadrant A Data is divided into 100 sec bins |
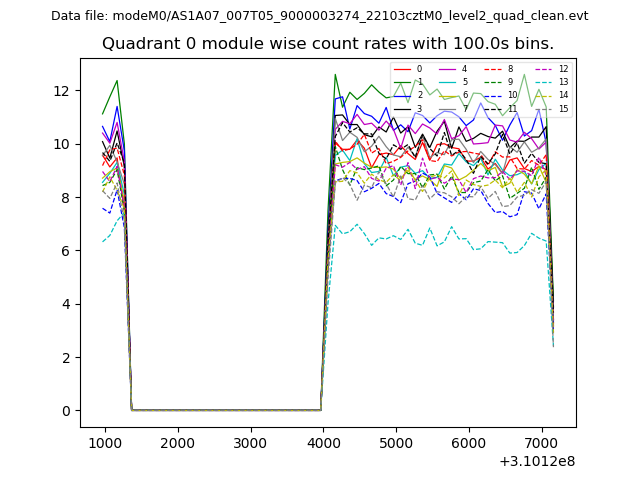 |
 |
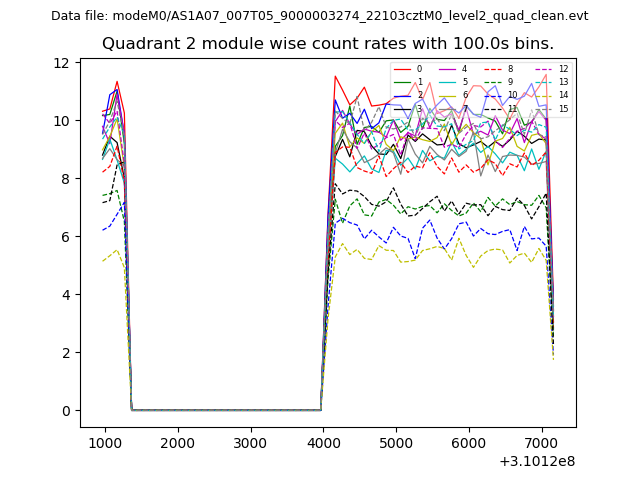
| Module-wise count rates for Quadrant B Data is divided into 100 sec bins |
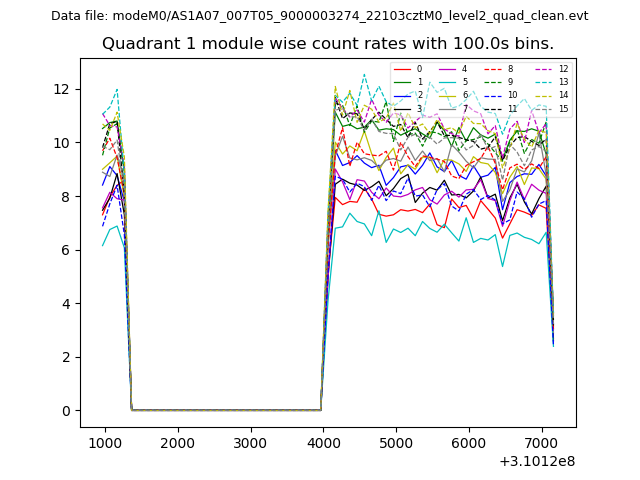 |
 |
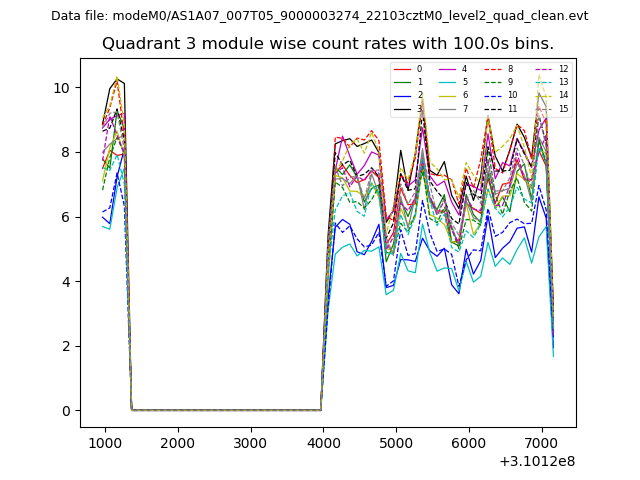
| Module-wise count rates for Quadrant C Data is divided into 100 sec bins |
 |
 |
| Module-wise count rates for Quadrant D Data is divided into 100 sec bins |
 |
 |
| Parameter | Plot |
|---|---|
| CZT HV Monitor | 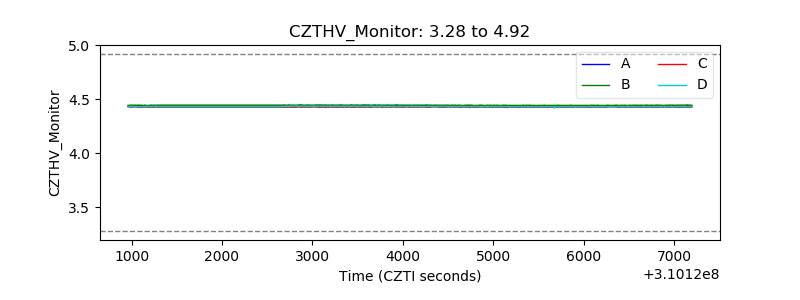 |
| D_VDD | 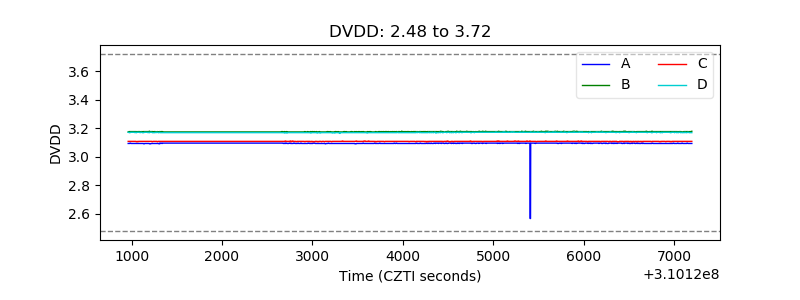 |
| Temperature 1 | 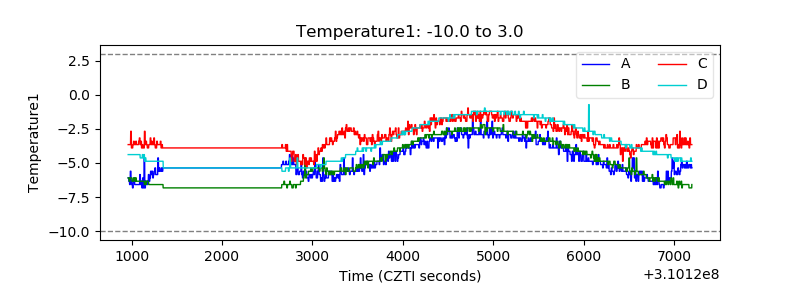 |
| Veto HV Monitor | 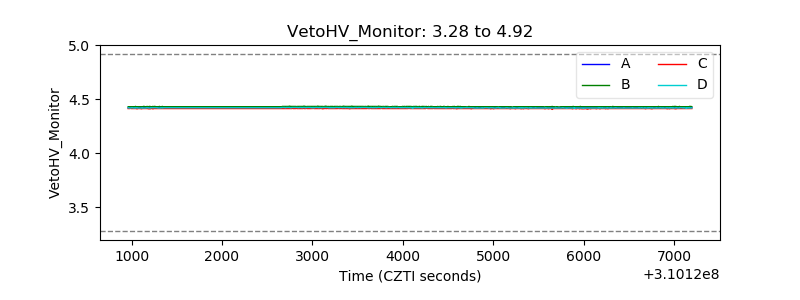 |
| Veto LLD | 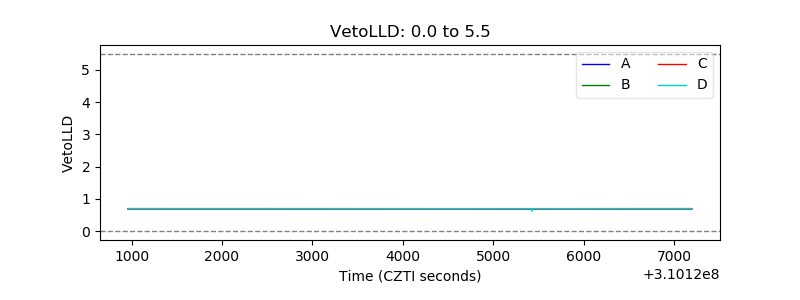 |
| Alpha Counter | 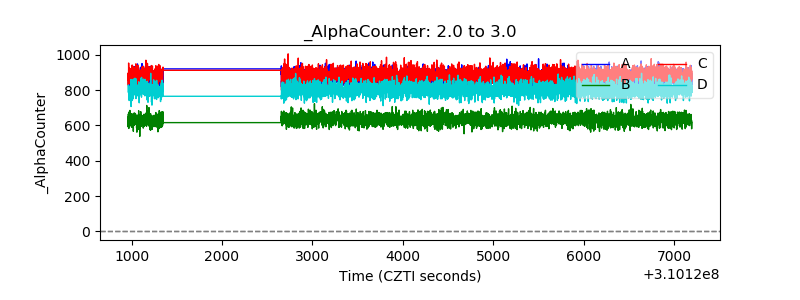 |
| _CPM_Rate | 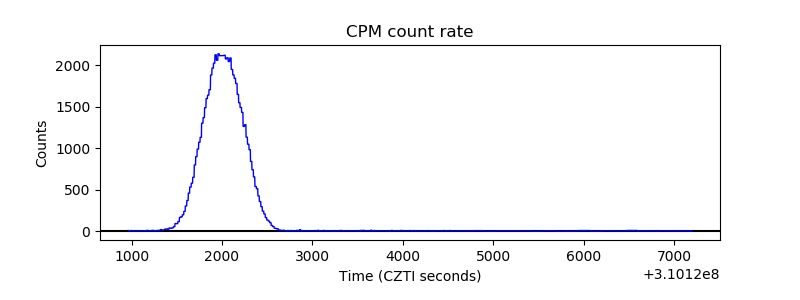 |
| CZT Counter | 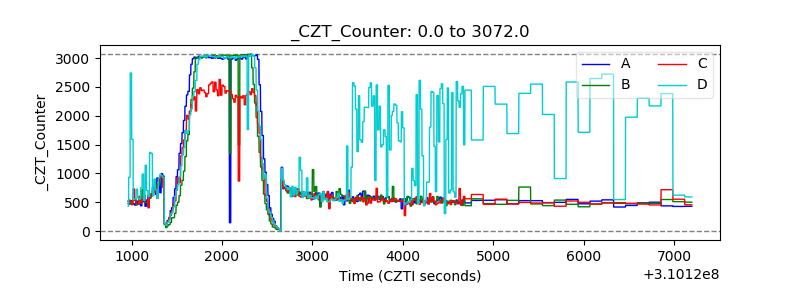 |
| +2.5 Volts monitor |  |
| +5 Volts monitor | 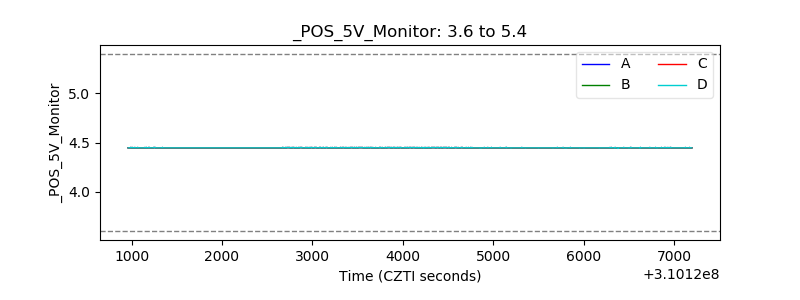 |
| _ROLL_ROT | 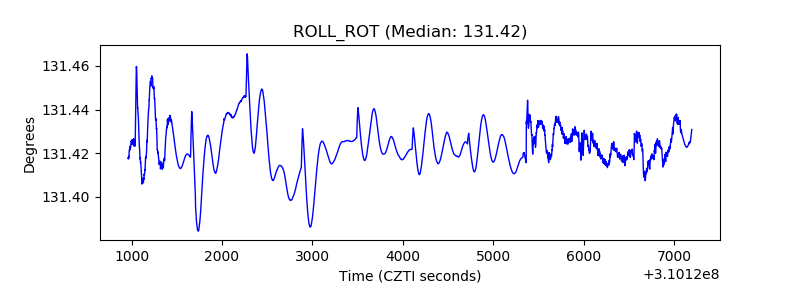 |
| _Roll_DEC | 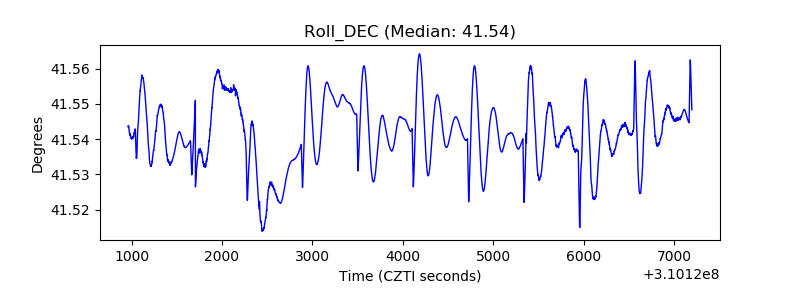 |
| _Roll_RA | 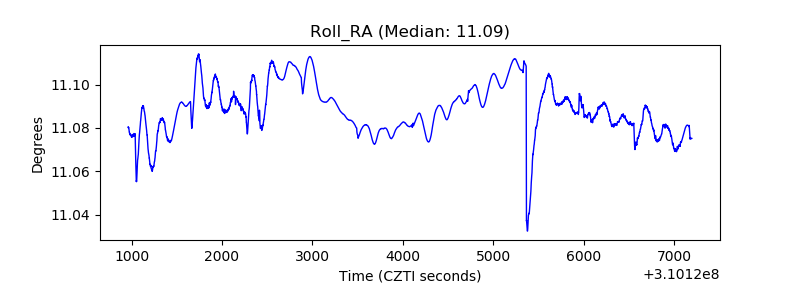 |
| Veto Counter | 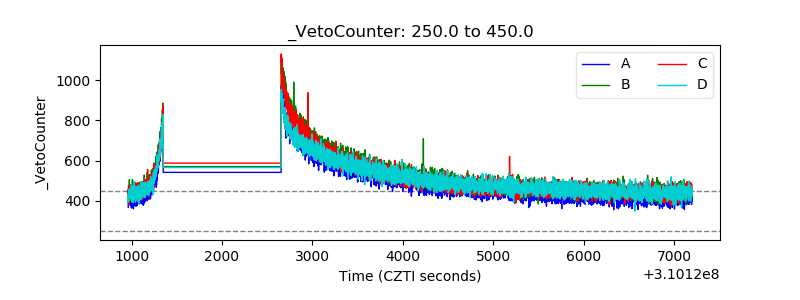 |