| Param | Original file | Final file |
|---|---|---|
| Filename | modeM0/AS1A07_149T01_9000003270_22082cztM0_level2.evt | modeM0/AS1A07_149T01_9000003270_22082cztM0_level2_quad_clean.evt |
| Size (bytes) | 84,810,240 | 22,288,320 |
| Size | 80.9 MB | 21.3 MB |
| Events in quadrant A | 531,460 | 150,531 |
| Events in quadrant B | 559,188 | 152,675 |
| Events in quadrant C | 607,180 | 145,303 |
| Events in quadrant D | 786,591 | 136,051 |
| Mode M9 | |||
|---|---|---|---|
| Quadrant | BADHDUFLAG | Total packets | Discarded packets |
| A | 0 | 3 | 0 |
| B | 0 | 3 | 0 |
| C | 0 | 3 | 0 |
| D | 0 | 3 | 0 |
| Mode SS | |||
|---|---|---|---|
| Quadrant | BADHDUFLAG | Total packets | Discarded packets |
| A | 0 | 24 | 0 |
| B | 0 | 24 | 0 |
| C | 0 | 24 | 0 |
| D | 0 | 24 | 0 |
| Mode M0 | |||
|---|---|---|---|
| Quadrant | BADHDUFLAG | Total packets | Discarded packets |
| A | 0 | 2389 | 1 |
| B | 0 | 2408 | 1 |
| C | 0 | 2518 | 1 |
| D | 0 | 3208 | 1 |
| Quadrant | Total seconds | Saturated seconds | Saturation percentage |
|---|---|---|---|
| A | 1189 | 1 | 0.084104% |
| B | 1189 | 3 | 0.252313% |
| C | 1189 | 5 | 0.420521% |
| D | 1189 | 103 | 8.662742% |
Noise dominated data is calculated using 1-second bins in cleaned event files. If a bin has >2000 counts, and if more than 50% of those come from <1% of pixels, then it is considered to be noise-dominated and hence unusable.
| Quadrant | # 1 sec bins | Bins with >0 counts | Bins with >2000 counts | High rate bins dominated by noise | Noise dominated (total time) | Noise dominated (detector-on time) | Marked lightcurve |
|---|---|---|---|---|---|---|---|
| A | 1189 | 1189 | 0 | 0 | 0.00% | 0.00% | 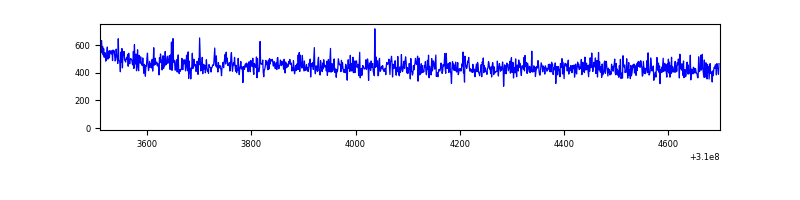 |
| B | 1189 | 1189 | 0 | 0 | 0.00% | 0.00% | 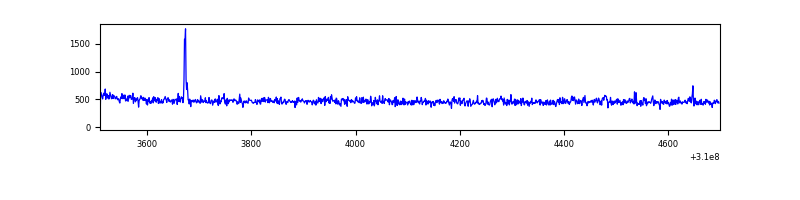 |
| C | 1189 | 1189 | 0 | 0 | 0.00% | 0.00% | 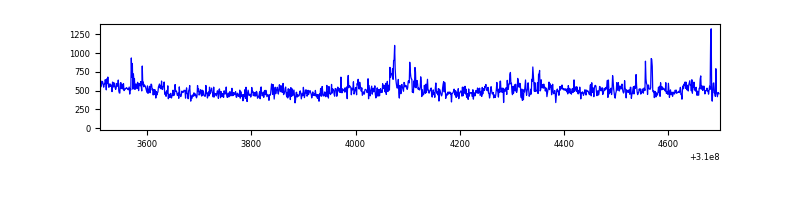 |
| D | 1189 | 1189 | 97 | 97 | 8.16% | 8.16% | 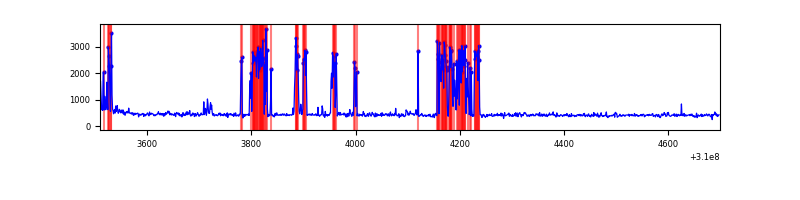 |
Top three noisy pixels from each quadrant. If the there are fewer than three noisy pixels in the level2.evt file, extra rows are filled as -1
| Pixel properties | Quadrant properties | ||||||
|---|---|---|---|---|---|---|---|
| Quadrant | DetID | PixID | Counts | Sigma | Mean | Median | Sigma |
| A | 13 | 254 | 1898 | 58.42 | 137 | 134 | 30.2 |
| A | 3 | 137 | 1231 | 36.33 | 137 | 134 | 30.2 |
| A | 0 | 226 | 1171 | 34.35 | 137 | 134 | 30.2 |
| B | 3 | 64 | 5044 | 168.18 | 140 | 137 | 29.2 |
| B | 0 | 230 | 3633 | 119.82 | 140 | 137 | 29.2 |
| B | 12 | 111 | 3393 | 111.59 | 140 | 137 | 29.2 |
| C | 0 | 239 | 64014 | 1911.37 | 133 | 134 | 33.4 |
| C | 14 | 238 | 20756 | 617.04 | 133 | 134 | 33.4 |
| C | 13 | 61 | 917 | 23.43 | 133 | 134 | 33.4 |
| D | 1 | 52 | 292802 | 8969.74 | 125 | 121 | 32.6 |
| D | 2 | 136 | 6450 | 193.96 | 125 | 121 | 32.6 |
| D | 2 | 16 | 5506 | 165.03 | 125 | 121 | 32.6 |
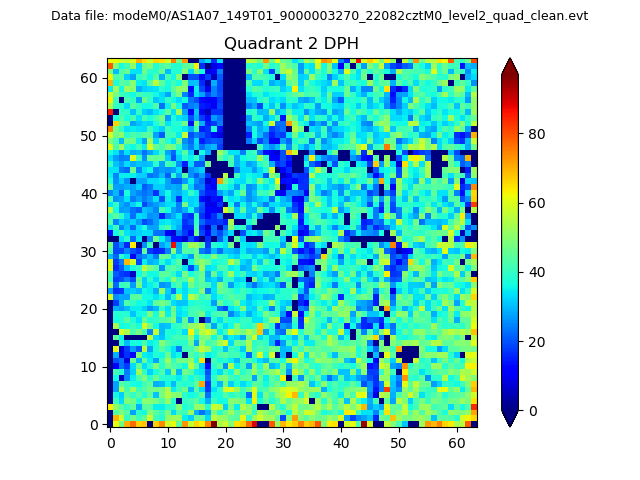
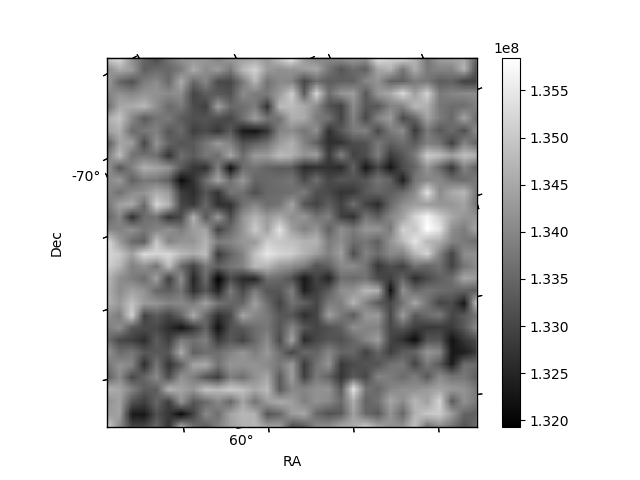
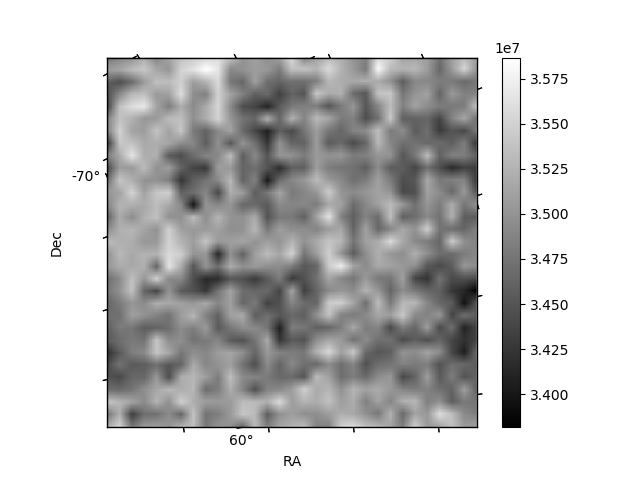
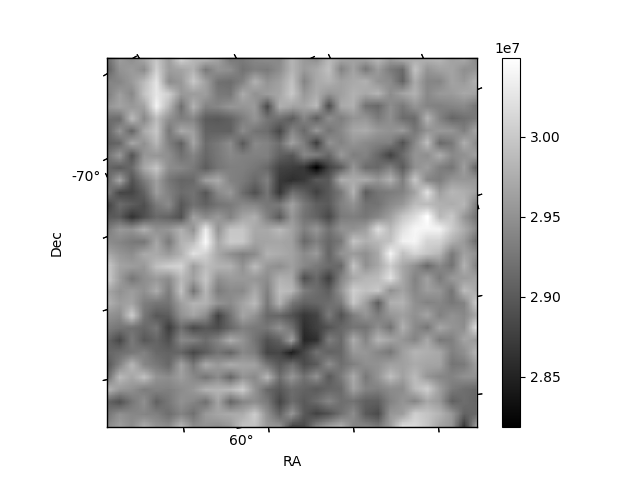
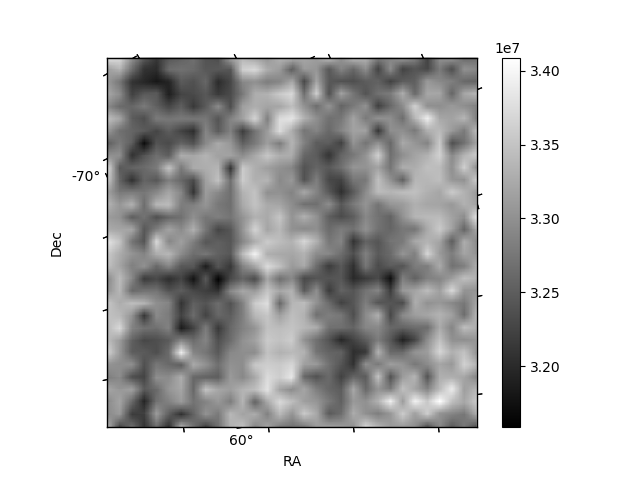
Histogram calculated using DETX and DETY for each event in the final _common_clean file
| Quadrant A | 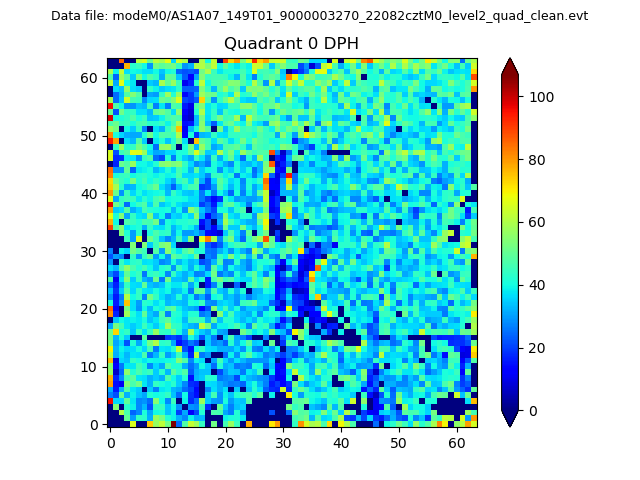 |
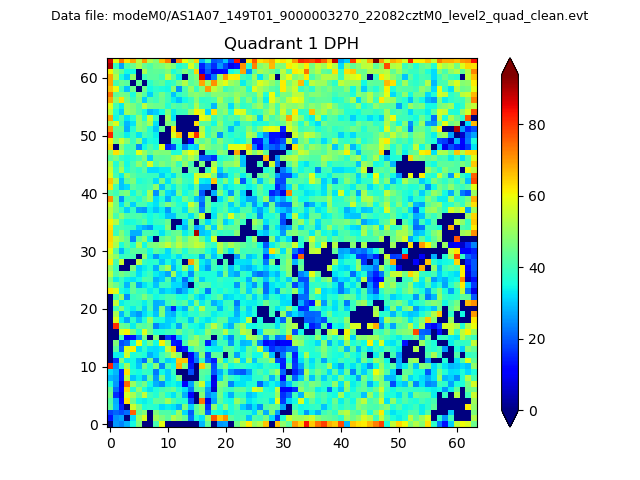 |
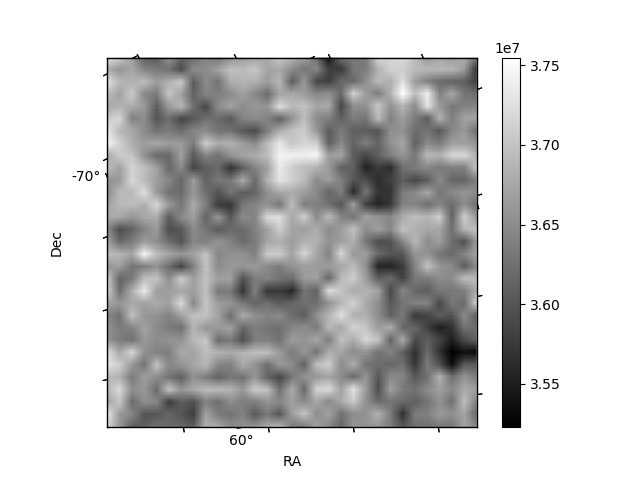
Quadrant B |
|---|---|---|---|
| Quadrant D | 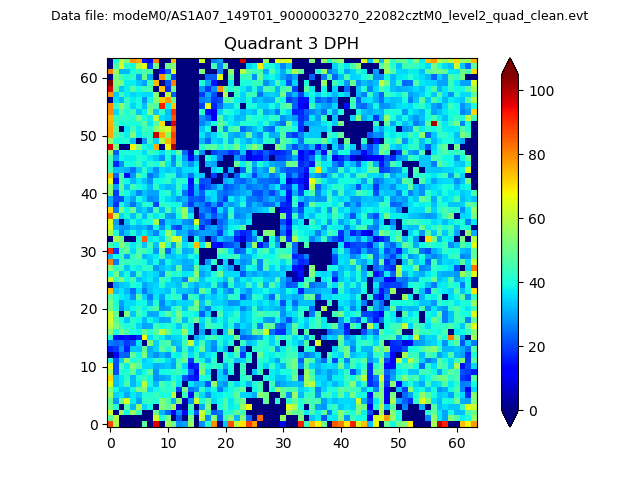 |
 |
Quadrant C |
| Plot type | Count rate plots | Images |
|---|---|---|
| Comparison with Poisson distribution Blue bars denote a histogram of data divided into 1 sec bins. Red curve is a Poisson curve with rate = median count rate of data. |
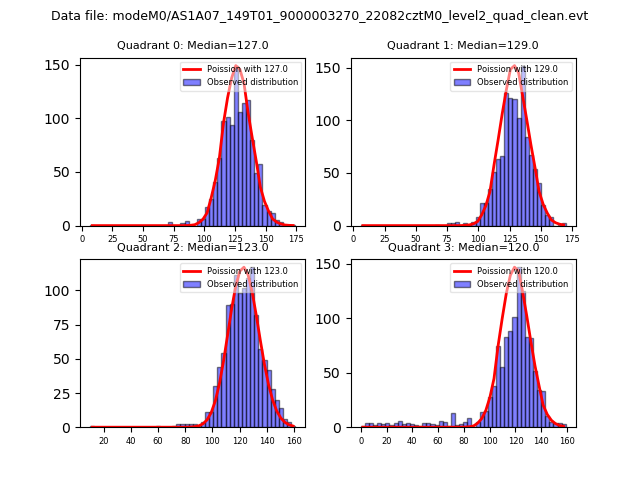 |
 |
| Quadrant-wise count rates Data is divided into 100 sec bins |
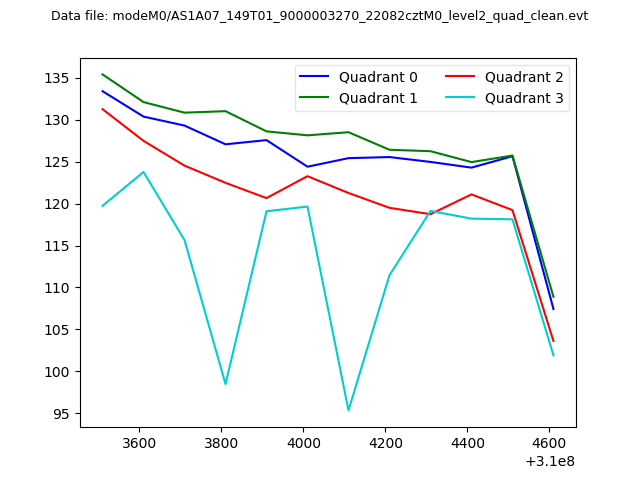 |
|
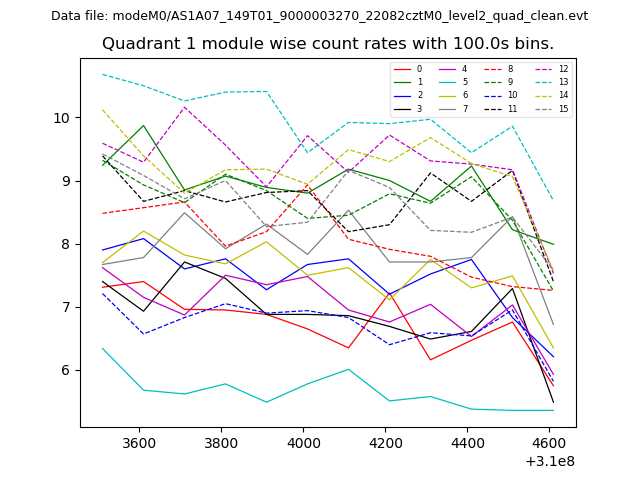
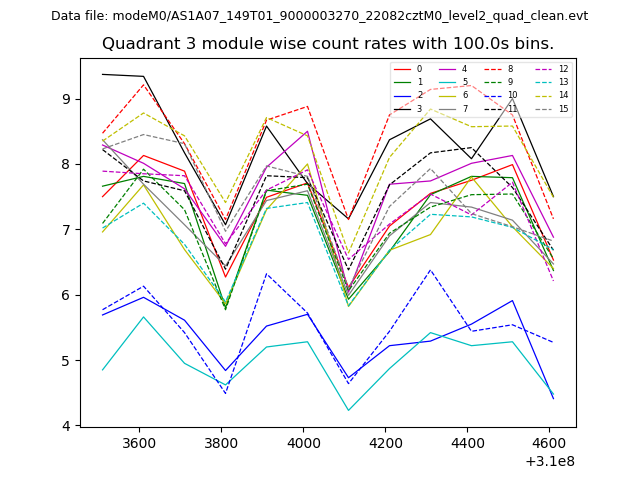
| Module-wise count rates for Quadrant A Data is divided into 100 sec bins |
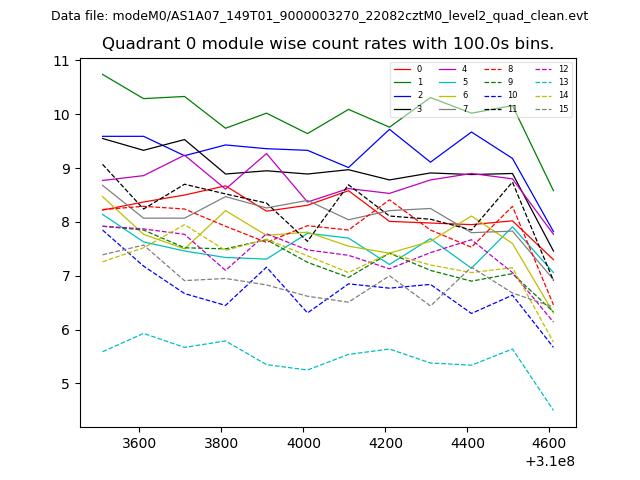 |
 |
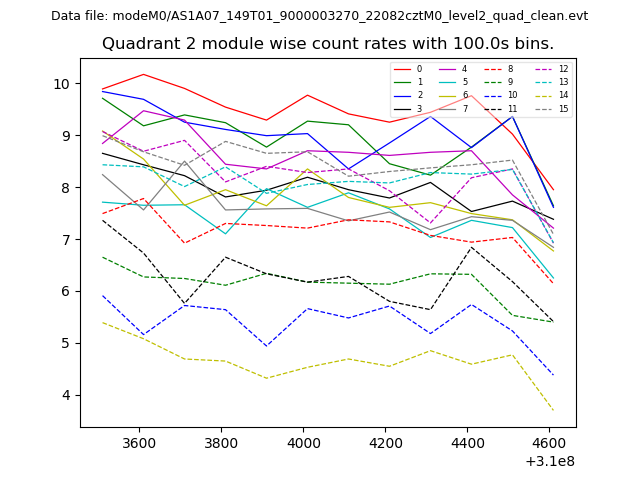
| Module-wise count rates for Quadrant B Data is divided into 100 sec bins |
 |
 |
| Module-wise count rates for Quadrant C Data is divided into 100 sec bins |
 |
 |
| Module-wise count rates for Quadrant D Data is divided into 100 sec bins |
 |
 |
| Parameter | Plot |
|---|---|
| CZT HV Monitor | 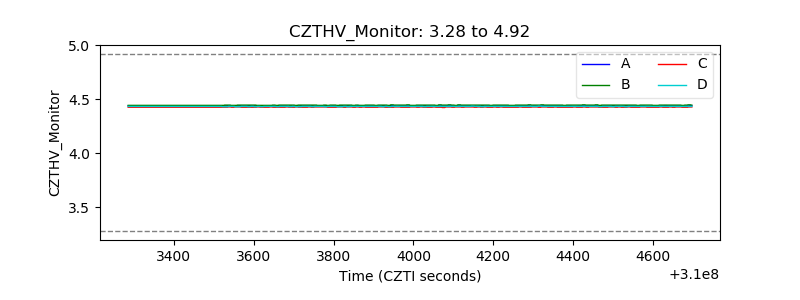 |
| D_VDD | 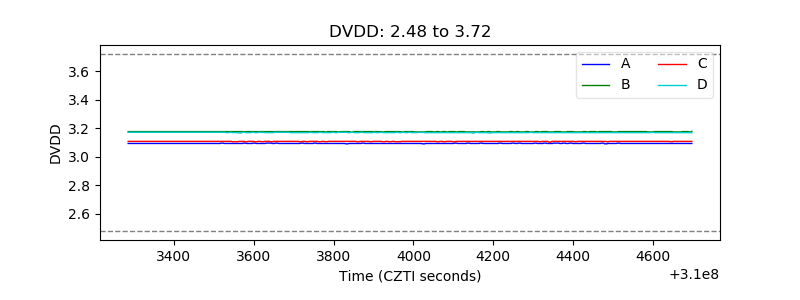 |
| Temperature 1 | 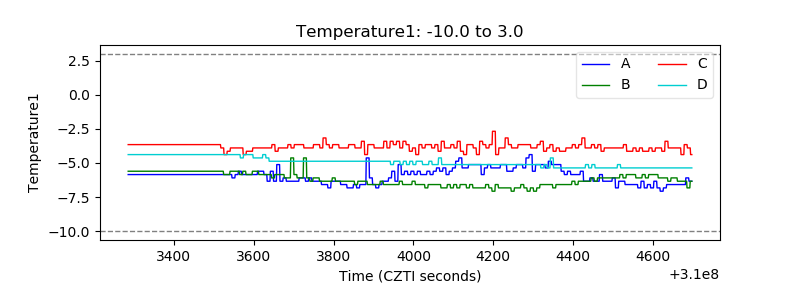 |
| Veto HV Monitor | 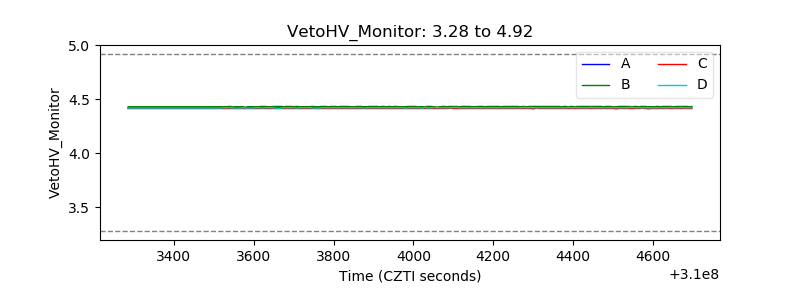 |
| Veto LLD |  |
| Alpha Counter | 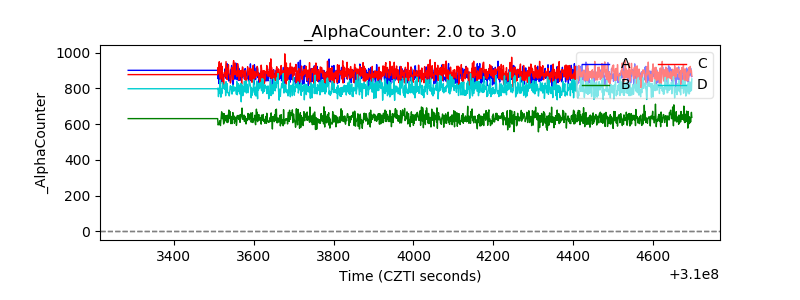 |
| _CPM_Rate | 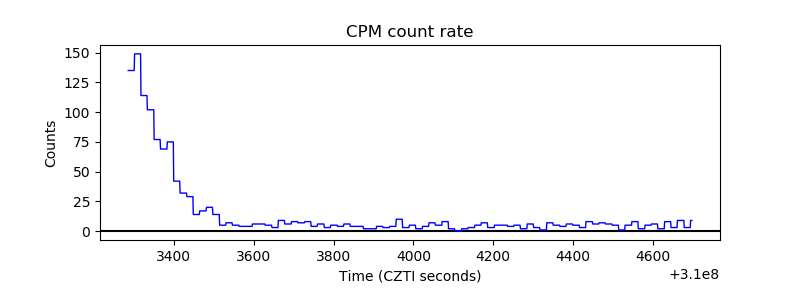 |
| CZT Counter | 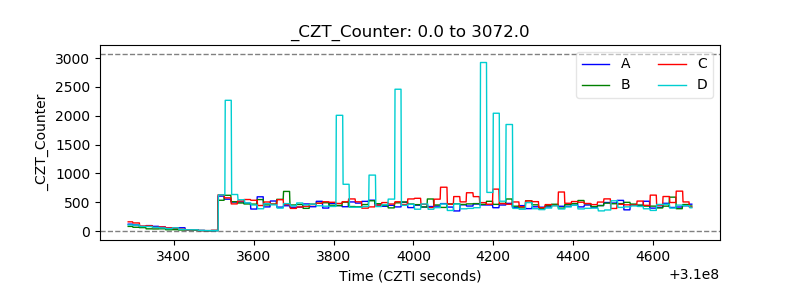 |
| +2.5 Volts monitor |  |
| +5 Volts monitor |  |
| _ROLL_ROT |  |
| _Roll_DEC | 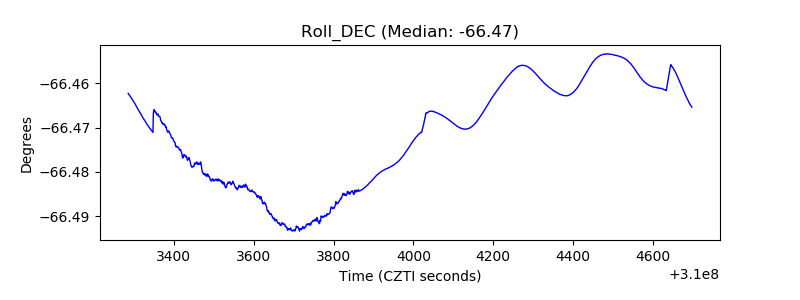 |
| _Roll_RA | 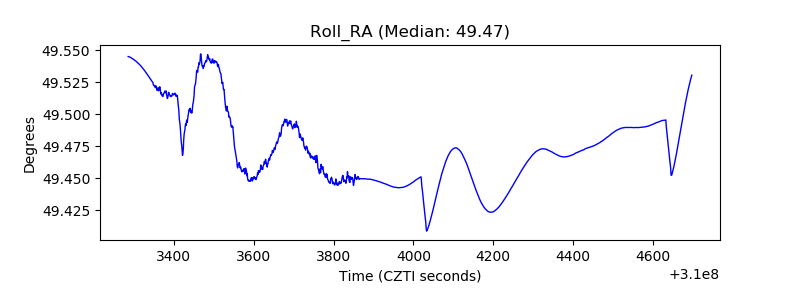 |
| Veto Counter | 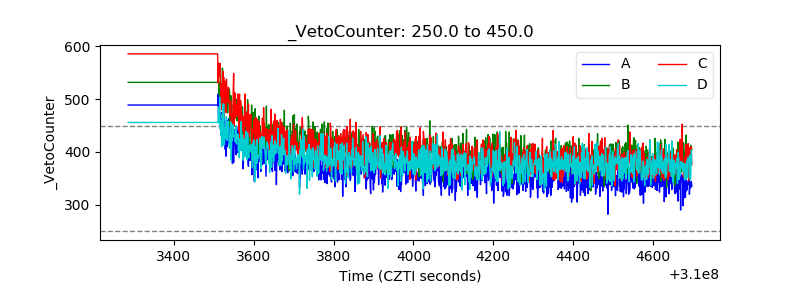 |