| Param | Original file | Final file |
|---|---|---|
| Filename | modeM0/AS1T03_146T01_9000003272_22082cztM0_level2.evt | modeM0/AS1T03_146T01_9000003272_22082cztM0_level2_quad_clean.evt |
| Size (bytes) | 370,949,760 | 58,219,200 |
| Size | 353.8 MB | 55.5 MB |
| Events in quadrant A | 2,171,753 | 372,073 |
| Events in quadrant B | 2,248,809 | 378,006 |
| Events in quadrant C | 2,757,276 | 358,231 |
| Events in quadrant D | 3,749,848 | 337,675 |
| Mode SS | |||
|---|---|---|---|
| Quadrant | BADHDUFLAG | Total packets | Discarded packets |
| A | 0 | 94 | 0 |
| B | 0 | 94 | 0 |
| C | 0 | 94 | 0 |
| D | 0 | 94 | 0 |
| Mode M9 | |||
|---|---|---|---|
| Quadrant | BADHDUFLAG | Total packets | Discarded packets |
| A | 0 | 7 | 0 |
| B | 0 | 7 | 0 |
| C | 0 | 7 | 0 |
| D | 0 | 7 | 0 |
| Mode M0 | |||
|---|---|---|---|
| Quadrant | BADHDUFLAG | Total packets | Discarded packets |
| A | 0 | 9169 | 1 |
| B | 0 | 9349 | 1 |
| C | 0 | 11125 | 1 |
| D | 0 | 14075 | 9 |
| Quadrant | Total seconds | Saturated seconds | Saturation percentage |
|---|---|---|---|
| A | 4495 | 36 | 0.800890% |
| B | 4495 | 56 | 1.245829% |
| C | 4495 | 87 | 1.935484% |
| D | 4494 | 555 | 12.349800% |
Noise dominated data is calculated using 1-second bins in cleaned event files. If a bin has >2000 counts, and if more than 50% of those come from <1% of pixels, then it is considered to be noise-dominated and hence unusable.
| Quadrant | # 1 sec bins | Bins with >0 counts | Bins with >2000 counts | High rate bins dominated by noise | Noise dominated (total time) | Noise dominated (detector-on time) | Marked lightcurve |
|---|---|---|---|---|---|---|---|
| A | 5275 | 4496 | 0 | 0 | 0.00% | 0.00% | 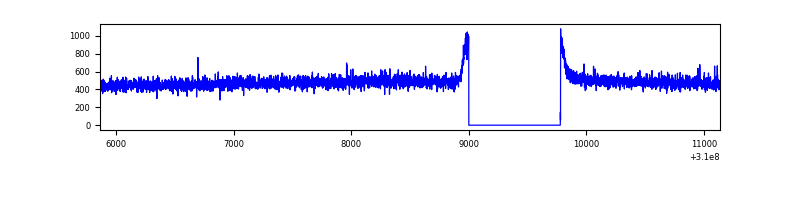 |
| B | 5275 | 4496 | 1 | 1 | 0.02% | 0.02% | 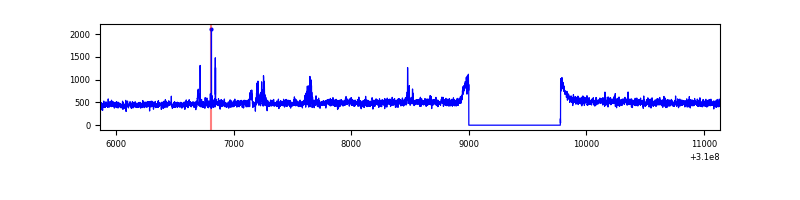 |
| C | 5275 | 4496 | 6 | 6 | 0.11% | 0.13% | 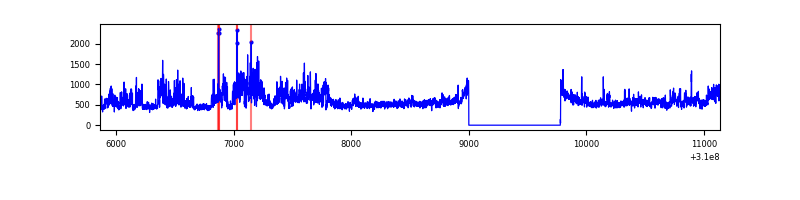 |
| D | 5274 | 4495 | 502 | 502 | 9.52% | 11.17% | 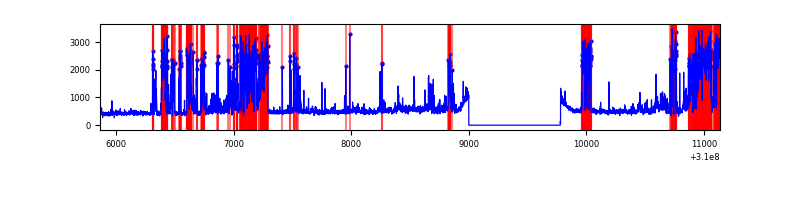 |
Top three noisy pixels from each quadrant. If the there are fewer than three noisy pixels in the level2.evt file, extra rows are filled as -1
| Pixel properties | Quadrant properties | ||||||
|---|---|---|---|---|---|---|---|
| Quadrant | DetID | PixID | Counts | Sigma | Mean | Median | Sigma |
| A | 13 | 254 | 7360 | 59.96 | 562 | 550 | 113.6 |
| A | 3 | 137 | 4807 | 37.48 | 562 | 550 | 113.6 |
| A | 0 | 226 | 4748 | 36.96 | 562 | 550 | 113.6 |
| B | 0 | 197 | 26307 | 235.35 | 561 | 547 | 109.5 |
| B | 0 | 190 | 14389 | 126.47 | 561 | 547 | 109.5 |
| B | 12 | 111 | 13288 | 116.41 | 561 | 547 | 109.5 |
| C | 0 | 239 | 576990 | 4520.06 | 536 | 539 | 127.5 |
| C | 14 | 238 | 83092 | 647.31 | 536 | 539 | 127.5 |
| C | 9 | 54 | 7177 | 52.05 | 536 | 539 | 127.5 |
| D | 1 | 52 | 1671988 | 13103.97 | 520 | 504 | 127.6 |
| D | 13 | 172 | 58994 | 458.55 | 520 | 504 | 127.6 |
| D | 2 | 16 | 31094 | 239.82 | 520 | 504 | 127.6 |
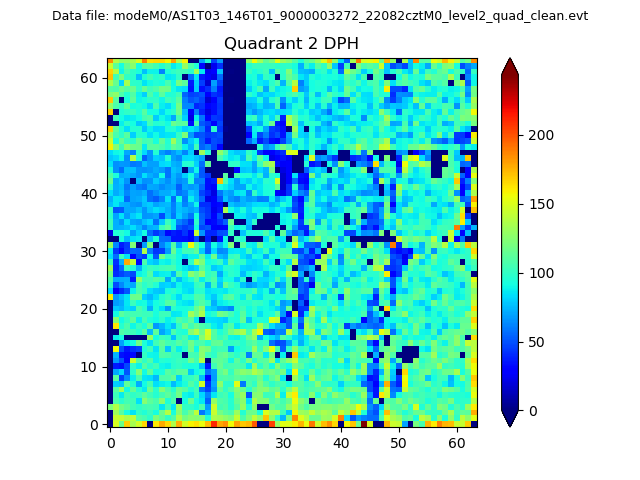
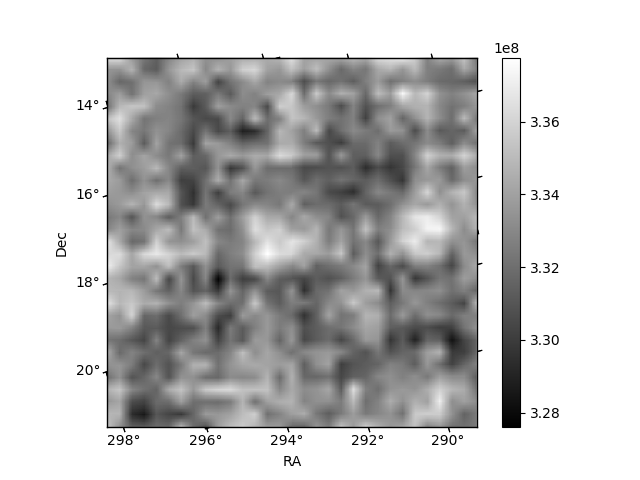
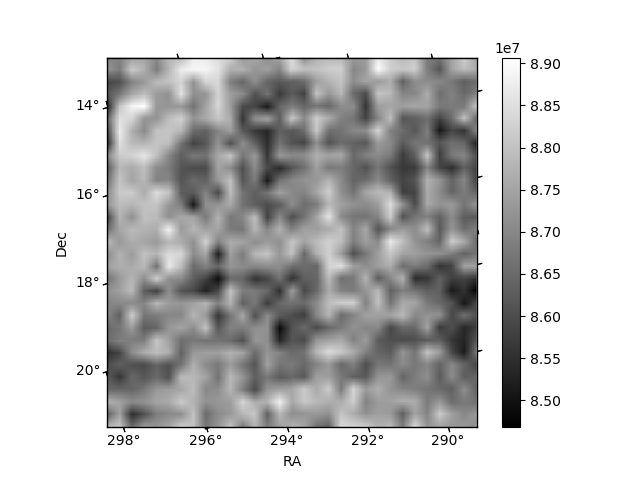
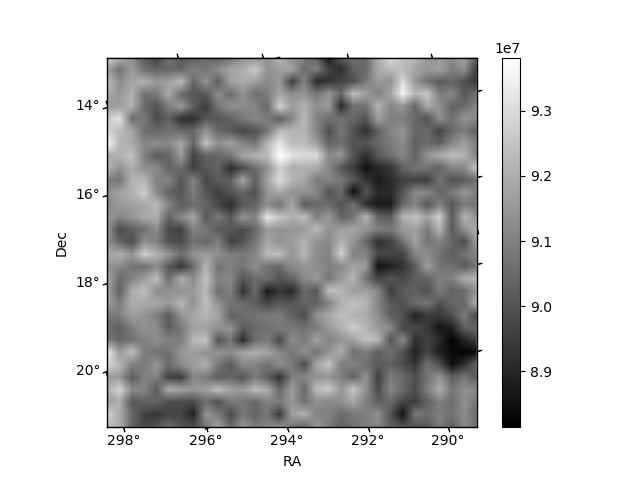
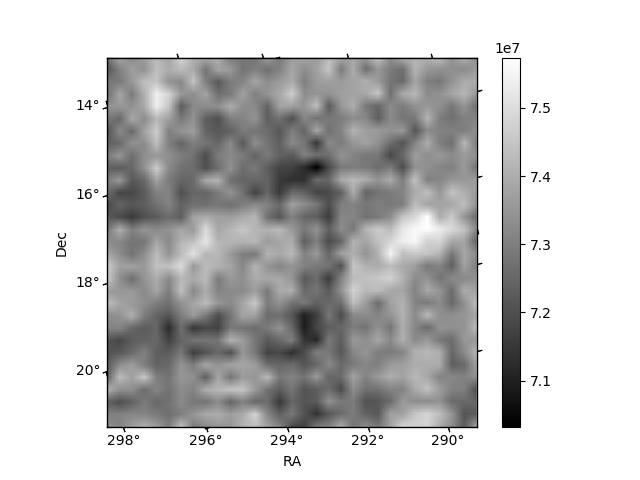
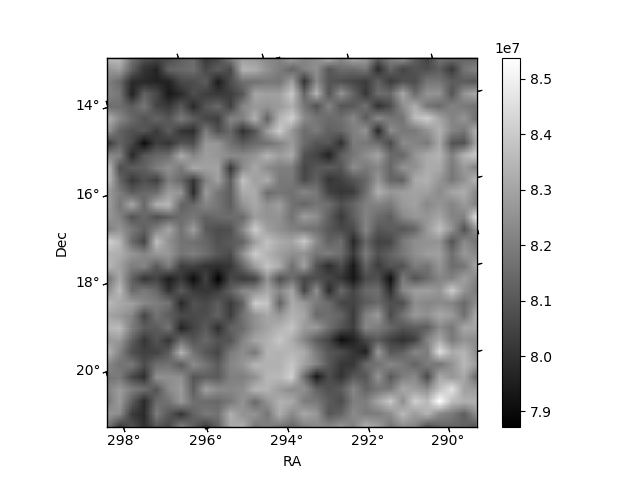
Histogram calculated using DETX and DETY for each event in the final _common_clean file
| Quadrant A | 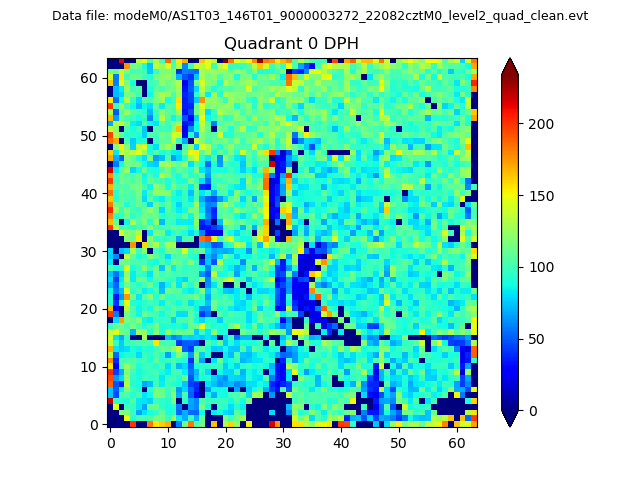 |
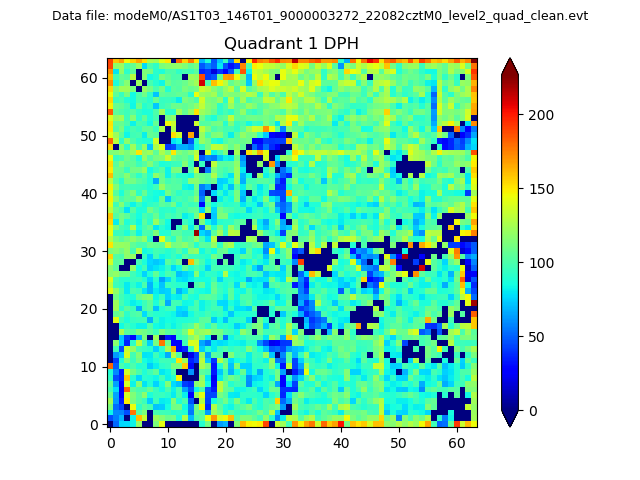 |
Quadrant B |
|---|---|---|---|
| Quadrant D | 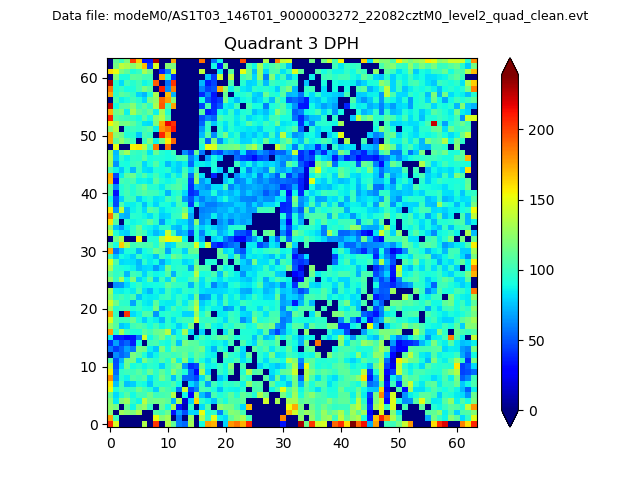 |
 |
Quadrant C |
| Plot type | Count rate plots | Images |
|---|---|---|
| Comparison with Poisson distribution Blue bars denote a histogram of data divided into 1 sec bins. Red curve is a Poisson curve with rate = median count rate of data. |
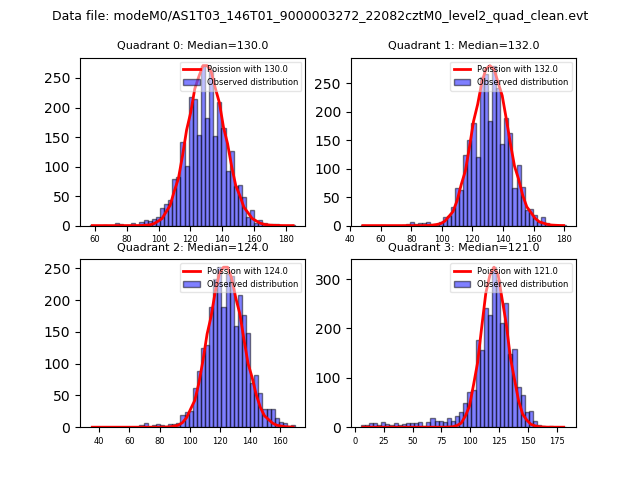 |
 |
| Quadrant-wise count rates Data is divided into 100 sec bins |
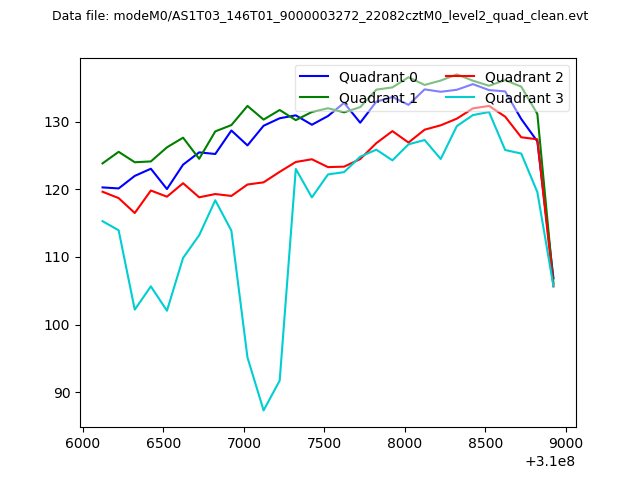 |
|
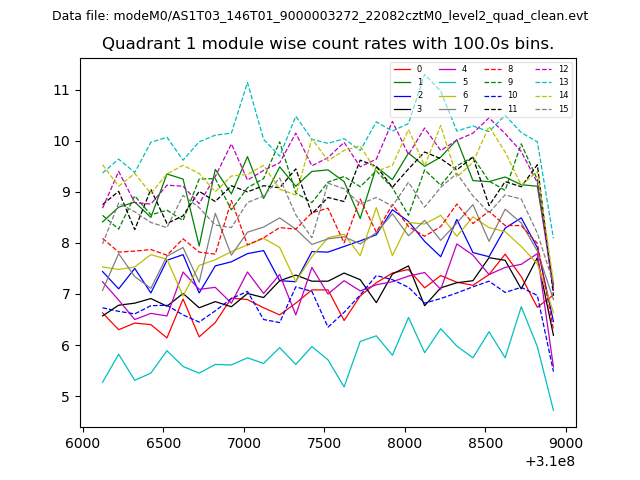
| Module-wise count rates for Quadrant A Data is divided into 100 sec bins |
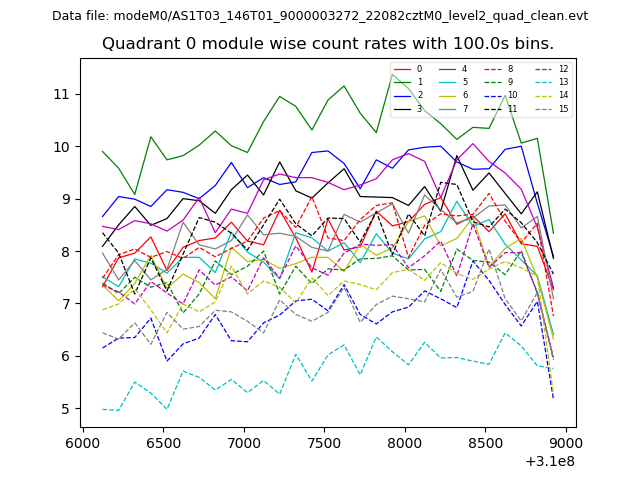 |
 |
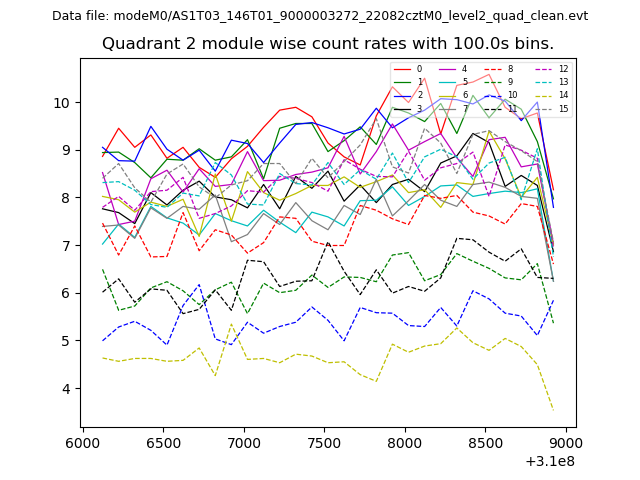
| Module-wise count rates for Quadrant B Data is divided into 100 sec bins |
 |
 |
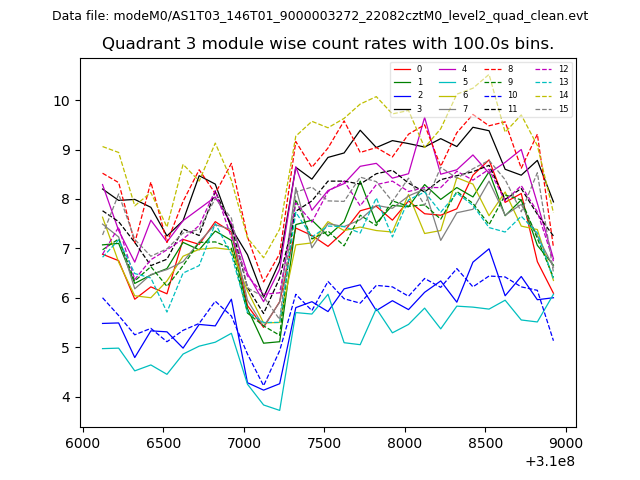
| Module-wise count rates for Quadrant C Data is divided into 100 sec bins |
 |
 |
| Module-wise count rates for Quadrant D Data is divided into 100 sec bins |
 |
 |
| Parameter | Plot |
|---|---|
| CZT HV Monitor | 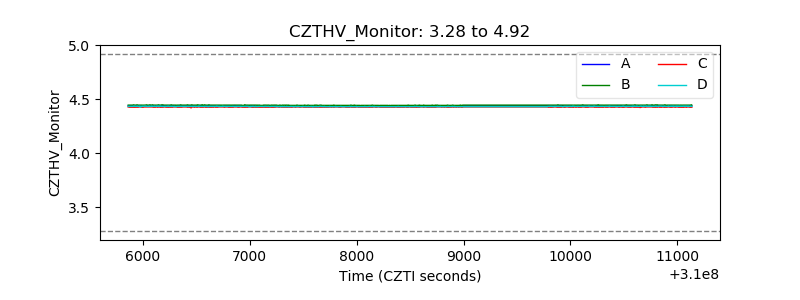 |
| D_VDD |  |
| Temperature 1 | 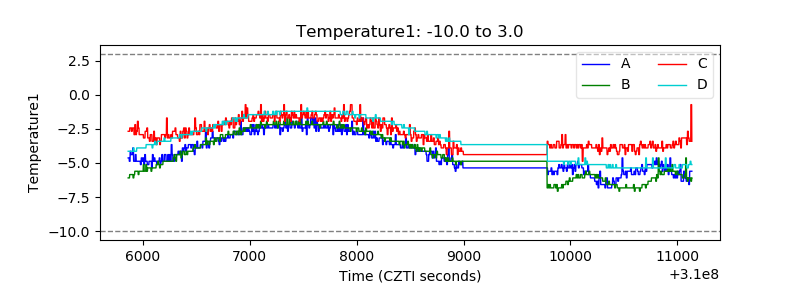 |
| Veto HV Monitor |  |
| Veto LLD | 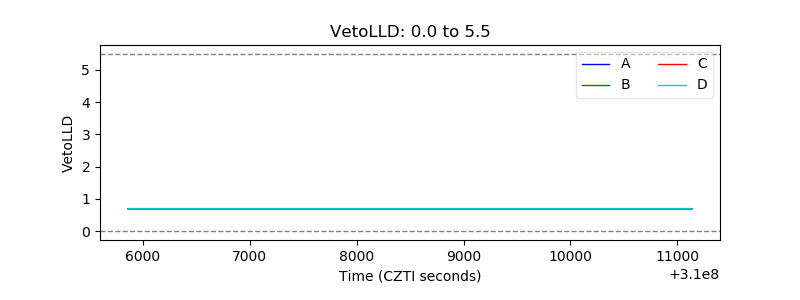 |
| Alpha Counter | 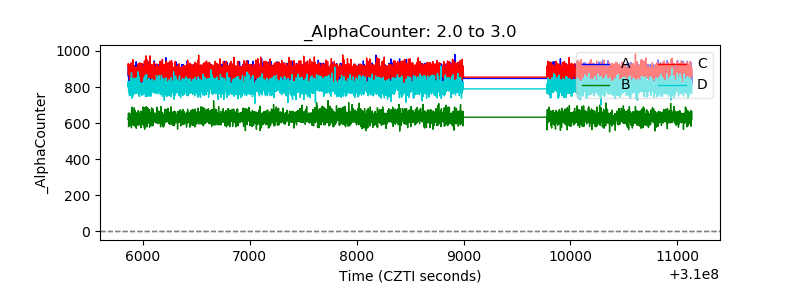 |
| _CPM_Rate | 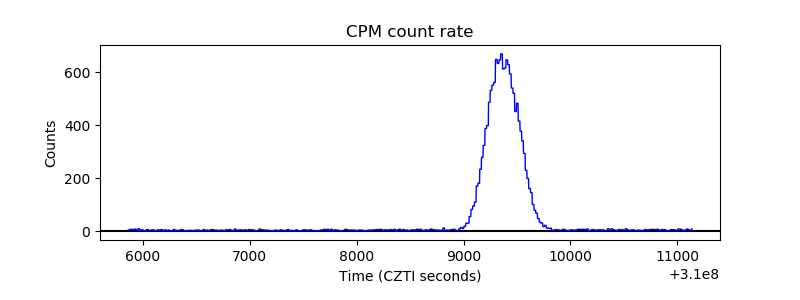 |
| CZT Counter | 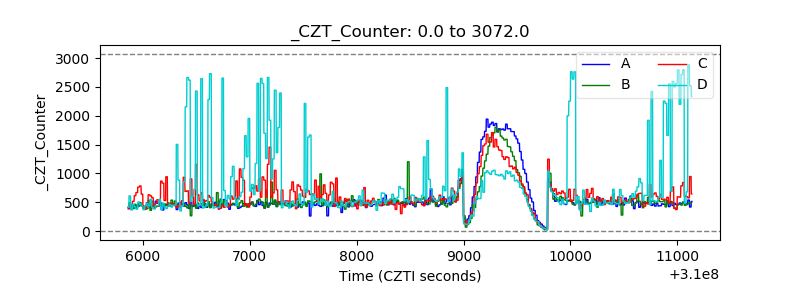 |
| +2.5 Volts monitor |  |
| +5 Volts monitor |  |
| _ROLL_ROT | 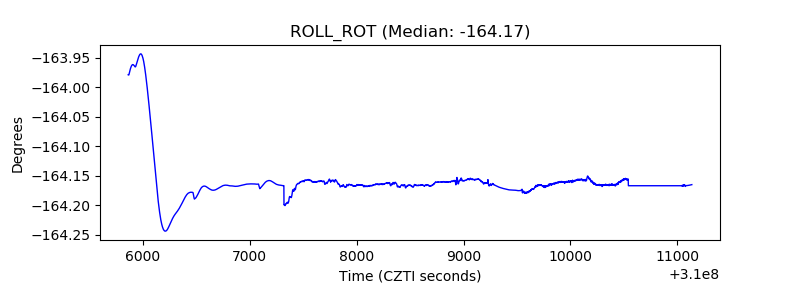 |
| _Roll_DEC | 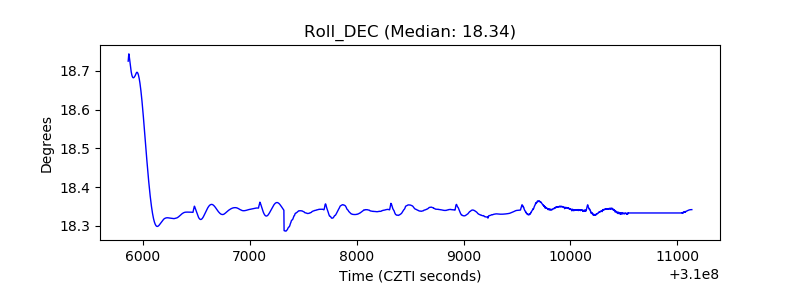 |
| _Roll_RA | 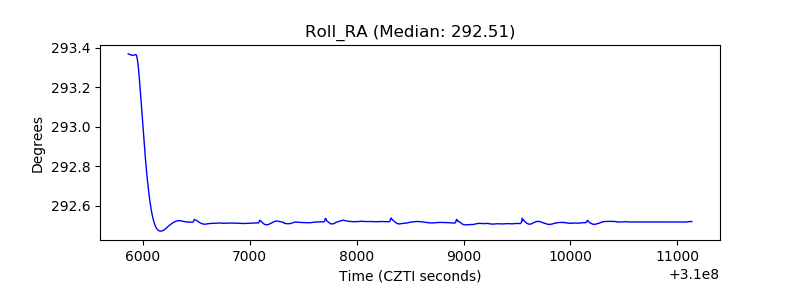 |
| Veto Counter | 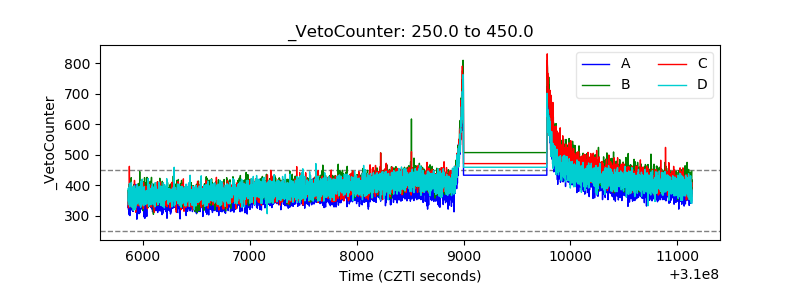 |