| Param | Original file | Final file |
|---|---|---|
| Filename | modeM0/AS1T03_146T01_9000003272_22086cztM0_level2.evt | modeM0/AS1T03_146T01_9000003272_22086cztM0_level2_quad_clean.evt |
| Size (bytes) | 566,372,160 | 86,063,040 |
| Size | 540.1 MB | 82.1 MB |
| Events in quadrant A | 3,617,328 | 565,839 |
| Events in quadrant B | 3,485,535 | 576,913 |
| Events in quadrant C | 3,837,101 | 537,486 |
| Events in quadrant D | 5,779,548 | 479,725 |
| Mode SS | |||
|---|---|---|---|
| Quadrant | BADHDUFLAG | Total packets | Discarded packets |
| A | 0 | 130 | 0 |
| B | 0 | 130 | 0 |
| C | 0 | 130 | 0 |
| D | 0 | 130 | 0 |
| Mode M9 | |||
|---|---|---|---|
| Quadrant | BADHDUFLAG | Total packets | Discarded packets |
| A | 0 | 14 | 0 |
| B | 0 | 15 | 0 |
| C | 0 | 15 | 0 |
| D | 0 | 15 | 0 |
| Mode M0 | |||
|---|---|---|---|
| Quadrant | BADHDUFLAG | Total packets | Discarded packets |
| A | 0 | 14778 | 2 |
| B | 0 | 14379 | 2 |
| C | 0 | 15554 | 2 |
| D | 0 | 21330 | 2 |
| Quadrant | Total seconds | Saturated seconds | Saturation percentage |
|---|---|---|---|
| A | 6392 | 137 | 2.143304% |
| B | 6392 | 109 | 1.705257% |
| C | 6392 | 191 | 2.988110% |
| D | 6392 | 821 | 12.844180% |
Noise dominated data is calculated using 1-second bins in cleaned event files. If a bin has >2000 counts, and if more than 50% of those come from <1% of pixels, then it is considered to be noise-dominated and hence unusable.
| Quadrant | # 1 sec bins | Bins with >0 counts | Bins with >2000 counts | High rate bins dominated by noise | Noise dominated (total time) | Noise dominated (detector-on time) | Marked lightcurve |
|---|---|---|---|---|---|---|---|
| A | 7562 | 6393 | 36 | 36 | 0.48% | 0.56% | 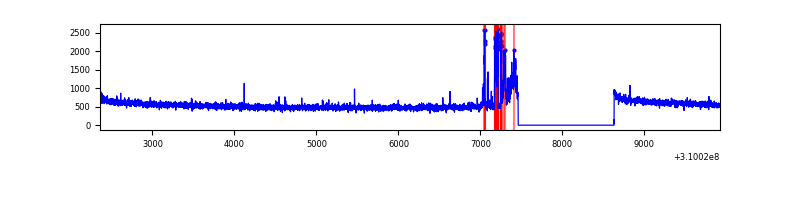 |
| B | 7562 | 6393 | 0 | 0 | 0.00% | 0.00% | 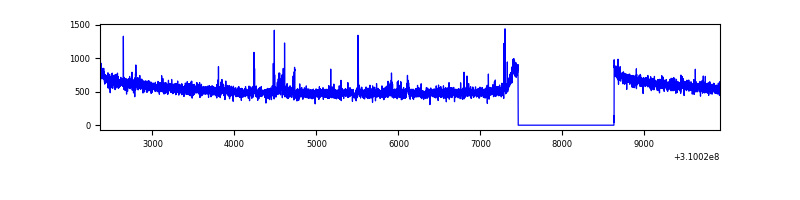 |
| C | 7562 | 6393 | 46 | 46 | 0.61% | 0.72% | 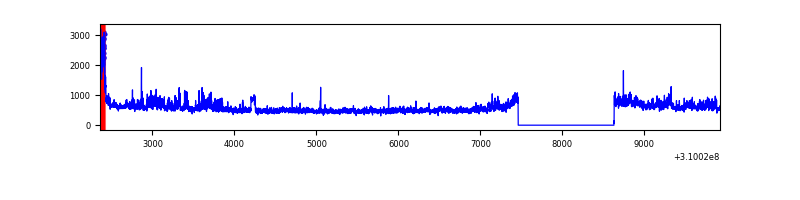 |
| D | 7562 | 6393 | 685 | 685 | 9.06% | 10.71% | 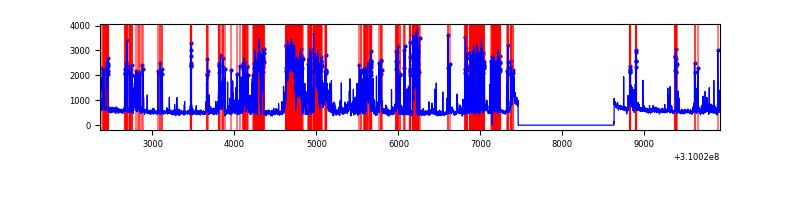 |
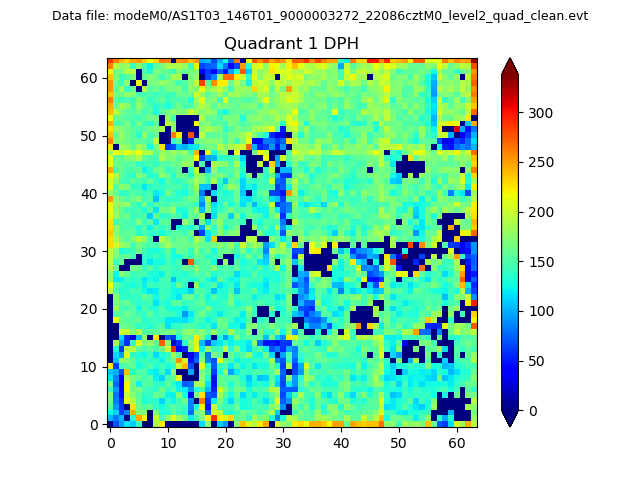
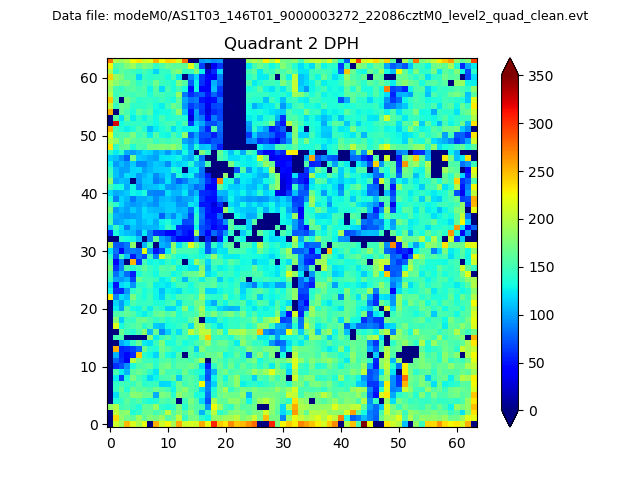
Top three noisy pixels from each quadrant. If the there are fewer than three noisy pixels in the level2.evt file, extra rows are filled as -1
| Pixel properties | Quadrant properties | ||||||
|---|---|---|---|---|---|---|---|
| Quadrant | DetID | PixID | Counts | Sigma | Mean | Median | Sigma |
| A | 14 | 235 | 223654 | 1264.87 | 879 | 864 | 176.1 |
| A | 13 | 254 | 11410 | 59.87 | 879 | 864 | 176.1 |
| A | 0 | 226 | 7844 | 39.63 | 879 | 864 | 176.1 |
| B | 0 | 197 | 22448 | 129.79 | 878 | 859 | 166.3 |
| B | 12 | 111 | 19341 | 111.11 | 878 | 859 | 166.3 |
| B | 11 | 111 | 17138 | 97.87 | 878 | 859 | 166.3 |
| C | 0 | 239 | 349120 | 1834.88 | 818 | 826 | 189.8 |
| C | 9 | 54 | 168478 | 883.22 | 818 | 826 | 189.8 |
| C | 14 | 238 | 130469 | 682.98 | 818 | 826 | 189.8 |
| D | 1 | 52 | 2619099 | 13482.7 | 801 | 778 | 194.2 |
| D | 2 | 136 | 58051 | 294.92 | 801 | 778 | 194.2 |
| D | 5 | 222 | 36206 | 182.43 | 801 | 778 | 194.2 |
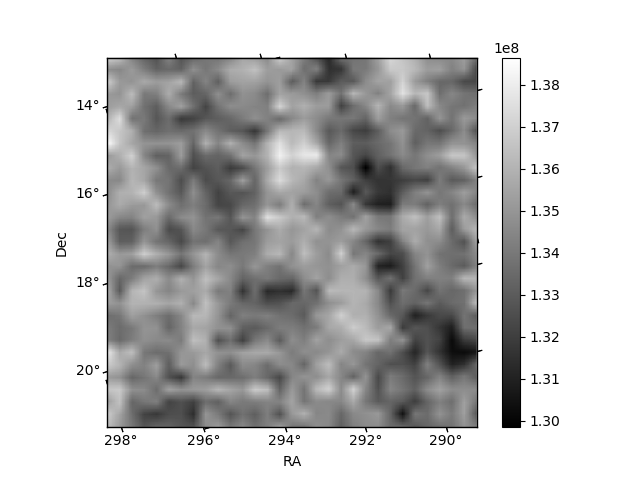
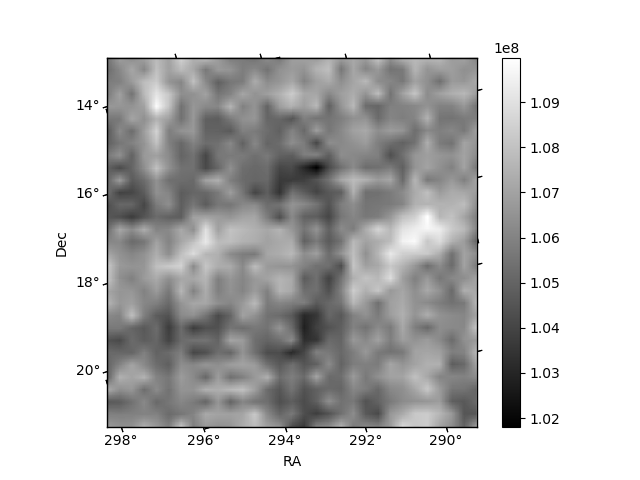
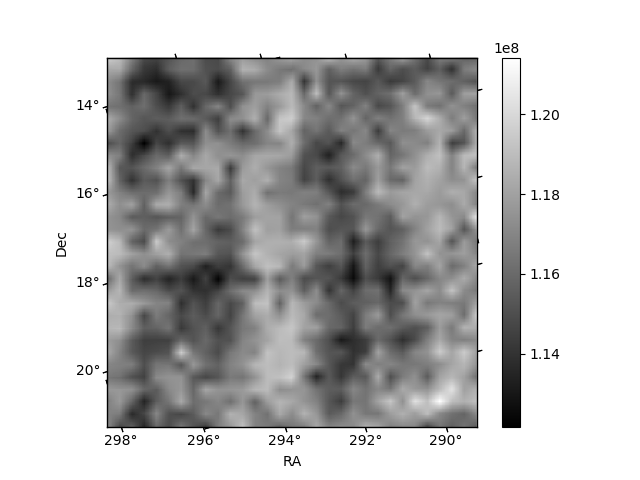
Histogram calculated using DETX and DETY for each event in the final _common_clean file
| Quadrant A | 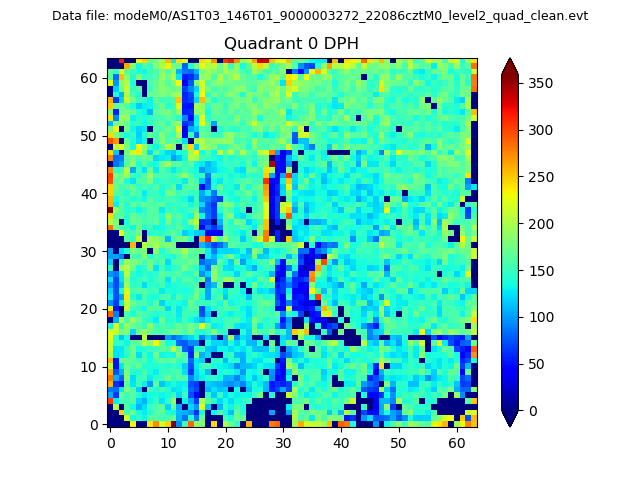 |
 |
Quadrant B |
|---|---|---|---|
| Quadrant D | 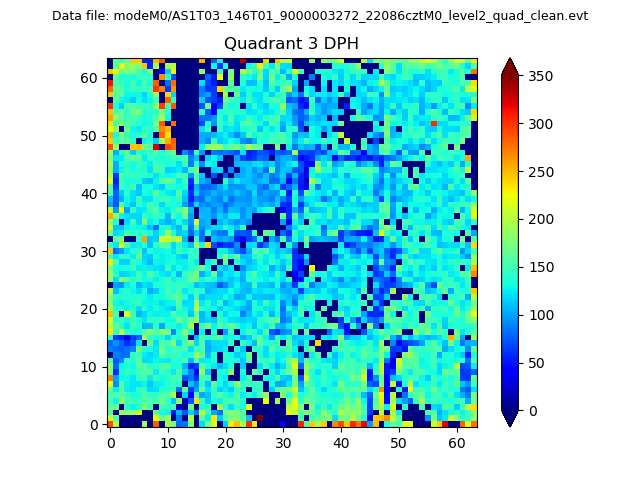 |
 |
Quadrant C |
| Plot type | Count rate plots | Images |
|---|---|---|
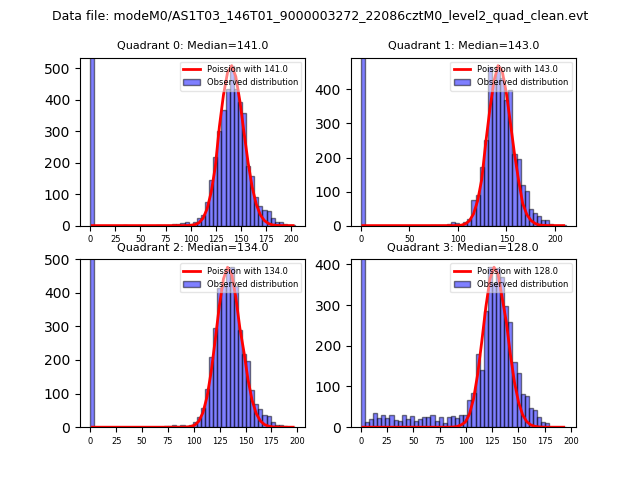
| Comparison with Poisson distribution Blue bars denote a histogram of data divided into 1 sec bins. Red curve is a Poisson curve with rate = median count rate of data. |
 |
 |
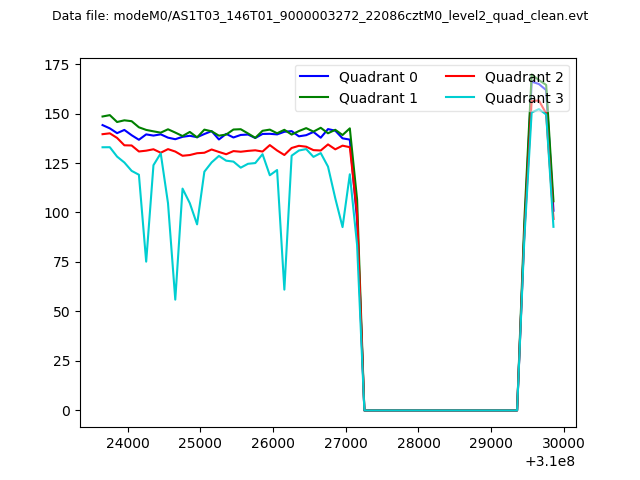
| Quadrant-wise count rates Data is divided into 100 sec bins |
 |
|
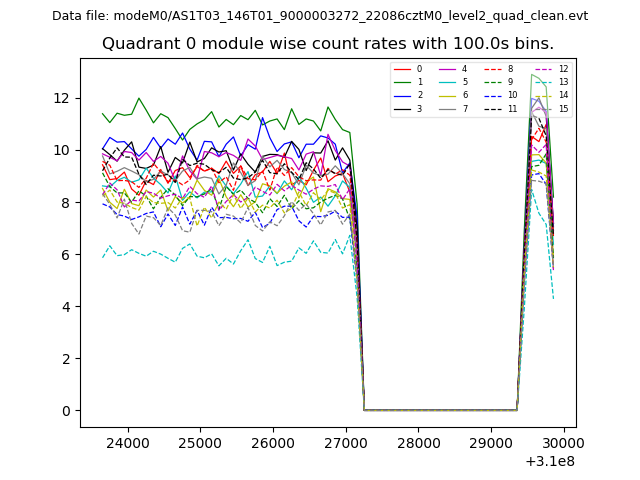
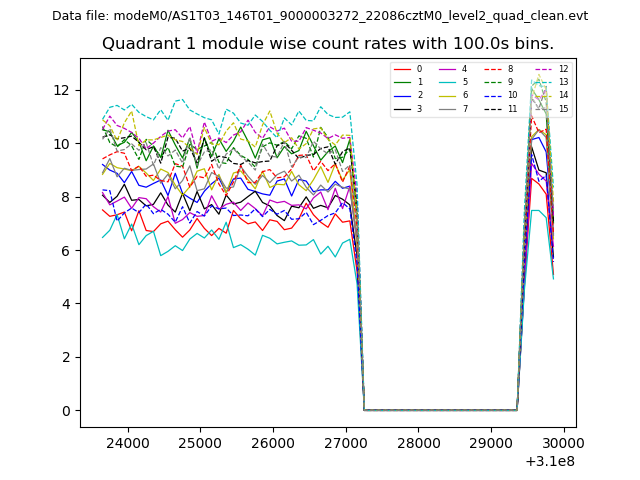
| Module-wise count rates for Quadrant A Data is divided into 100 sec bins |
 |
 |
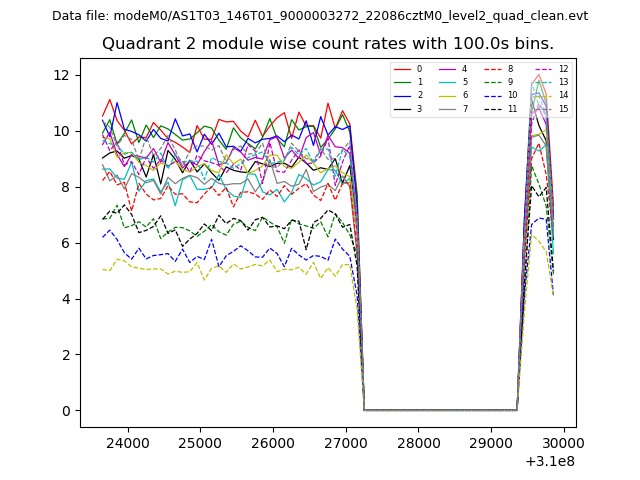
| Module-wise count rates for Quadrant B Data is divided into 100 sec bins |
 |
 |
| Module-wise count rates for Quadrant C Data is divided into 100 sec bins |
 |
 |
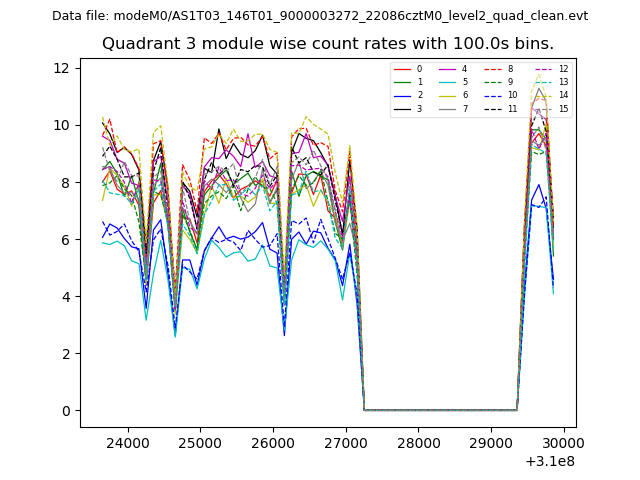
| Module-wise count rates for Quadrant D Data is divided into 100 sec bins |
 |
 |
| Parameter | Plot |
|---|---|
| CZT HV Monitor | 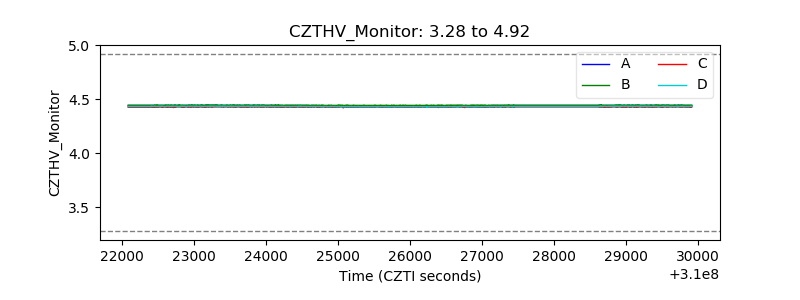 |
| D_VDD | 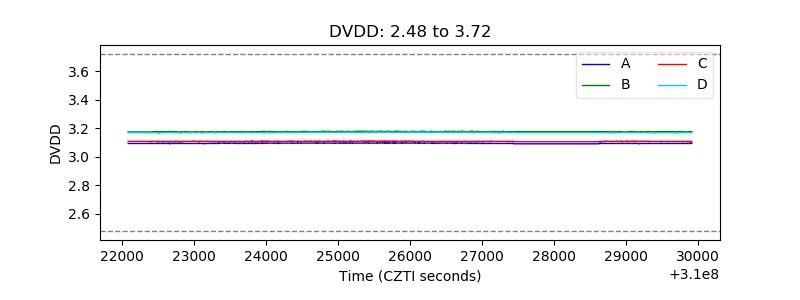 |
| Temperature 1 | 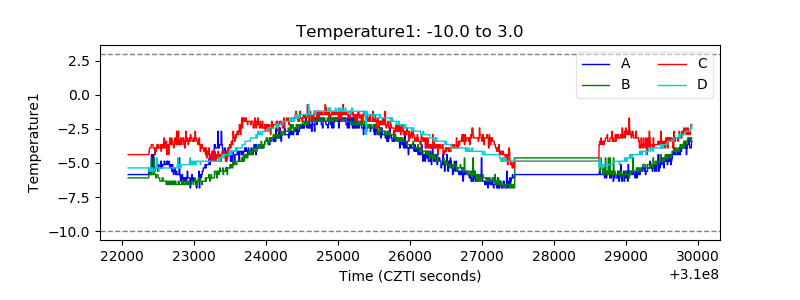 |
| Veto HV Monitor | 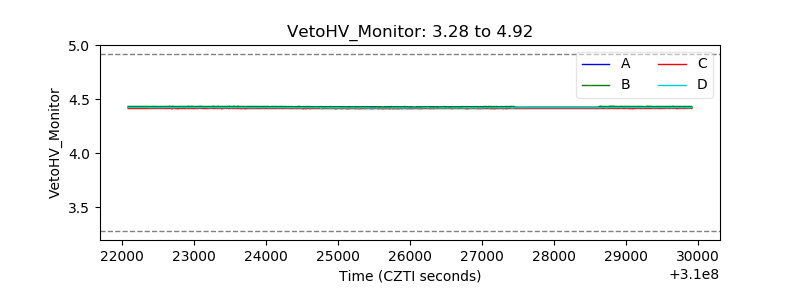 |
| Veto LLD | 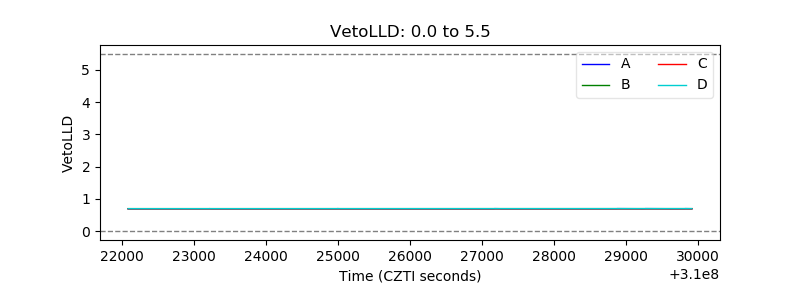 |
| Alpha Counter | 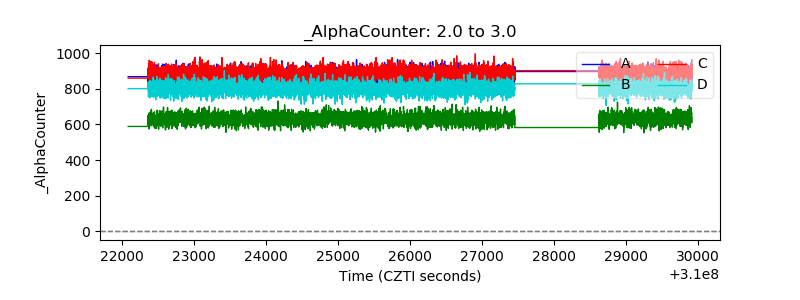 |
| _CPM_Rate | 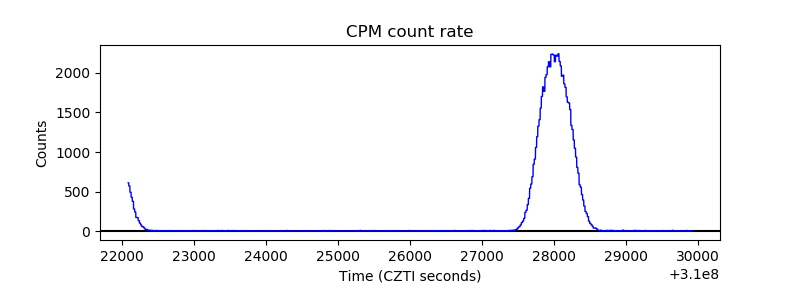 |
| CZT Counter | 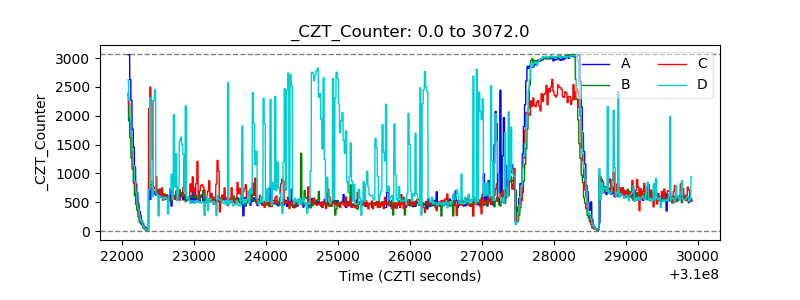 |
| +2.5 Volts monitor |  |
| +5 Volts monitor |  |
| _ROLL_ROT | 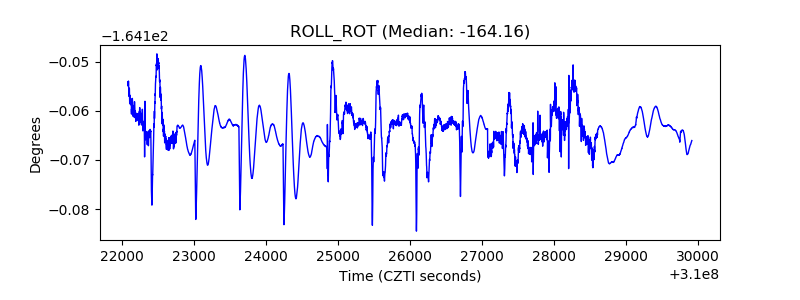 |
| _Roll_DEC | 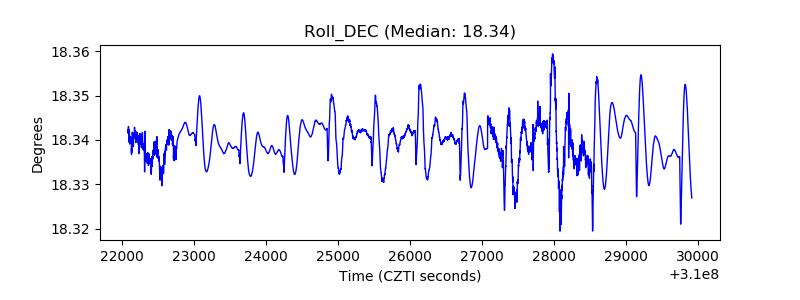 |
| _Roll_RA |  |
| Veto Counter | 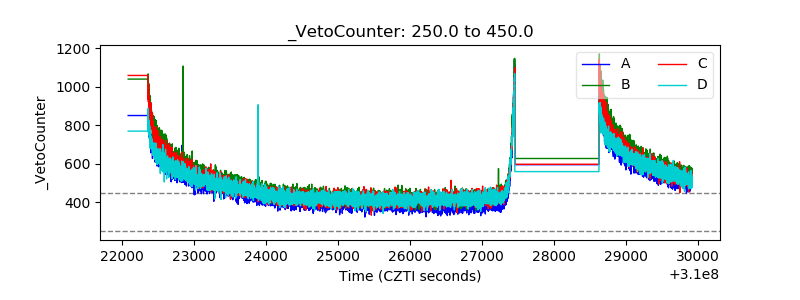 |