| Param | Original file | Final file |
|---|---|---|
| Filename | modeM0/AS1T03_146T01_9000003272_22089cztM0_level2.evt | modeM0/AS1T03_146T01_9000003272_22089cztM0_level2_quad_clean.evt |
| Size (bytes) | 482,100,480 | 104,440,320 |
| Size | 459.8 MB | 99.6 MB |
| Events in quadrant A | 3,280,017 | 714,669 |
| Events in quadrant B | 3,365,931 | 719,987 |
| Events in quadrant C | 3,139,604 | 664,489 |
| Events in quadrant D | 4,412,228 | 649,478 |
| Mode SS | |||
|---|---|---|---|
| Quadrant | BADHDUFLAG | Total packets | Discarded packets |
| A | 0 | 122 | 0 |
| B | 0 | 122 | 0 |
| C | 0 | 122 | 0 |
| D | 0 | 122 | 0 |
| Mode M9 | |||
|---|---|---|---|
| Quadrant | BADHDUFLAG | Total packets | Discarded packets |
| A | 0 | 12 | 0 |
| B | 0 | 12 | 0 |
| C | 0 | 12 | 0 |
| D | 0 | 12 | 0 |
| Mode M0 | |||
|---|---|---|---|
| Quadrant | BADHDUFLAG | Total packets | Discarded packets |
| A | 0 | 13318 | 1 |
| B | 0 | 13612 | 1 |
| C | 0 | 12870 | 1 |
| D | 0 | 17141 | 1 |
| Quadrant | Total seconds | Saturated seconds | Saturation percentage |
|---|---|---|---|
| A | 5929 | 156 | 2.631135% |
| B | 5929 | 166 | 2.799798% |
| C | 5929 | 134 | 2.260078% |
| D | 5929 | 240 | 4.047900% |
Noise dominated data is calculated using 1-second bins in cleaned event files. If a bin has >2000 counts, and if more than 50% of those come from <1% of pixels, then it is considered to be noise-dominated and hence unusable.
| Quadrant | # 1 sec bins | Bins with >0 counts | Bins with >2000 counts | High rate bins dominated by noise | Noise dominated (total time) | Noise dominated (detector-on time) | Marked lightcurve |
|---|---|---|---|---|---|---|---|
| A | 7179 | 5930 | 48 | 48 | 0.67% | 0.81% | 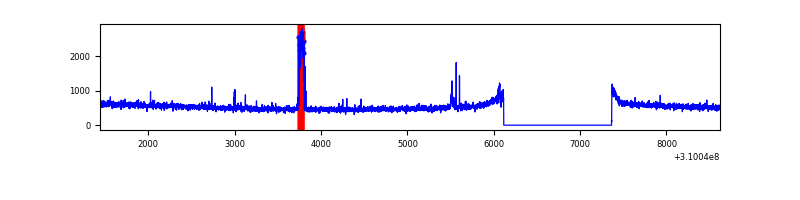 |
| B | 7179 | 5930 | 32 | 32 | 0.45% | 0.54% | 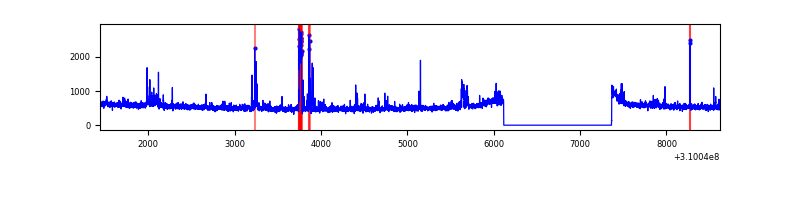 |
| C | 7179 | 5930 | 0 | 0 | 0.00% | 0.00% | 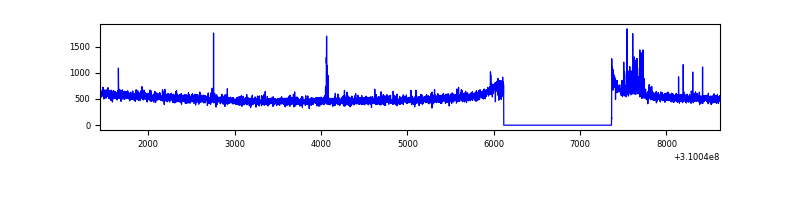 |
| D | 7179 | 5930 | 92 | 92 | 1.28% | 1.55% | 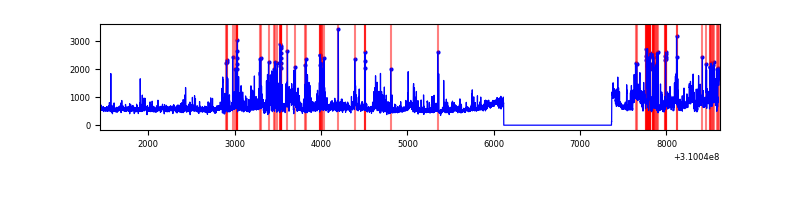 |
Top three noisy pixels from each quadrant. If the there are fewer than three noisy pixels in the level2.evt file, extra rows are filled as -1
| Pixel properties | Quadrant properties | ||||||
|---|---|---|---|---|---|---|---|
| Quadrant | DetID | PixID | Counts | Sigma | Mean | Median | Sigma |
| A | 15 | 174 | 136143 | 838.52 | 808 | 793 | 161.4 |
| A | 14 | 235 | 25271 | 151.65 | 808 | 793 | 161.4 |
| A | 13 | 254 | 10224 | 58.43 | 808 | 793 | 161.4 |
| B | 3 | 64 | 106419 | 706.1 | 796 | 782 | 149.6 |
| B | 0 | 197 | 48817 | 321.08 | 796 | 782 | 149.6 |
| B | 0 | 228 | 39978 | 261.99 | 796 | 782 | 149.6 |
| C | 14 | 238 | 121397 | 695.72 | 750 | 759 | 173.4 |
| C | 10 | 22 | 66145 | 377.08 | 750 | 759 | 173.4 |
| C | 5 | 112 | 18212 | 100.65 | 750 | 759 | 173.4 |
| D | 1 | 52 | 1295804 | 6974.48 | 770 | 751 | 185.7 |
| D | 2 | 16 | 64616 | 343.94 | 770 | 751 | 185.7 |
| D | 2 | 136 | 53267 | 282.82 | 770 | 751 | 185.7 |
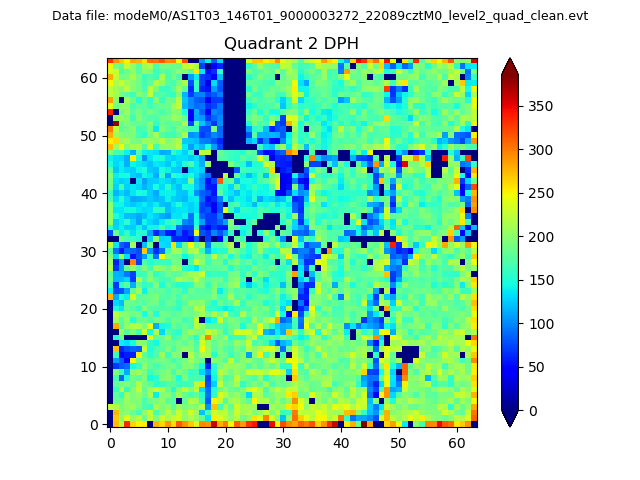
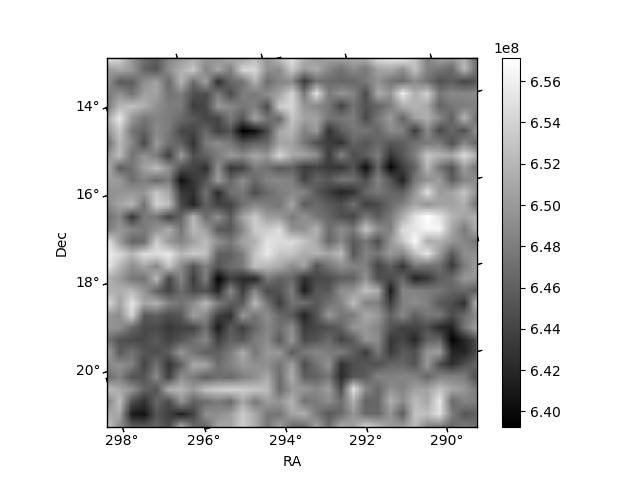
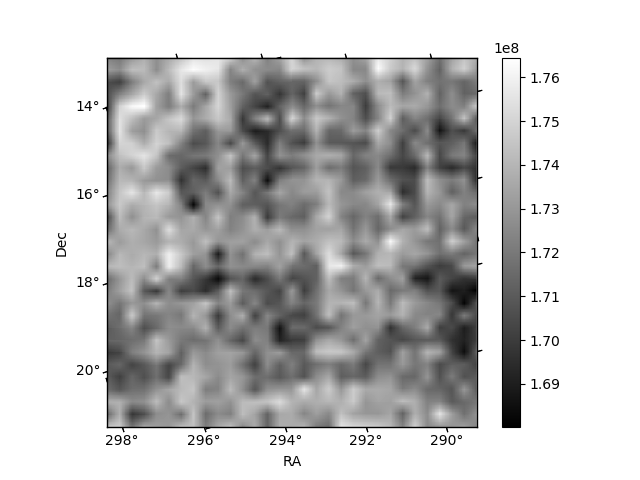
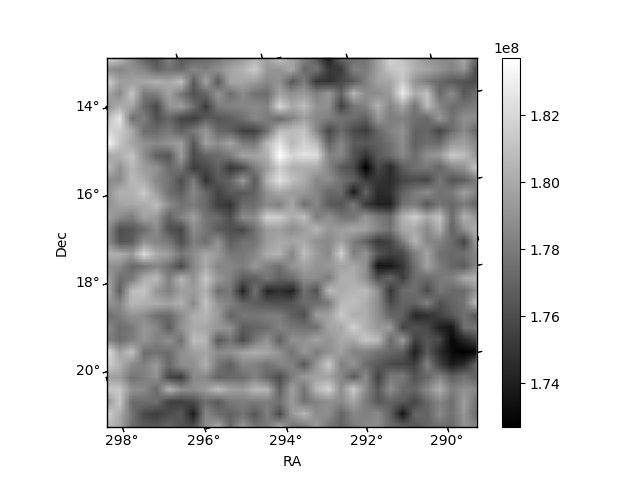
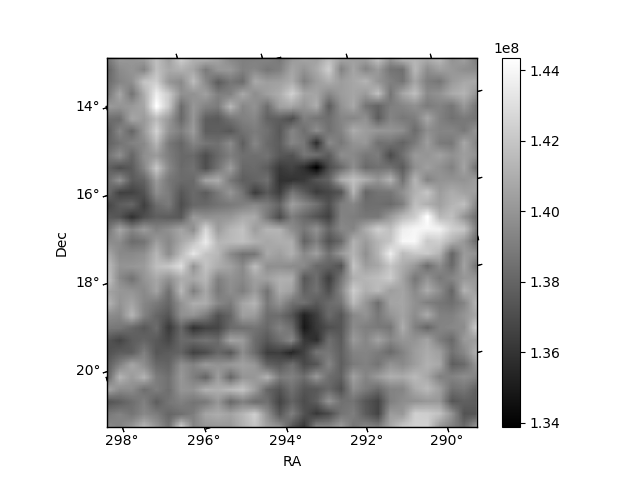
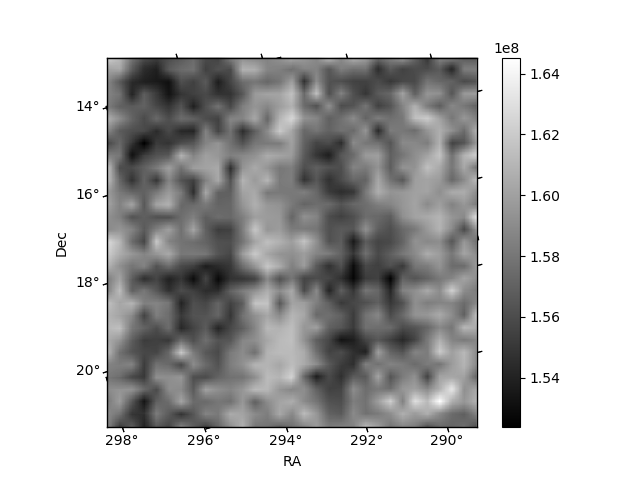
Histogram calculated using DETX and DETY for each event in the final _common_clean file
| Quadrant A | 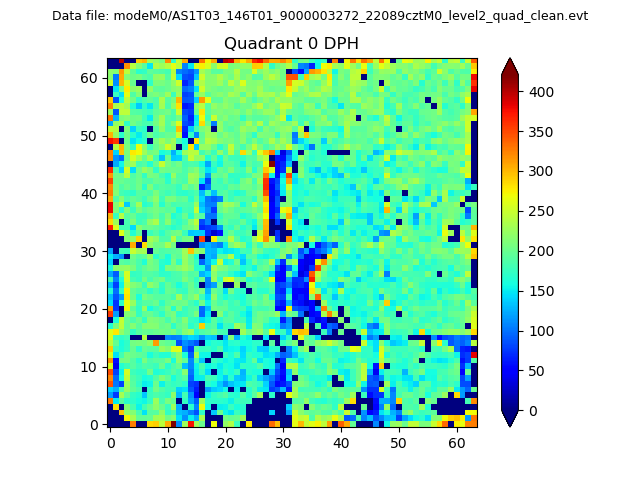 |
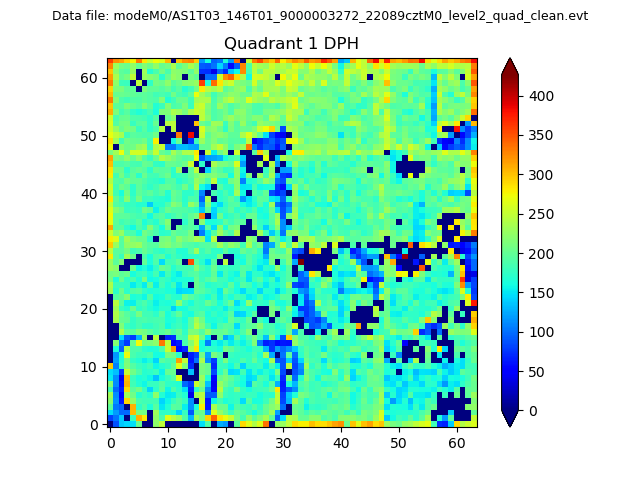 |
Quadrant B |
|---|---|---|---|
| Quadrant D | 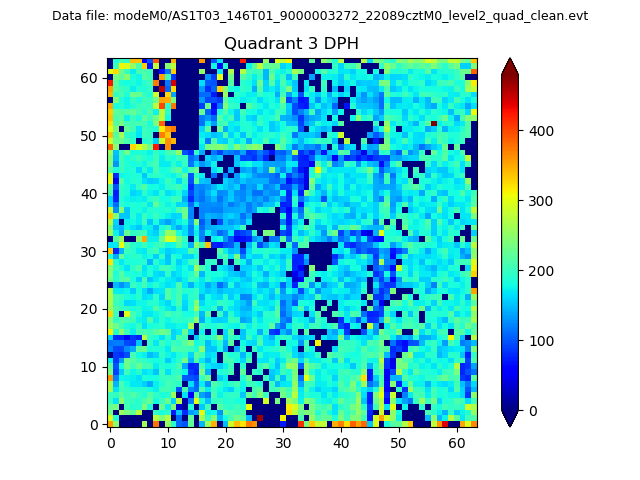 |
 |
Quadrant C |
| Plot type | Count rate plots | Images |
|---|---|---|
| Comparison with Poisson distribution Blue bars denote a histogram of data divided into 1 sec bins. Red curve is a Poisson curve with rate = median count rate of data. |
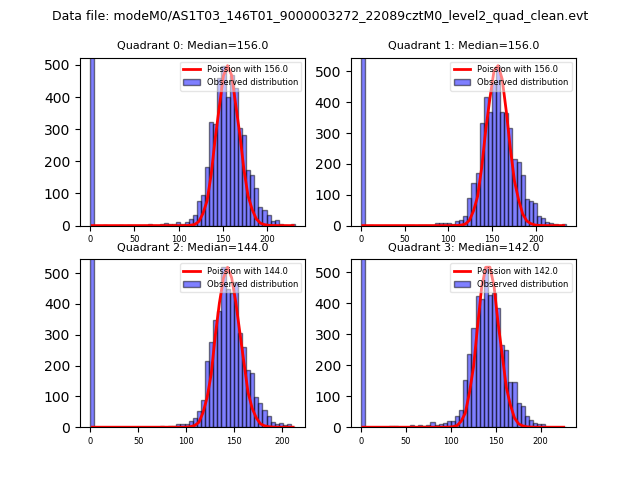 |
 |
| Quadrant-wise count rates Data is divided into 100 sec bins |
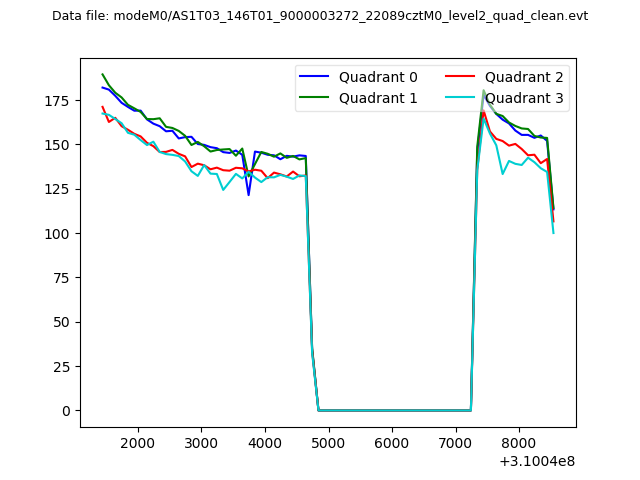 |
|
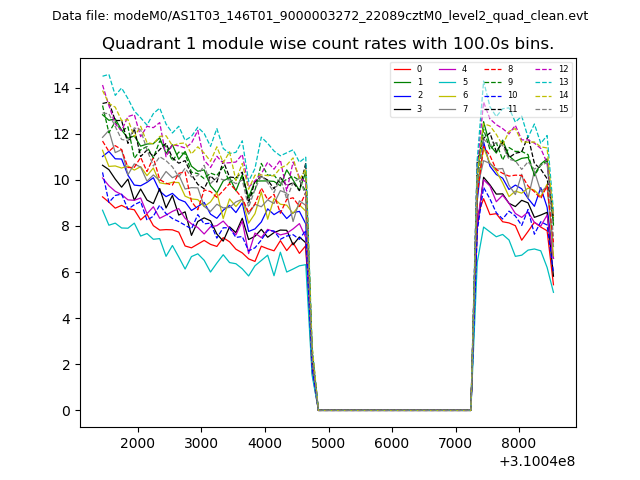
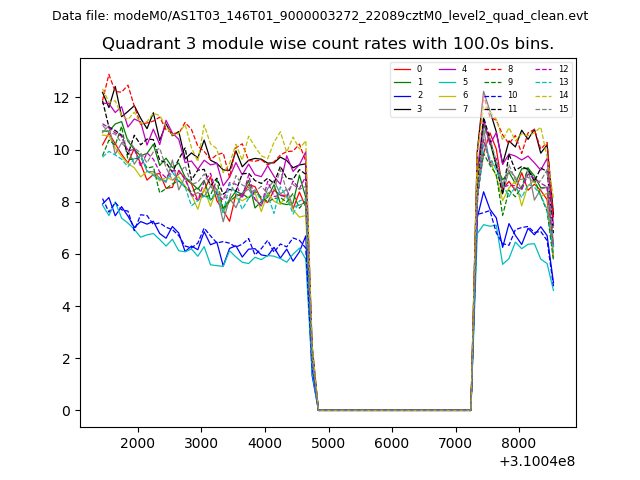
| Module-wise count rates for Quadrant A Data is divided into 100 sec bins |
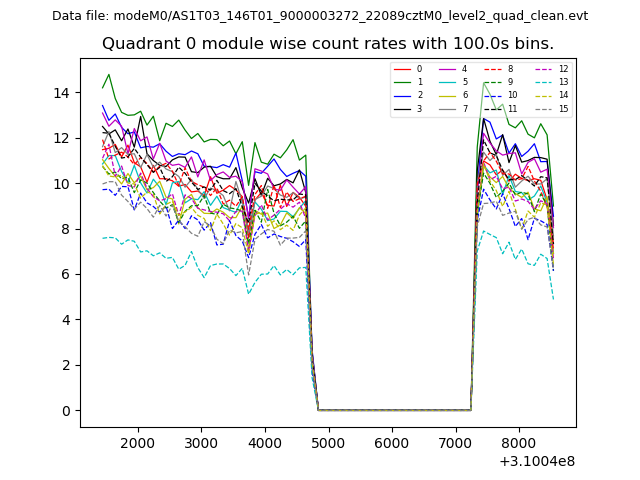 |
 |
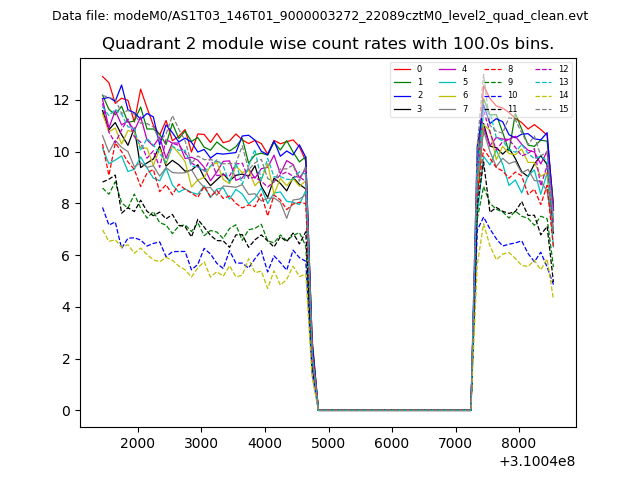
| Module-wise count rates for Quadrant B Data is divided into 100 sec bins |
 |
 |
| Module-wise count rates for Quadrant C Data is divided into 100 sec bins |
 |
 |
| Module-wise count rates for Quadrant D Data is divided into 100 sec bins |
 |
 |
| Parameter | Plot |
|---|---|
| CZT HV Monitor | 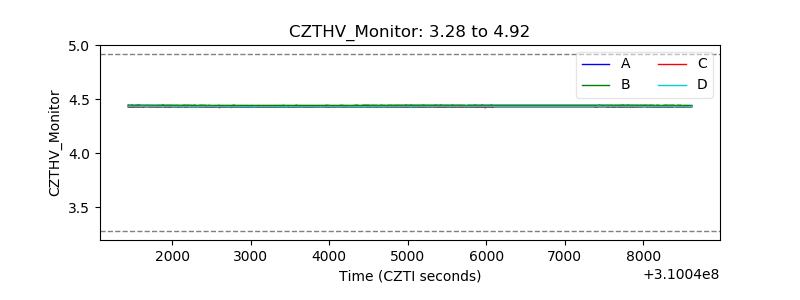 |
| D_VDD | 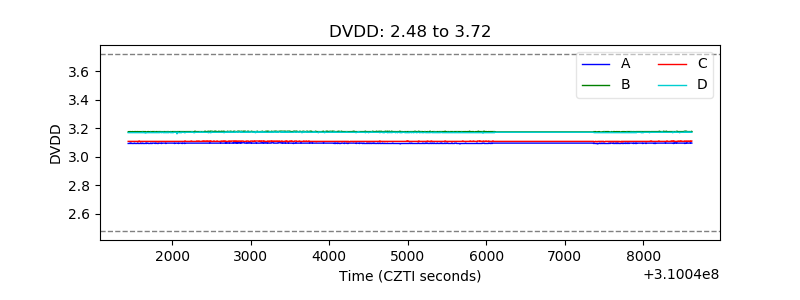 |
| Temperature 1 | 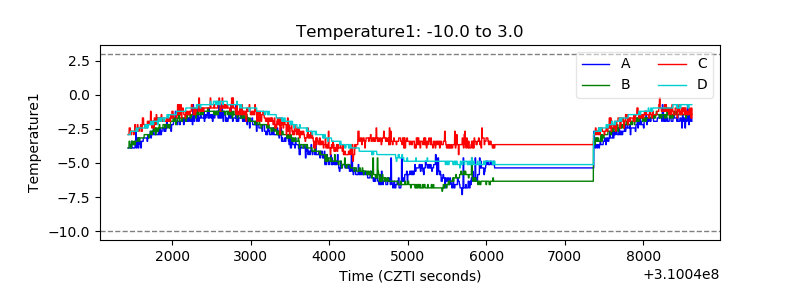 |
| Veto HV Monitor | 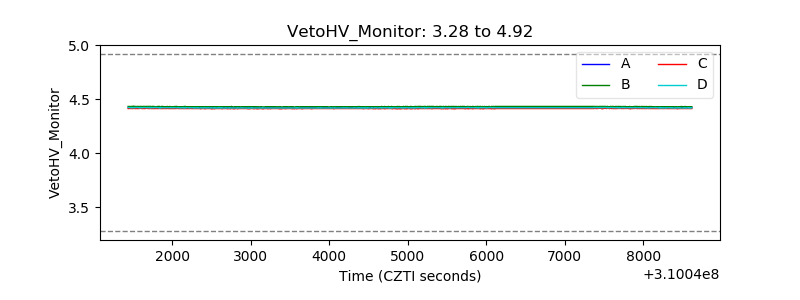 |
| Veto LLD | 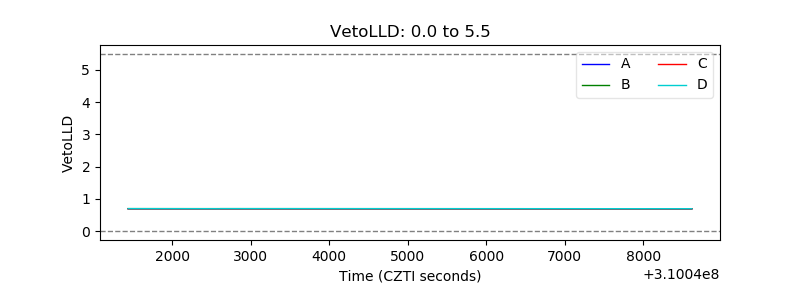 |
| Alpha Counter | 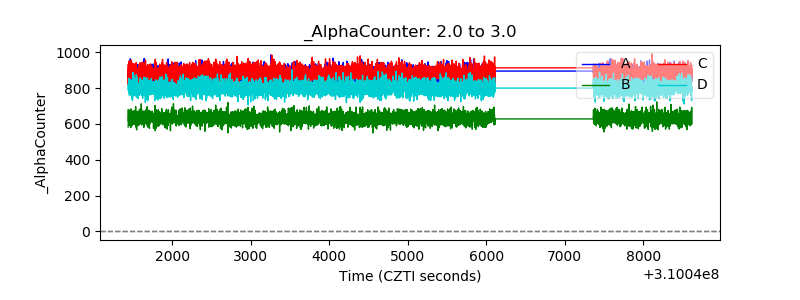 |
| _CPM_Rate | 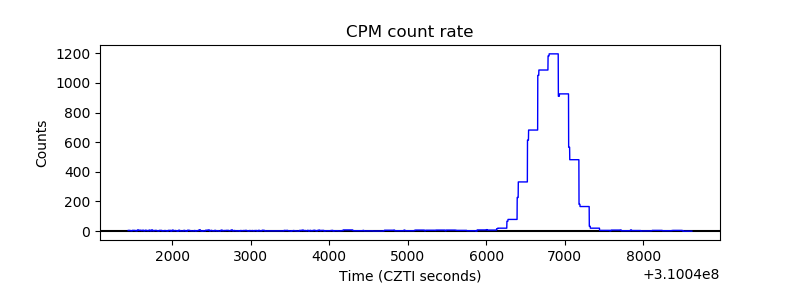 |
| CZT Counter | 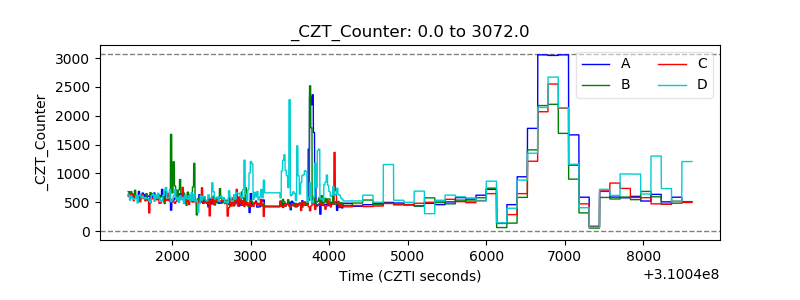 |
| +2.5 Volts monitor | 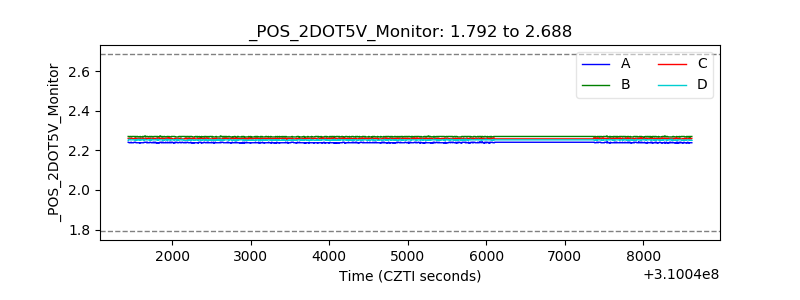 |
| +5 Volts monitor |  |
| _ROLL_ROT | 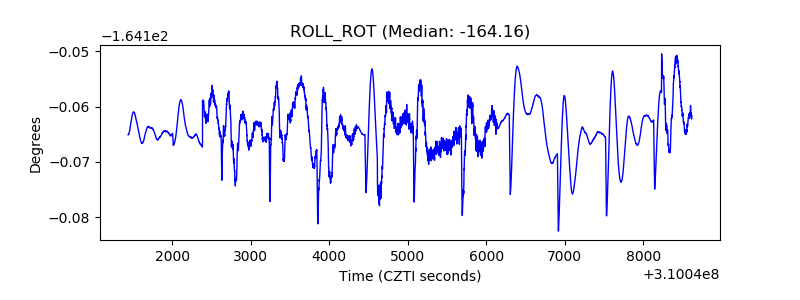 |
| _Roll_DEC | 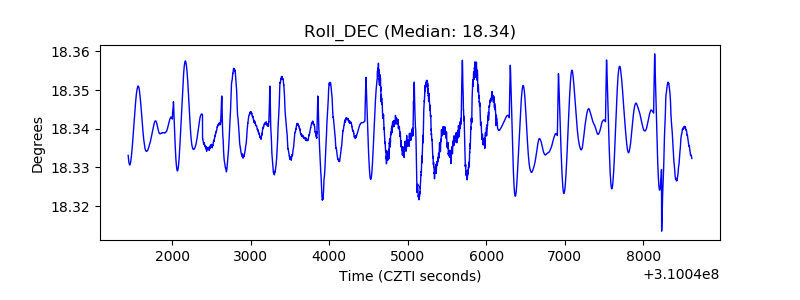 |
| _Roll_RA | 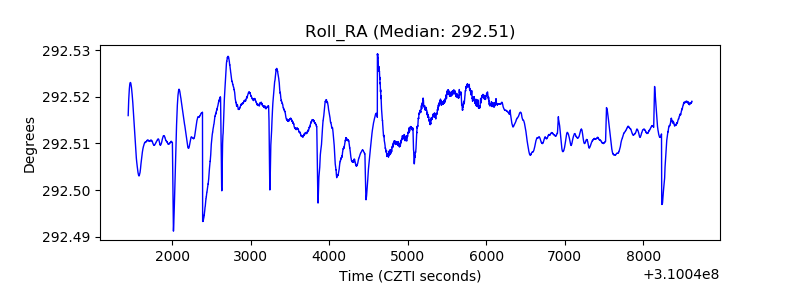 |
| Veto Counter | 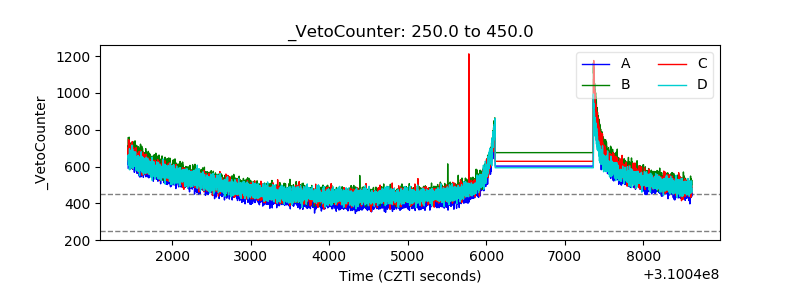 |