| Param | Original file | Final file |
|---|---|---|
| Filename | modeM0/AS1T03_146T01_9000003272_22090cztM0_level2.evt | modeM0/AS1T03_146T01_9000003272_22090cztM0_level2_quad_clean.evt |
| Size (bytes) | 537,200,640 | 100,272,960 |
| Size | 512.3 MB | 95.6 MB |
| Events in quadrant A | 3,299,194 | 671,040 |
| Events in quadrant B | 3,438,879 | 676,023 |
| Events in quadrant C | 3,325,901 | 629,096 |
| Events in quadrant D | 5,762,422 | 604,789 |
| Mode SS | |||
|---|---|---|---|
| Quadrant | BADHDUFLAG | Total packets | Discarded packets |
| A | 0 | 132 | 0 |
| B | 0 | 132 | 0 |
| C | 0 | 132 | 0 |
| D | 0 | 132 | 0 |
| Mode M9 | |||
|---|---|---|---|
| Quadrant | BADHDUFLAG | Total packets | Discarded packets |
| A | 0 | 11 | 0 |
| B | 0 | 11 | 0 |
| C | 0 | 11 | 0 |
| D | 0 | 11 | 0 |
| Mode M0 | |||
|---|---|---|---|
| Quadrant | BADHDUFLAG | Total packets | Discarded packets |
| A | 0 | 13724 | 1 |
| B | 0 | 14209 | 1 |
| C | 0 | 13879 | 1 |
| D | 0 | 21888 | 2 |
| Quadrant | Total seconds | Saturated seconds | Saturation percentage |
|---|---|---|---|
| A | 6537 | 97 | 1.483861% |
| B | 6538 | 113 | 1.728357% |
| C | 6538 | 107 | 1.636586% |
| D | 6537 | 274 | 4.191525% |
Noise dominated data is calculated using 1-second bins in cleaned event files. If a bin has >2000 counts, and if more than 50% of those come from <1% of pixels, then it is considered to be noise-dominated and hence unusable.
| Quadrant | # 1 sec bins | Bins with >0 counts | Bins with >2000 counts | High rate bins dominated by noise | Noise dominated (total time) | Noise dominated (detector-on time) | Marked lightcurve |
|---|---|---|---|---|---|---|---|
| A | 7622 | 6538 | 0 | 0 | 0.00% | 0.00% | 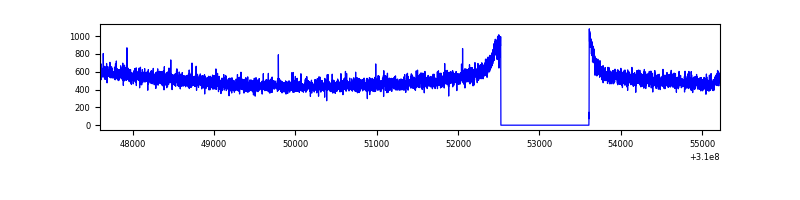 |
| B | 7623 | 6539 | 4 | 4 | 0.05% | 0.06% | 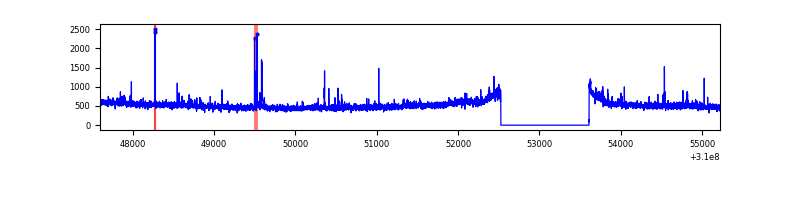 |
| C | 7623 | 6539 | 4 | 4 | 0.05% | 0.06% | 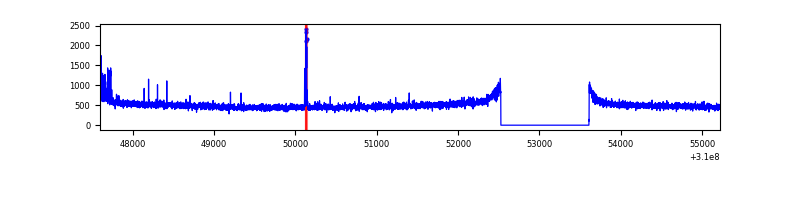 |
| D | 7622 | 6538 | 113 | 113 | 1.48% | 1.73% | 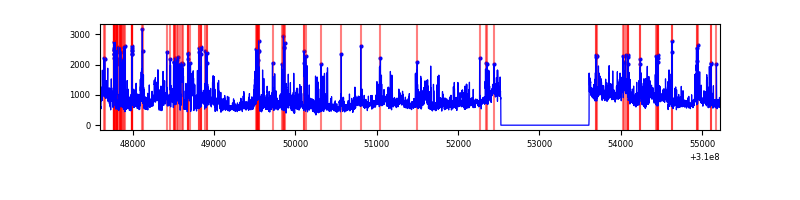 |
Top three noisy pixels from each quadrant. If the there are fewer than three noisy pixels in the level2.evt file, extra rows are filled as -1
| Pixel properties | Quadrant properties | ||||||
|---|---|---|---|---|---|---|---|
| Quadrant | DetID | PixID | Counts | Sigma | Mean | Median | Sigma |
| A | 13 | 254 | 11204 | 60.39 | 854 | 838 | 171.7 |
| A | 0 | 226 | 7389 | 38.16 | 854 | 838 | 171.7 |
| A | 3 | 137 | 6686 | 34.07 | 854 | 838 | 171.7 |
| B | 3 | 64 | 46990 | 287.5 | 846 | 828 | 160.6 |
| B | 0 | 228 | 26045 | 157.05 | 846 | 828 | 160.6 |
| B | 0 | 197 | 24821 | 149.43 | 846 | 828 | 160.6 |
| C | 14 | 238 | 125709 | 665.59 | 801 | 807 | 187.7 |
| C | 10 | 22 | 68496 | 360.71 | 801 | 807 | 187.7 |
| C | 5 | 112 | 6212 | 28.8 | 801 | 807 | 187.7 |
| D | 1 | 52 | 2228829 | 11179.29 | 815 | 793 | 199.3 |
| D | 7 | 238 | 159360 | 795.62 | 815 | 793 | 199.3 |
| D | 2 | 16 | 152964 | 763.53 | 815 | 793 | 199.3 |
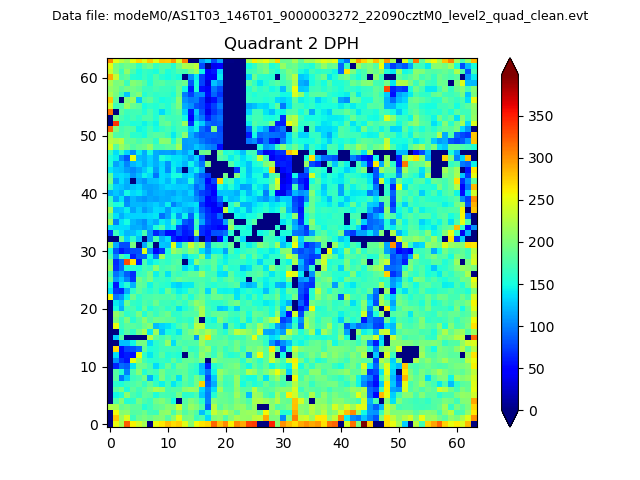
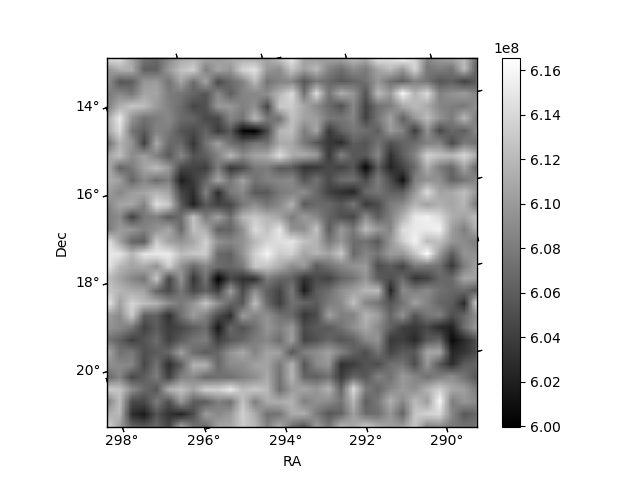
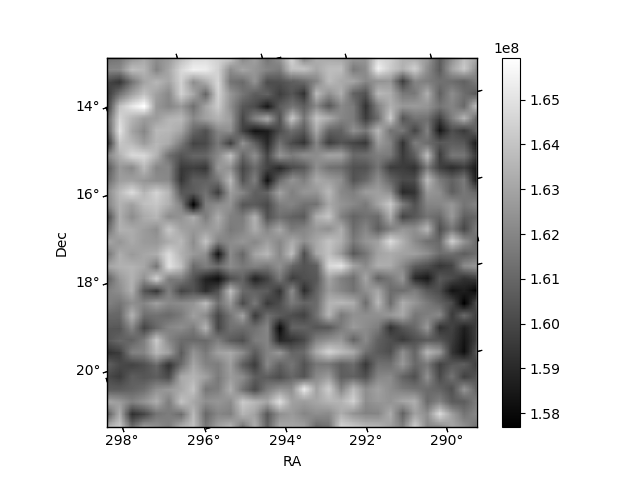
Histogram calculated using DETX and DETY for each event in the final _common_clean file
| Quadrant A | 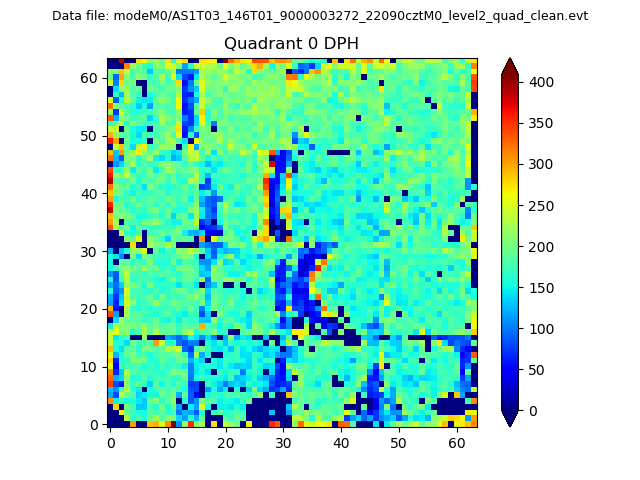 |
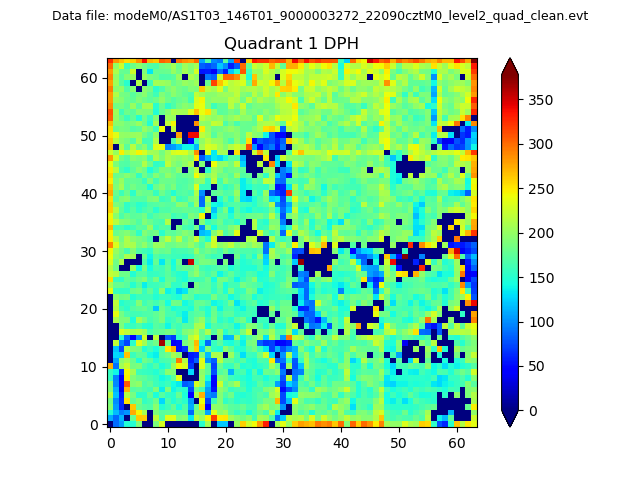 |
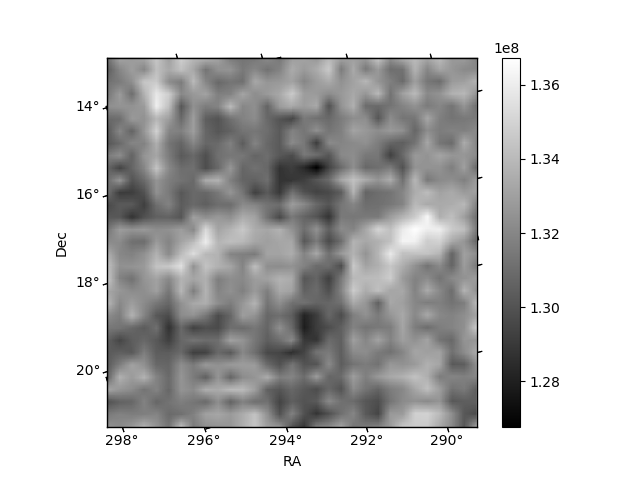
Quadrant B |
|---|---|---|---|
| Quadrant D | 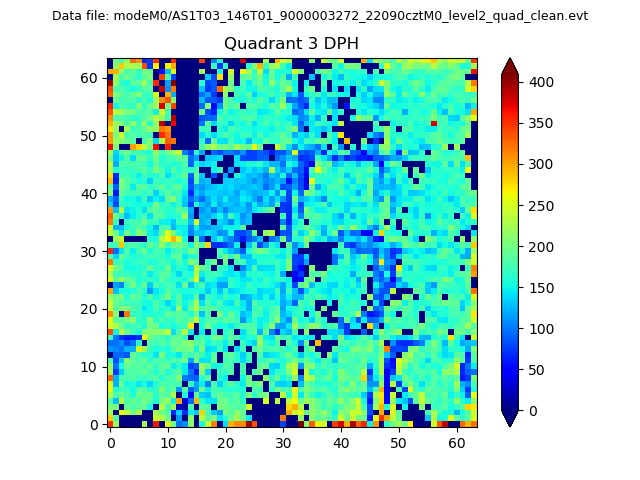 |
 |
Quadrant C |
| Plot type | Count rate plots | Images |
|---|---|---|
| Comparison with Poisson distribution Blue bars denote a histogram of data divided into 1 sec bins. Red curve is a Poisson curve with rate = median count rate of data. |
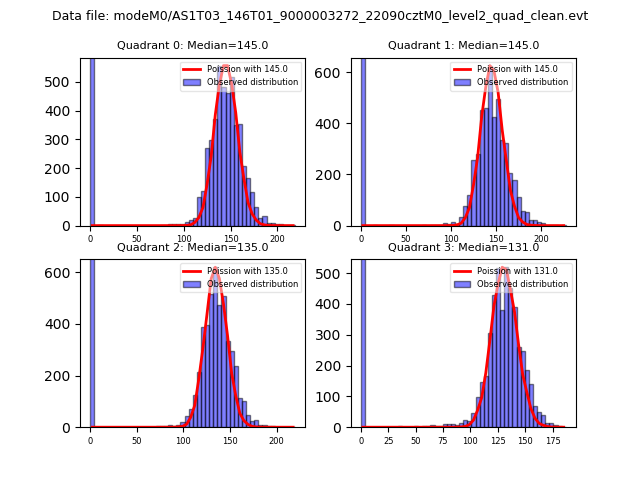 |
 |
| Quadrant-wise count rates Data is divided into 100 sec bins |
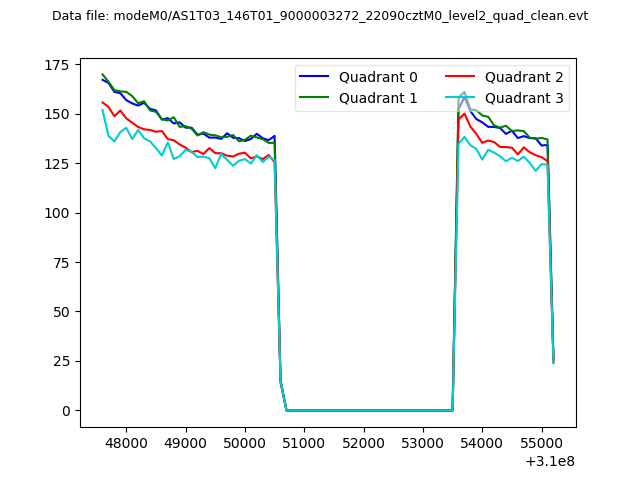 |
|
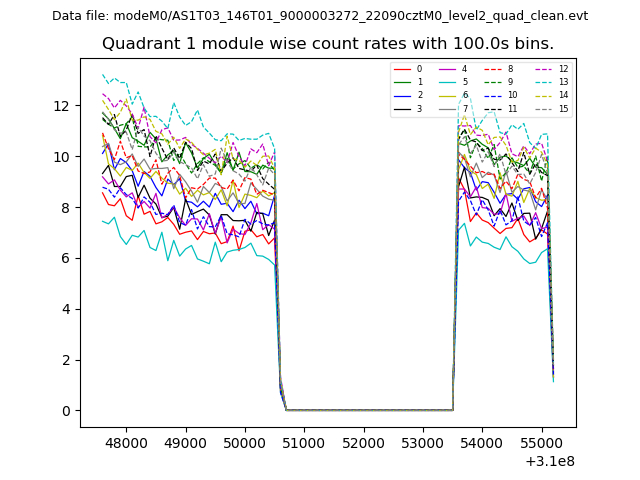
| Module-wise count rates for Quadrant A Data is divided into 100 sec bins |
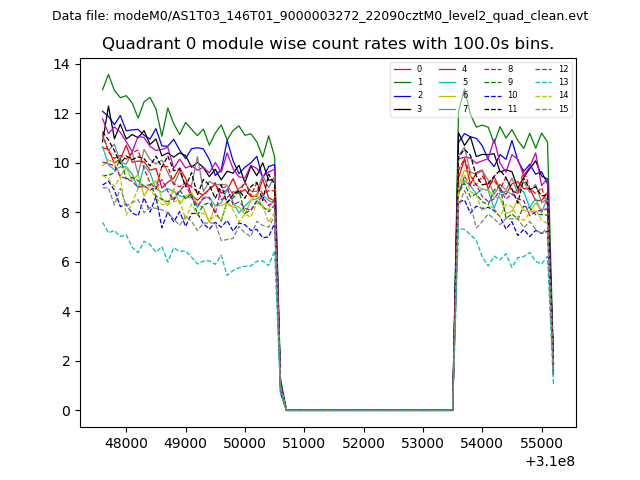 |
 |
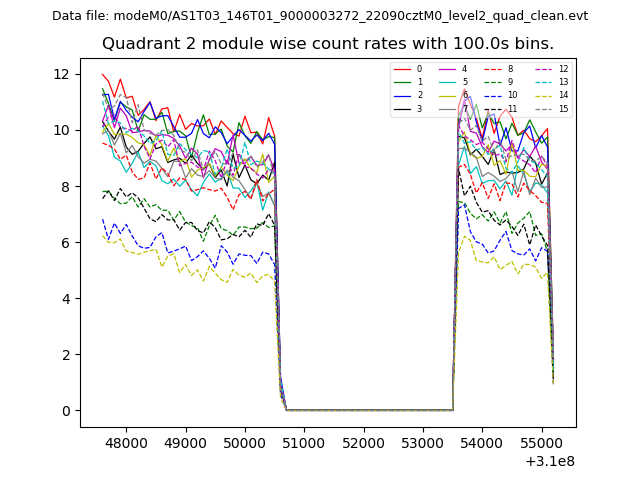
| Module-wise count rates for Quadrant B Data is divided into 100 sec bins |
 |
 |
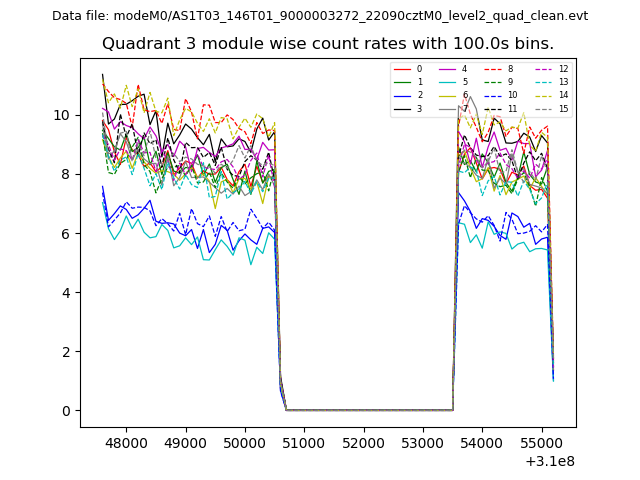
| Module-wise count rates for Quadrant C Data is divided into 100 sec bins |
 |
 |
| Module-wise count rates for Quadrant D Data is divided into 100 sec bins |
 |
 |
| Parameter | Plot |
|---|---|
| CZT HV Monitor | 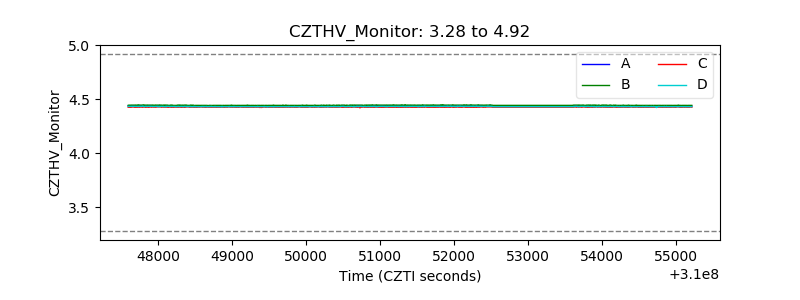 |
| D_VDD | 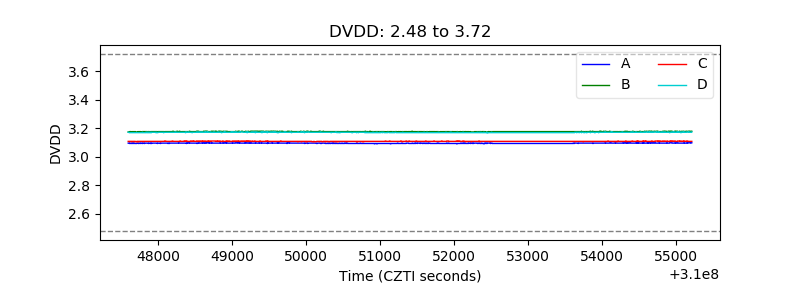 |
| Temperature 1 | 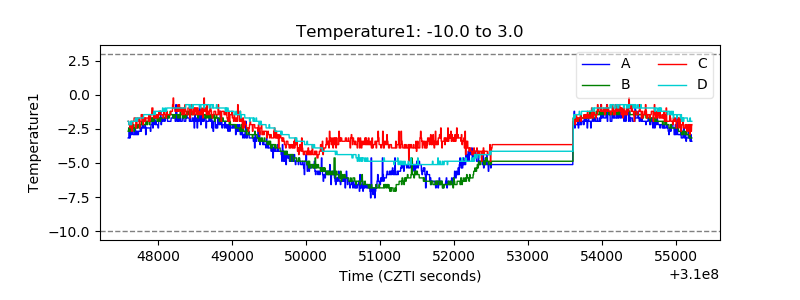 |
| Veto HV Monitor | 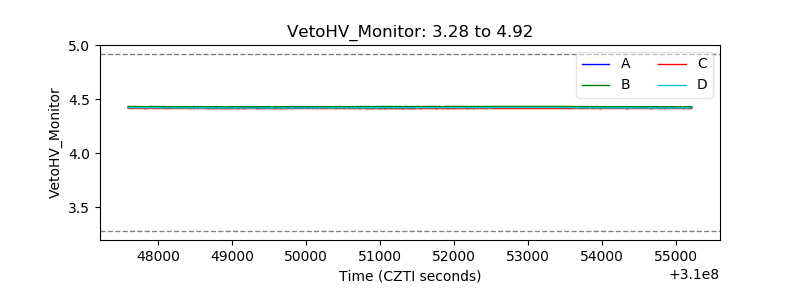 |
| Veto LLD | 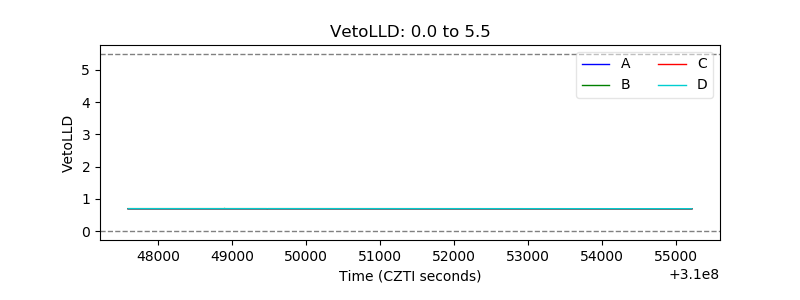 |
| Alpha Counter | 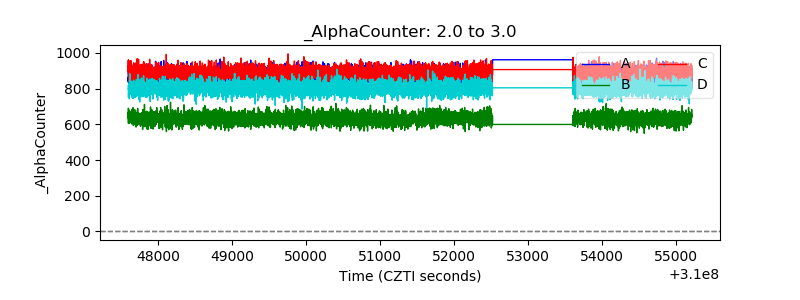 |
| _CPM_Rate | 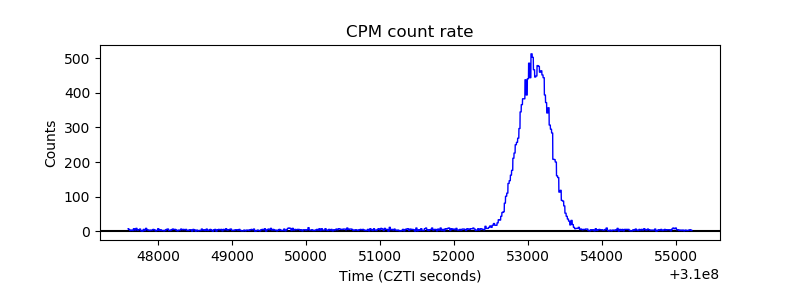 |
| CZT Counter | 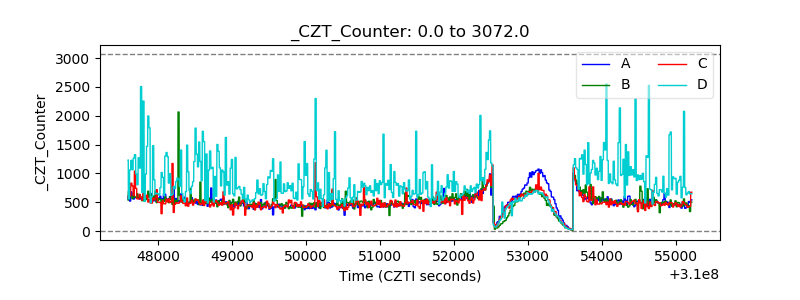 |
| +2.5 Volts monitor |  |
| +5 Volts monitor |  |
| _ROLL_ROT | 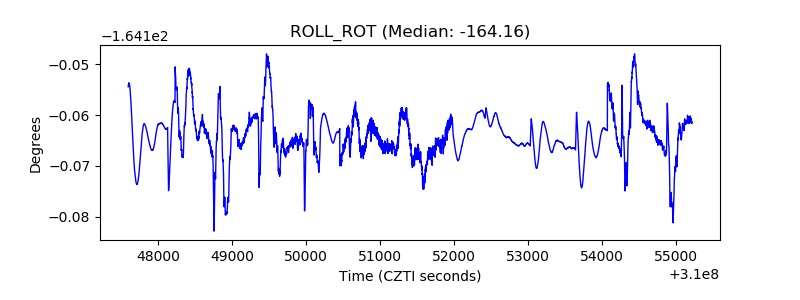 |
| _Roll_DEC | 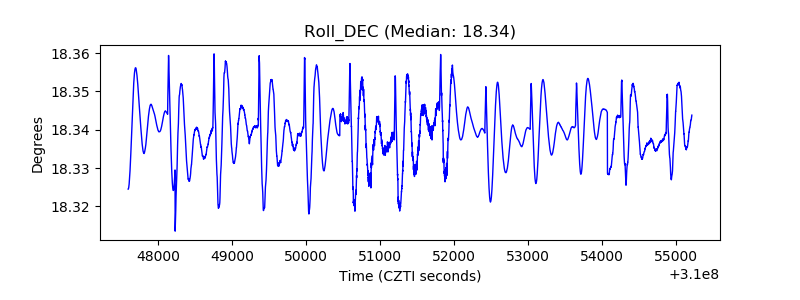 |
| _Roll_RA | 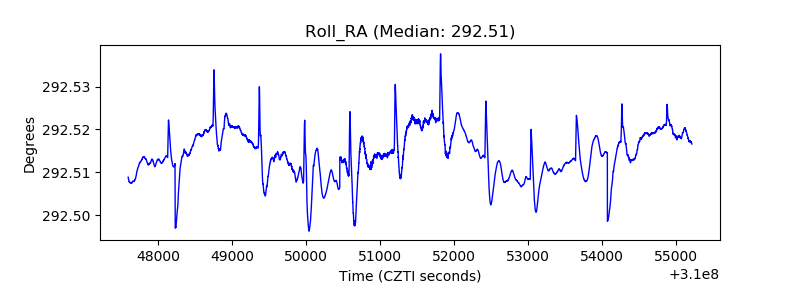 |
| Veto Counter | 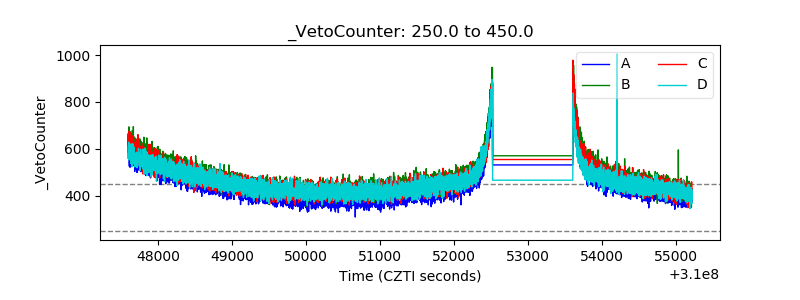 |