| Param | Original file | Final file |
|---|---|---|
| Filename | modeM0/AS1T03_146T01_9000003272_22091cztM0_level2.evt | modeM0/AS1T03_146T01_9000003272_22091cztM0_level2_quad_clean.evt |
| Size (bytes) | 574,381,440 | 98,055,360 |
| Size | 547.8 MB | 93.5 MB |
| Events in quadrant A | 3,450,650 | 640,362 |
| Events in quadrant B | 3,613,882 | 648,961 |
| Events in quadrant C | 3,377,841 | 611,523 |
| Events in quadrant D | 6,481,176 | 583,346 |
| Mode SS | |||
|---|---|---|---|
| Quadrant | BADHDUFLAG | Total packets | Discarded packets |
| A | 0 | 140 | 0 |
| B | 0 | 140 | 0 |
| C | 0 | 140 | 0 |
| D | 0 | 140 | 0 |
| Mode M9 | |||
|---|---|---|---|
| Quadrant | BADHDUFLAG | Total packets | Discarded packets |
| A | 0 | 8 | 0 |
| B | 0 | 8 | 0 |
| C | 0 | 8 | 0 |
| D | 0 | 8 | 0 |
| Mode M0 | |||
|---|---|---|---|
| Quadrant | BADHDUFLAG | Total packets | Discarded packets |
| A | 0 | 14616 | 2 |
| B | 0 | 15016 | 1 |
| C | 0 | 14387 | 1 |
| D | 0 | 24330 | 1 |
| Quadrant | Total seconds | Saturated seconds | Saturation percentage |
|---|---|---|---|
| A | 6968 | 71 | 1.018944% |
| B | 6969 | 78 | 1.119242% |
| C | 6969 | 90 | 1.291433% |
| D | 6969 | 319 | 4.577414% |
Noise dominated data is calculated using 1-second bins in cleaned event files. If a bin has >2000 counts, and if more than 50% of those come from <1% of pixels, then it is considered to be noise-dominated and hence unusable.
| Quadrant | # 1 sec bins | Bins with >0 counts | Bins with >2000 counts | High rate bins dominated by noise | Noise dominated (total time) | Noise dominated (detector-on time) | Marked lightcurve |
|---|---|---|---|---|---|---|---|
| A | 7758 | 6969 | 14 | 14 | 0.18% | 0.20% | 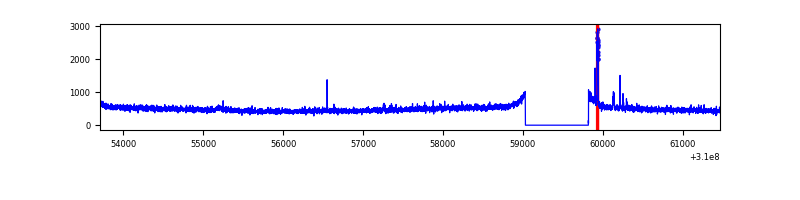 |
| B | 7759 | 6970 | 18 | 18 | 0.23% | 0.26% | 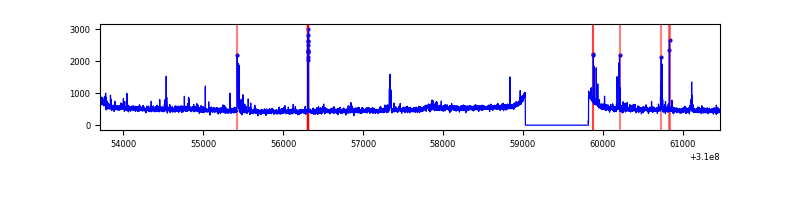 |
| C | 7759 | 6970 | 1 | 1 | 0.01% | 0.01% |  |
| D | 7759 | 6970 | 231 | 231 | 2.98% | 3.31% | 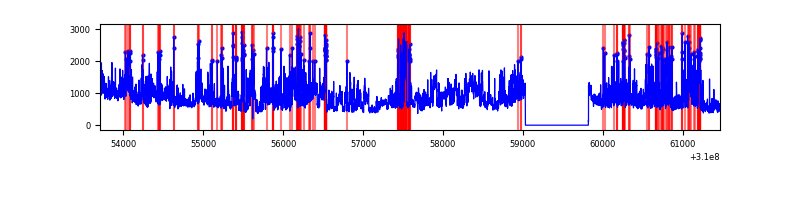 |
Top three noisy pixels from each quadrant. If the there are fewer than three noisy pixels in the level2.evt file, extra rows are filled as -1
| Pixel properties | Quadrant properties | ||||||
|---|---|---|---|---|---|---|---|
| Quadrant | DetID | PixID | Counts | Sigma | Mean | Median | Sigma |
| A | 15 | 174 | 52041 | 289.44 | 875 | 858 | 176.8 |
| A | 14 | 111 | 12875 | 67.95 | 875 | 858 | 176.8 |
| A | 13 | 254 | 11993 | 62.97 | 875 | 858 | 176.8 |
| B | 3 | 64 | 52735 | 310.84 | 872 | 851 | 166.9 |
| B | 0 | 228 | 46377 | 272.75 | 872 | 851 | 166.9 |
| B | 0 | 190 | 27371 | 158.88 | 872 | 851 | 166.9 |
| C | 14 | 238 | 130797 | 668.11 | 829 | 837 | 194.5 |
| C | 10 | 22 | 8544 | 39.62 | 829 | 837 | 194.5 |
| C | 13 | 61 | 5903 | 26.04 | 829 | 837 | 194.5 |
| D | 1 | 52 | 2940222 | 14262.89 | 838 | 813 | 206.1 |
| D | 7 | 238 | 139171 | 671.35 | 838 | 813 | 206.1 |
| D | 2 | 16 | 86971 | 418.06 | 838 | 813 | 206.1 |
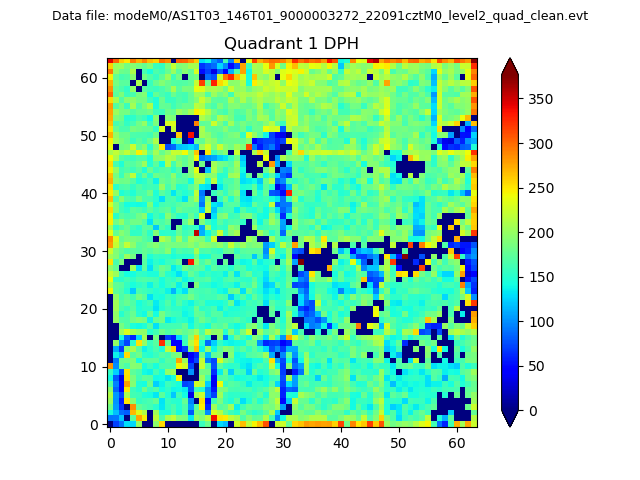
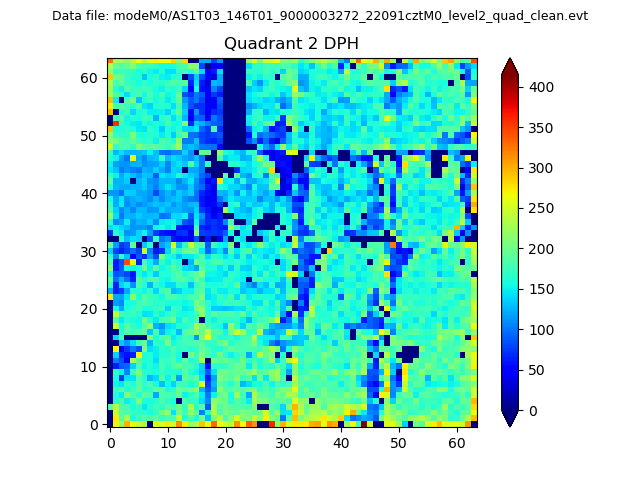
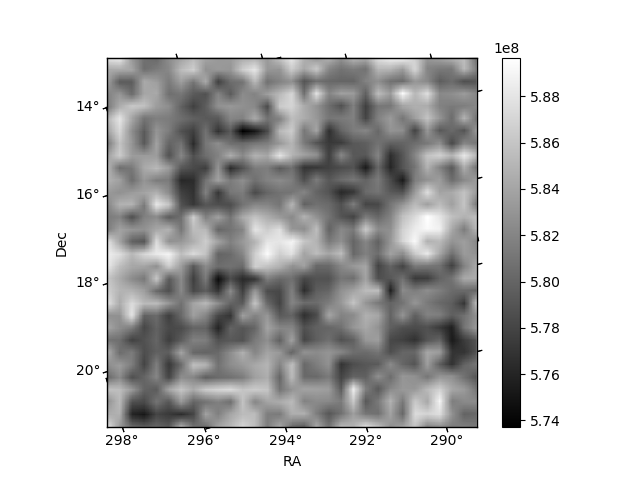
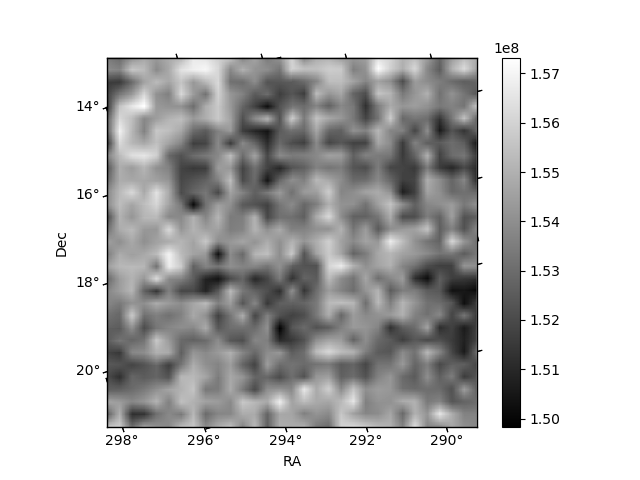
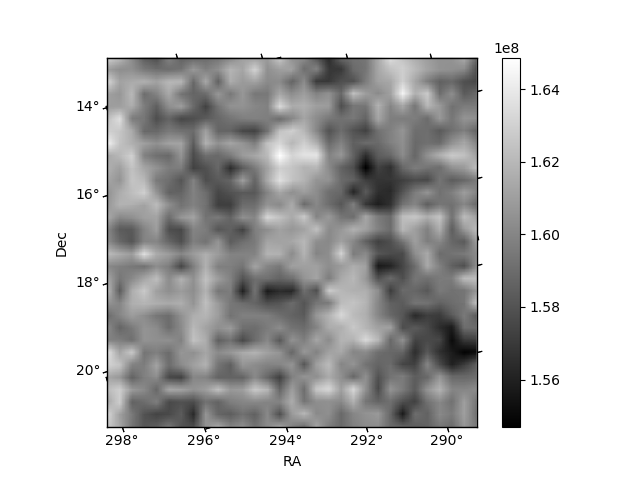
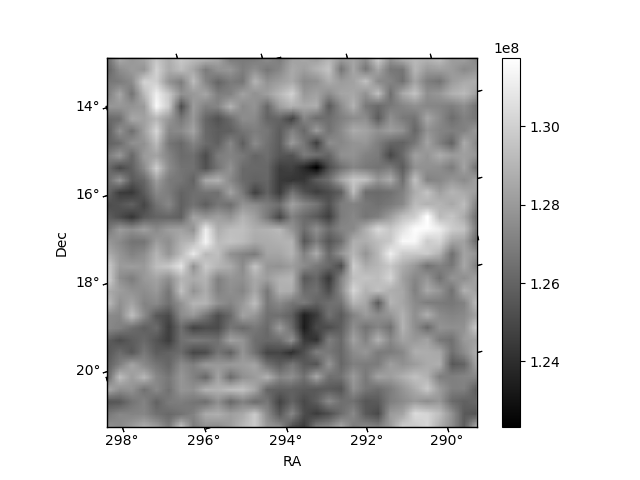
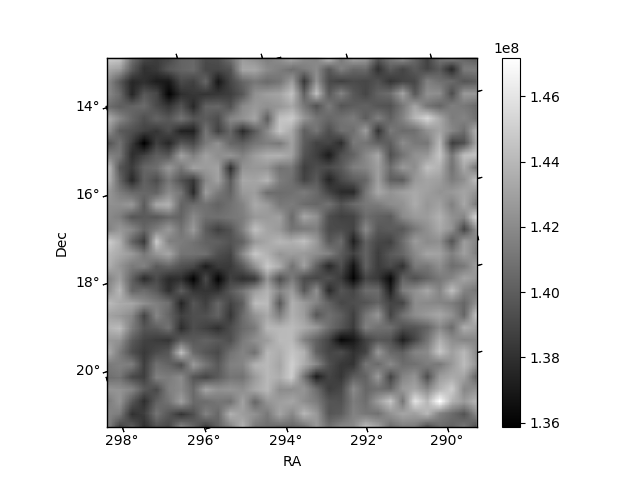
Histogram calculated using DETX and DETY for each event in the final _common_clean file
| Quadrant A | 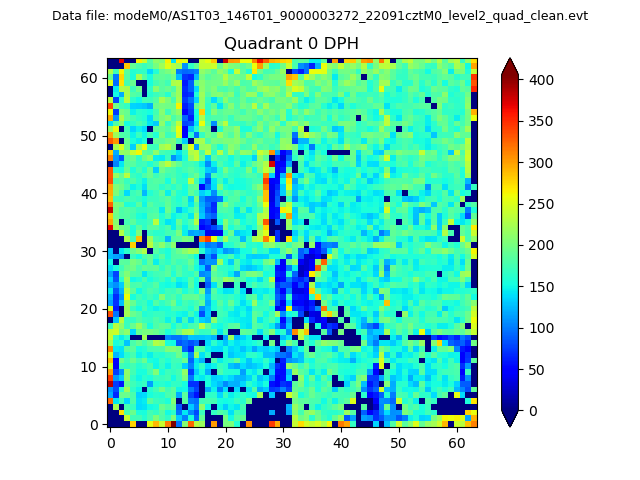 |
 |
Quadrant B |
|---|---|---|---|
| Quadrant D | 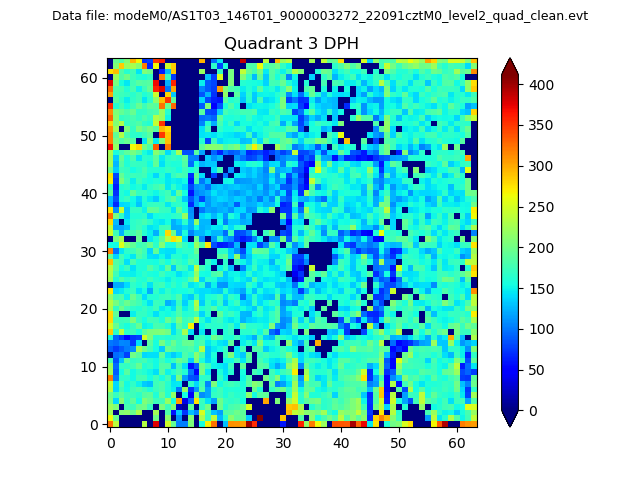 |
 |
Quadrant C |
| Plot type | Count rate plots | Images |
|---|---|---|
| Comparison with Poisson distribution Blue bars denote a histogram of data divided into 1 sec bins. Red curve is a Poisson curve with rate = median count rate of data. |
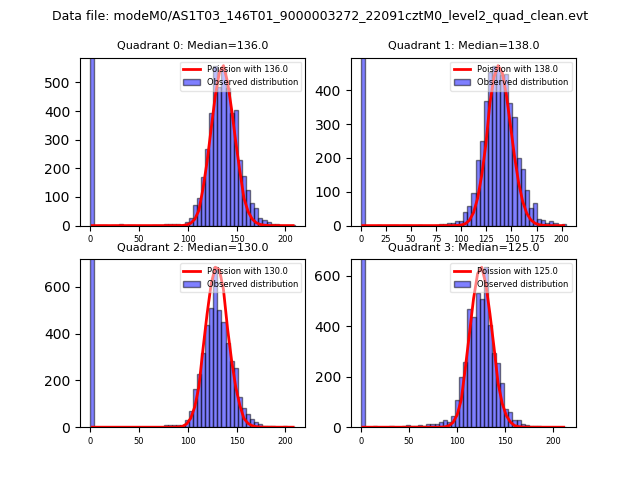 |
 |
| Quadrant-wise count rates Data is divided into 100 sec bins |
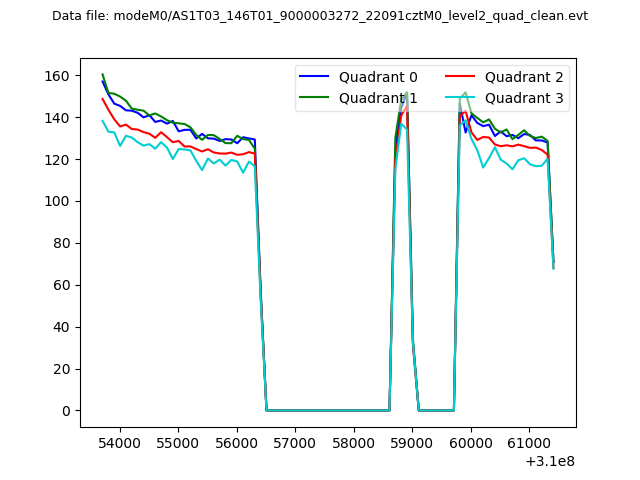 |
|
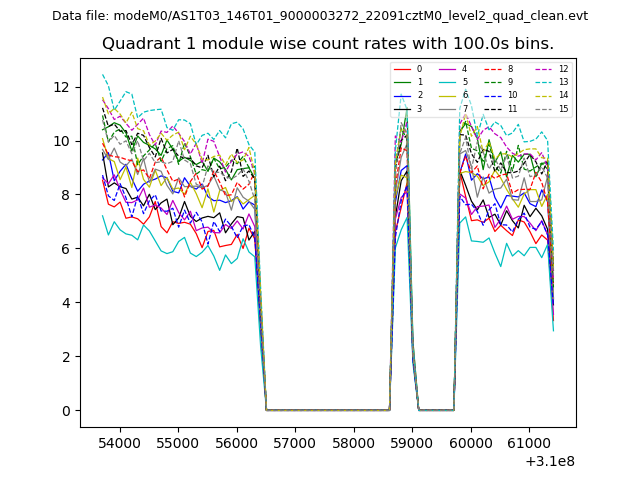
| Module-wise count rates for Quadrant A Data is divided into 100 sec bins |
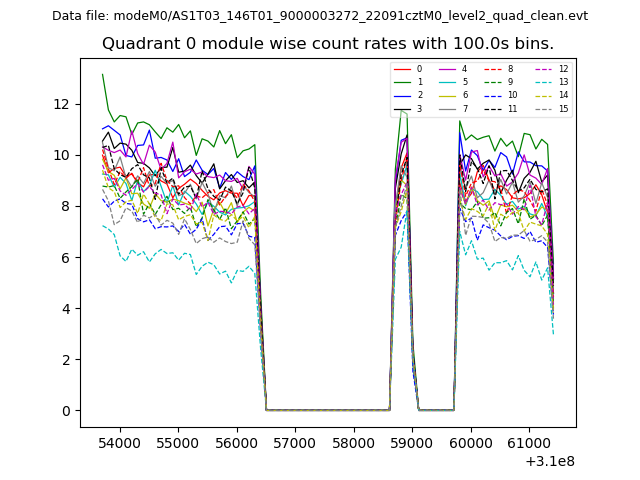 |
 |
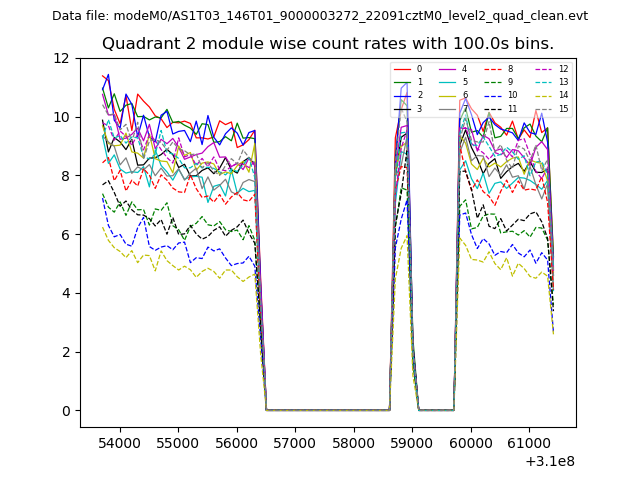
| Module-wise count rates for Quadrant B Data is divided into 100 sec bins |
 |
 |
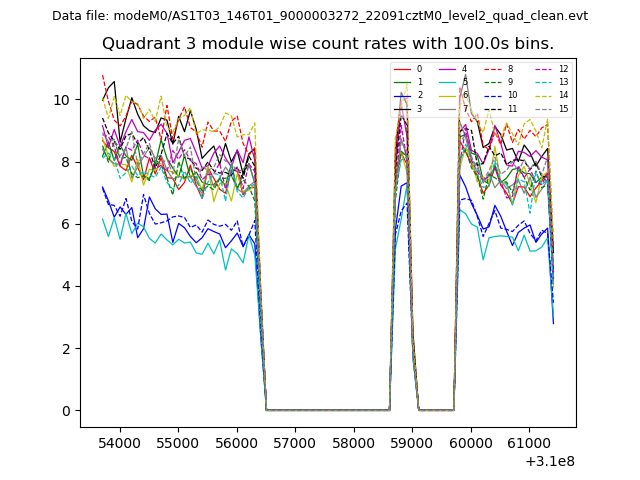
| Module-wise count rates for Quadrant C Data is divided into 100 sec bins |
 |
 |
| Module-wise count rates for Quadrant D Data is divided into 100 sec bins |
 |
 |
| Parameter | Plot |
|---|---|
| CZT HV Monitor | 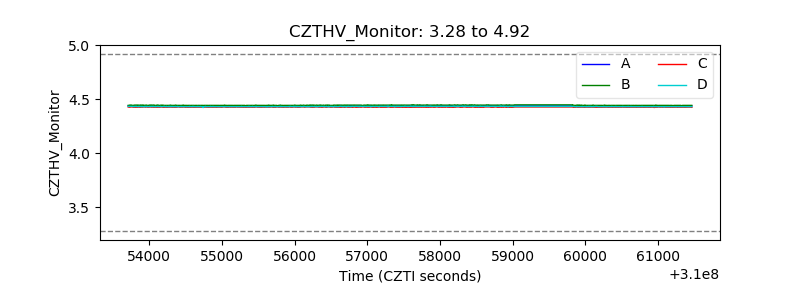 |
| D_VDD | 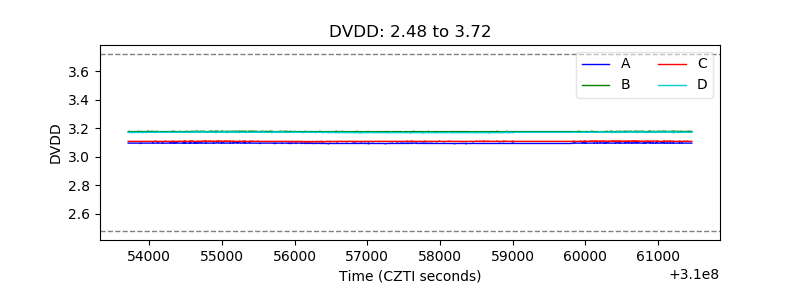 |
| Temperature 1 | 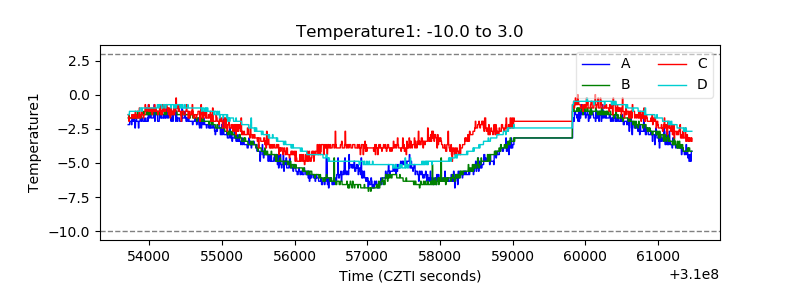 |
| Veto HV Monitor | 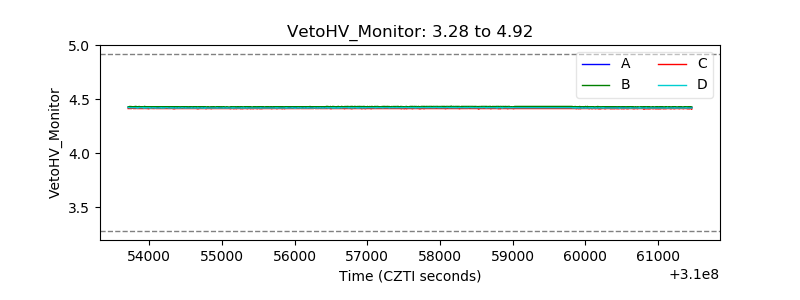 |
| Veto LLD | 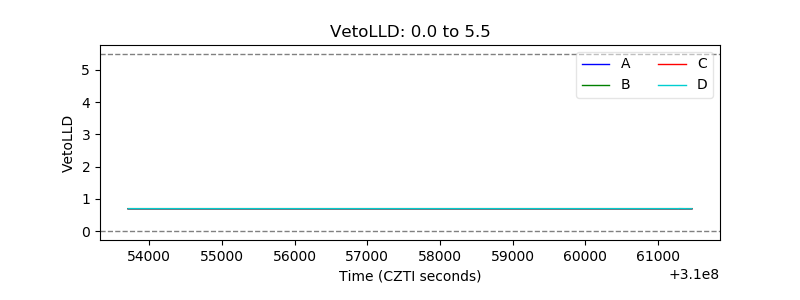 |
| Alpha Counter | 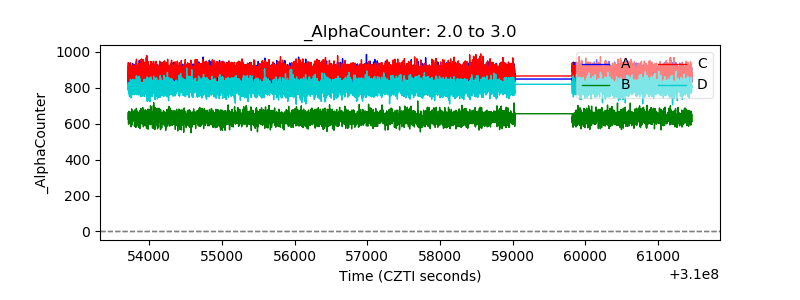 |
| _CPM_Rate | 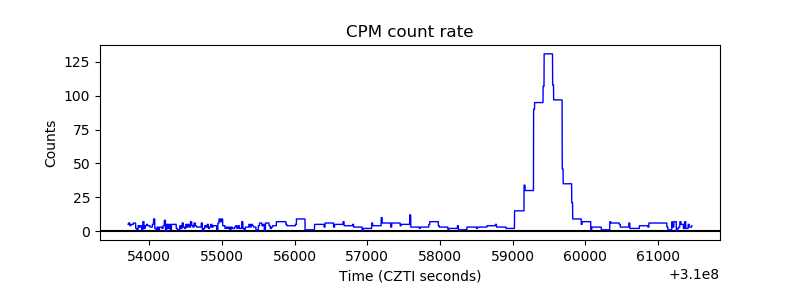 |
| CZT Counter | 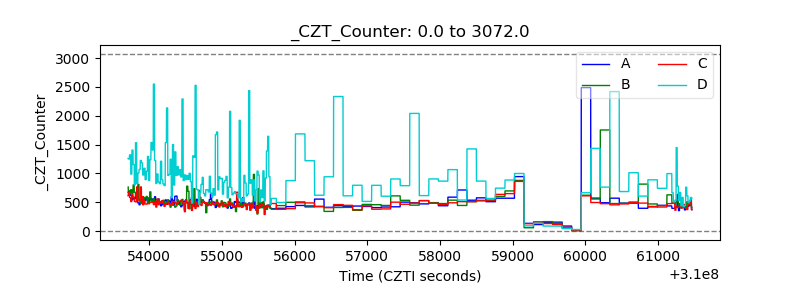 |
| +2.5 Volts monitor |  |
| +5 Volts monitor | 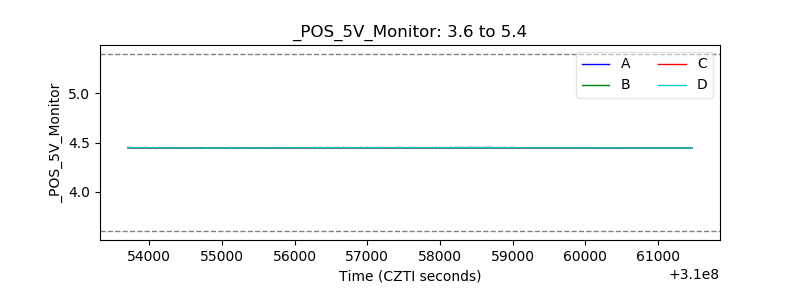 |
| _ROLL_ROT | 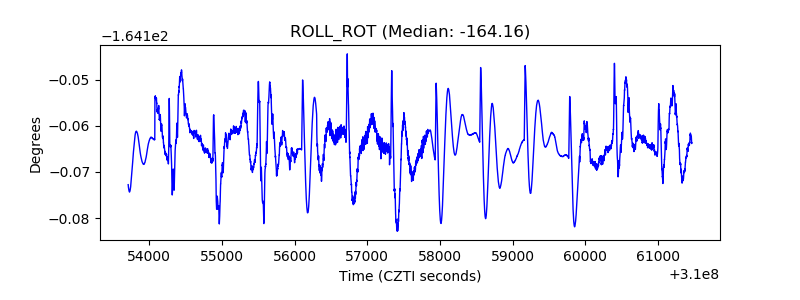 |
| _Roll_DEC | 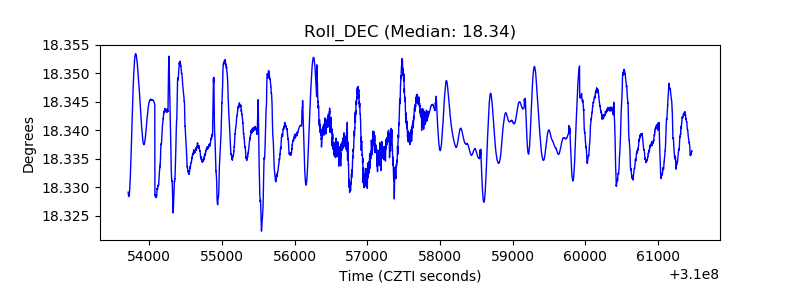 |
| _Roll_RA | 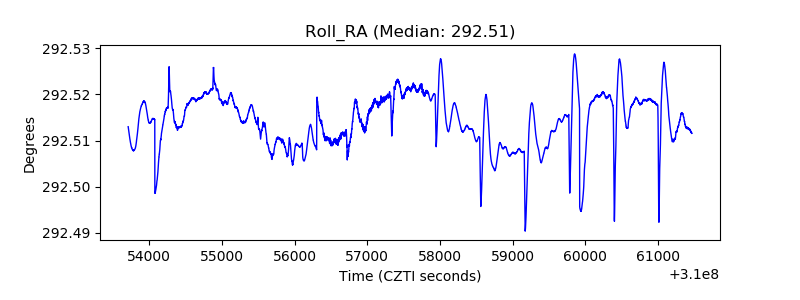 |
| Veto Counter | 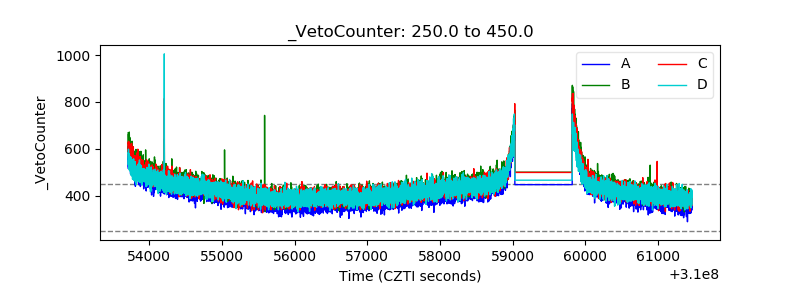 |