| Param | Original file | Final file |
|---|---|---|
| Filename | modeM0/AS1T03_146T01_9000003272_22093cztM0_level2.evt | modeM0/AS1T03_146T01_9000003272_22093cztM0_level2_quad_clean.evt |
| Size (bytes) | 573,808,320 | 94,795,200 |
| Size | 547.2 MB | 90.4 MB |
| Events in quadrant A | 3,395,617 | 620,365 |
| Events in quadrant B | 3,908,186 | 621,605 |
| Events in quadrant C | 3,339,956 | 595,731 |
| Events in quadrant D | 6,265,625 | 551,138 |
| Mode SS | |||
|---|---|---|---|
| Quadrant | BADHDUFLAG | Total packets | Discarded packets |
| A | 0 | 140 | 0 |
| B | 0 | 140 | 0 |
| C | 0 | 140 | 0 |
| D | 0 | 140 | 0 |
| Mode M9 | |||
|---|---|---|---|
| Quadrant | BADHDUFLAG | Total packets | Discarded packets |
| A | 0 | 5 | 0 |
| B | 0 | 6 | 0 |
| C | 0 | 6 | 0 |
| D | 0 | 6 | 0 |
| Mode M0 | |||
|---|---|---|---|
| Quadrant | BADHDUFLAG | Total packets | Discarded packets |
| A | 0 | 14550 | 2 |
| B | 0 | 16035 | 2 |
| C | 0 | 14329 | 2 |
| D | 0 | 23481 | 2 |
| Quadrant | Total seconds | Saturated seconds | Saturation percentage |
|---|---|---|---|
| A | 6914 | 66 | 0.954585% |
| B | 6914 | 195 | 2.820364% |
| C | 6914 | 74 | 1.070292% |
| D | 6914 | 528 | 7.636679% |
Noise dominated data is calculated using 1-second bins in cleaned event files. If a bin has >2000 counts, and if more than 50% of those come from <1% of pixels, then it is considered to be noise-dominated and hence unusable.
| Quadrant | # 1 sec bins | Bins with >0 counts | Bins with >2000 counts | High rate bins dominated by noise | Noise dominated (total time) | Noise dominated (detector-on time) | Marked lightcurve |
|---|---|---|---|---|---|---|---|
| A | 7364 | 6915 | 14 | 14 | 0.19% | 0.20% |  |
| B | 7364 | 6915 | 96 | 96 | 1.30% | 1.39% |  |
| C | 7364 | 6915 | 0 | 0 | 0.00% | 0.00% | 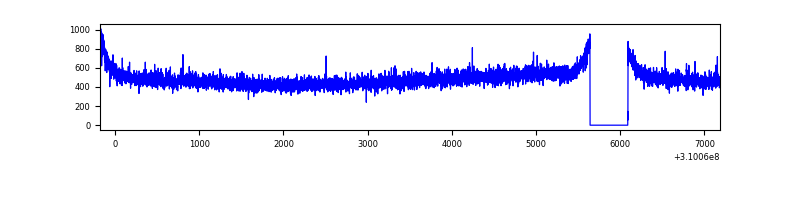 |
| D | 7364 | 6915 | 414 | 414 | 5.62% | 5.99% | 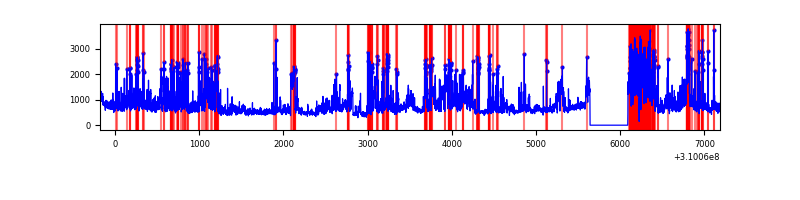 |
Top three noisy pixels from each quadrant. If the there are fewer than three noisy pixels in the level2.evt file, extra rows are filled as -1
| Pixel properties | Quadrant properties | ||||||
|---|---|---|---|---|---|---|---|
| Quadrant | DetID | PixID | Counts | Sigma | Mean | Median | Sigma |
| A | 15 | 174 | 45419 | 254.23 | 864 | 847 | 175.3 |
| A | 13 | 254 | 12361 | 65.67 | 864 | 847 | 175.3 |
| A | 14 | 111 | 10467 | 54.87 | 864 | 847 | 175.3 |
| B | 3 | 64 | 404030 | 2446.81 | 857 | 836 | 164.8 |
| B | 0 | 190 | 76679 | 460.26 | 857 | 836 | 164.8 |
| B | 0 | 230 | 20755 | 120.88 | 857 | 836 | 164.8 |
| C | 14 | 238 | 128088 | 659.08 | 821 | 827 | 193.1 |
| C | 13 | 61 | 5940 | 26.48 | 821 | 827 | 193.1 |
| C | 0 | 239 | 4430 | 18.66 | 821 | 827 | 193.1 |
| D | 1 | 52 | 2735169 | 13894.9 | 806 | 782 | 196.8 |
| D | 2 | 16 | 122000 | 615.97 | 806 | 782 | 196.8 |
| D | 7 | 238 | 93035 | 468.79 | 806 | 782 | 196.8 |
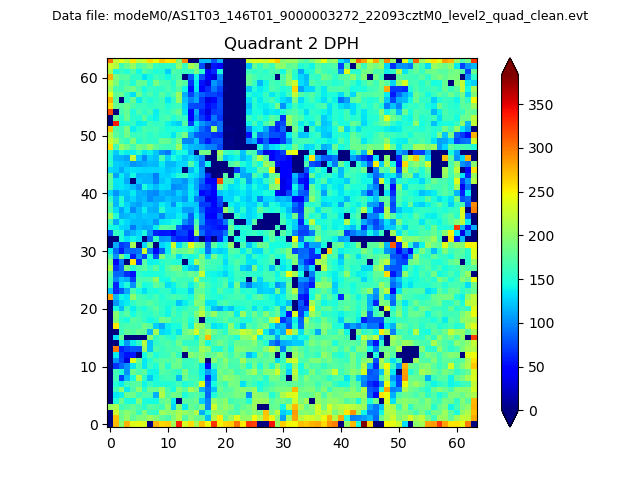
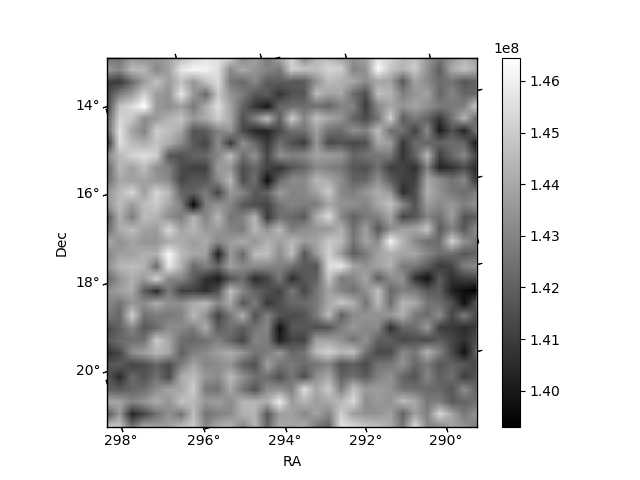
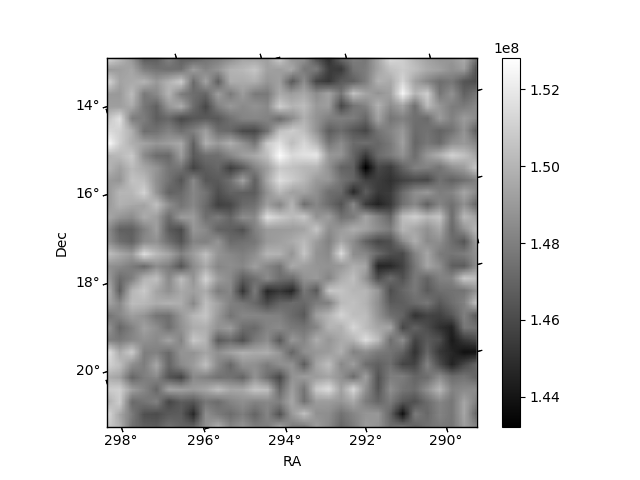
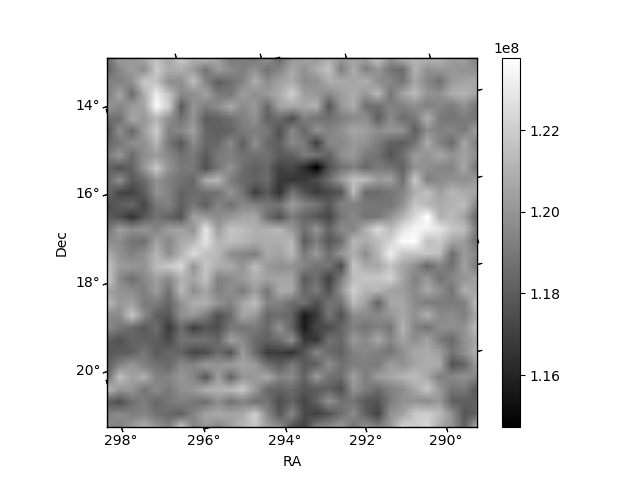
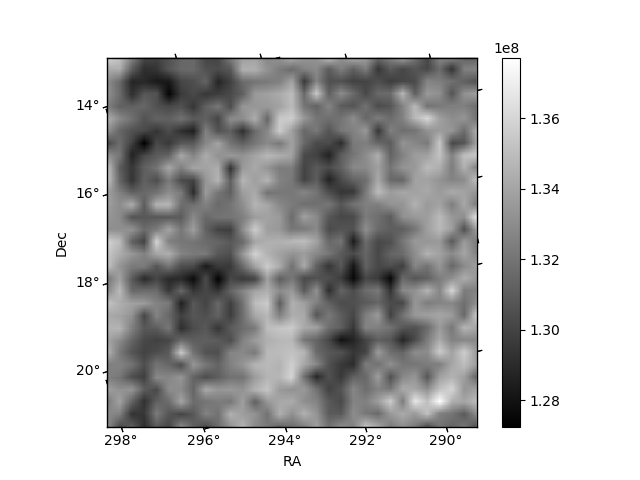
Histogram calculated using DETX and DETY for each event in the final _common_clean file
| Quadrant A | 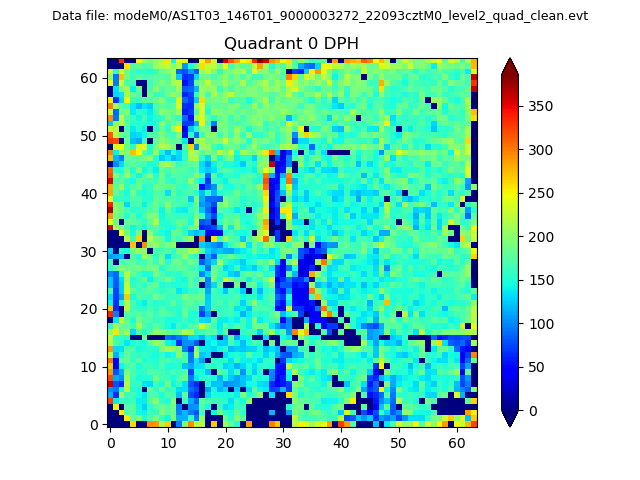 |
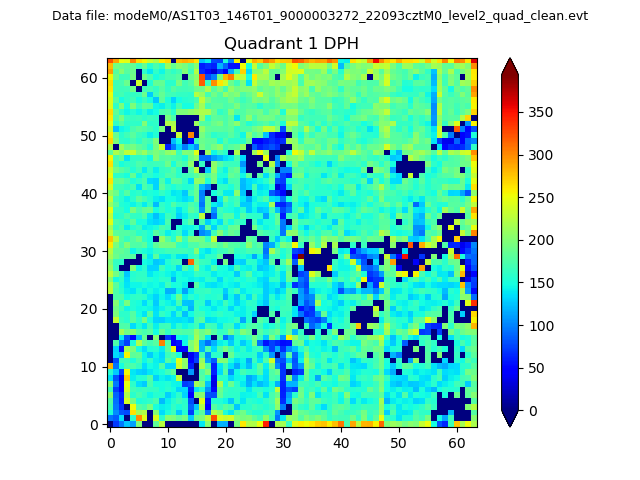 |
Quadrant B |
|---|---|---|---|
| Quadrant D | 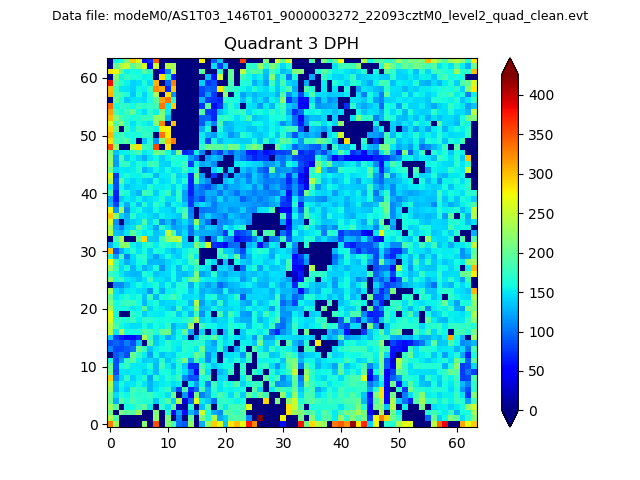 |
 |
Quadrant C |
| Plot type | Count rate plots | Images |
|---|---|---|
| Comparison with Poisson distribution Blue bars denote a histogram of data divided into 1 sec bins. Red curve is a Poisson curve with rate = median count rate of data. |
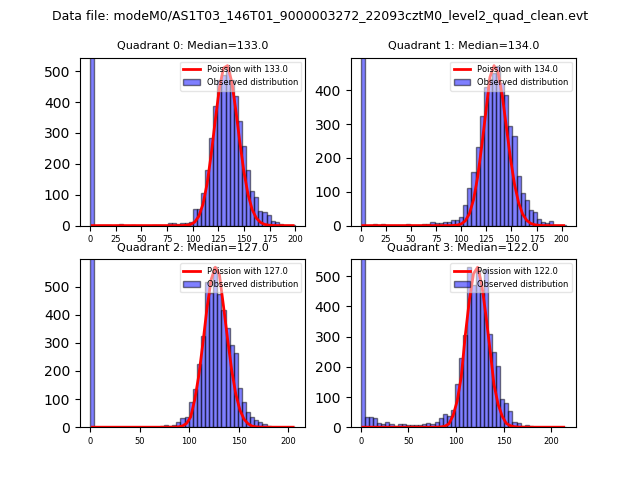 |
 |
| Quadrant-wise count rates Data is divided into 100 sec bins |
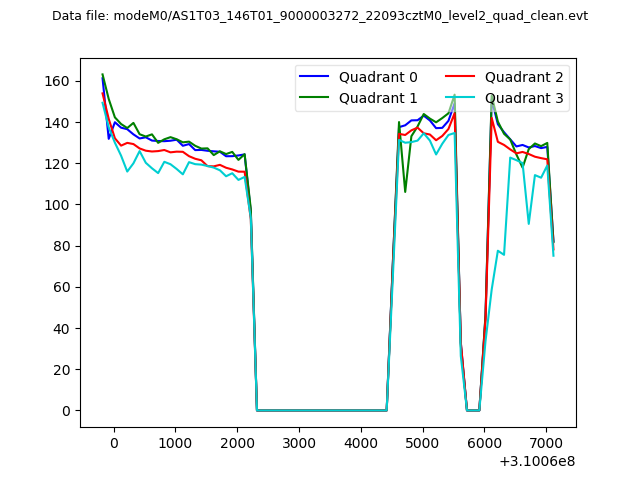 |
|
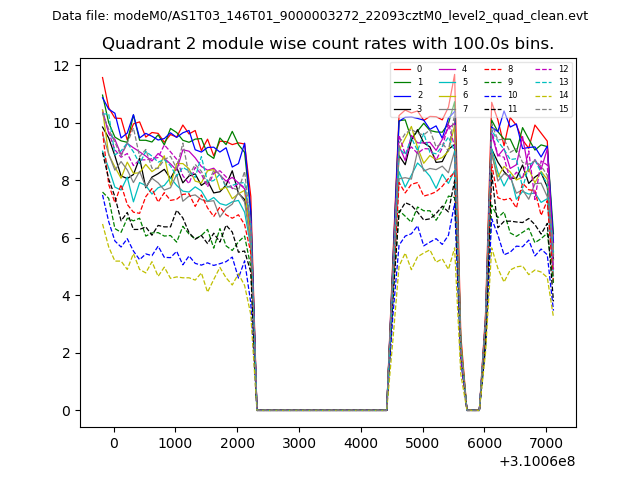
| Module-wise count rates for Quadrant A Data is divided into 100 sec bins |
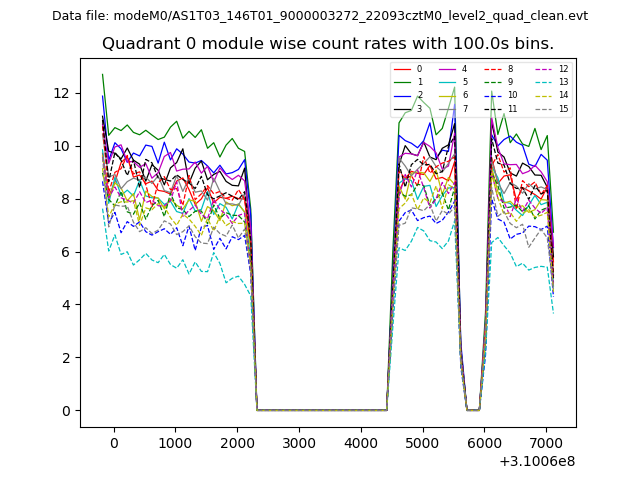 |
 |
| Module-wise count rates for Quadrant B Data is divided into 100 sec bins |
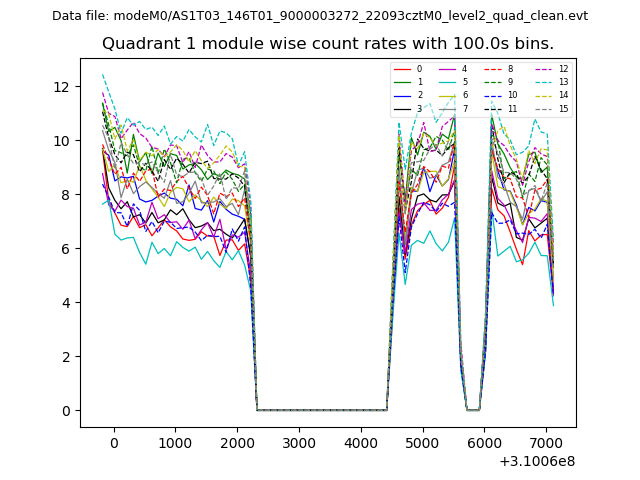 |
 |
| Module-wise count rates for Quadrant C Data is divided into 100 sec bins |
 |
 |
| Module-wise count rates for Quadrant D Data is divided into 100 sec bins |
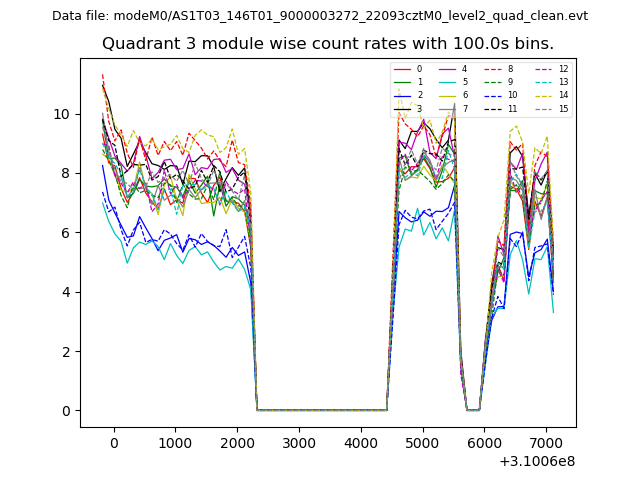 |
 |
| Parameter | Plot |
|---|---|
| CZT HV Monitor | 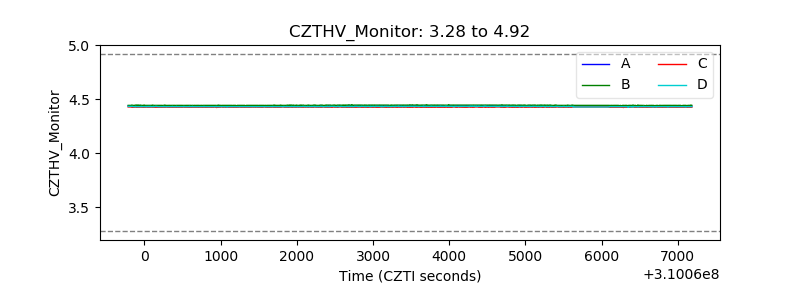 |
| D_VDD | 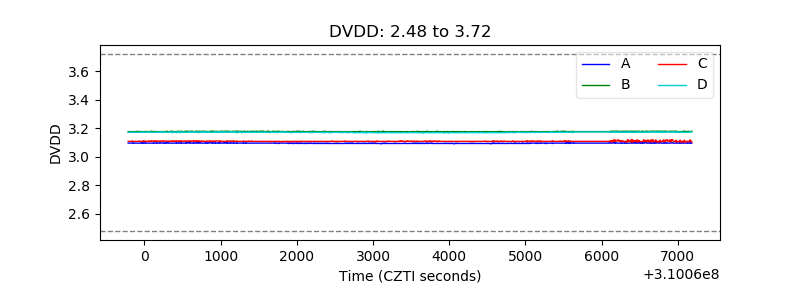 |
| Temperature 1 | 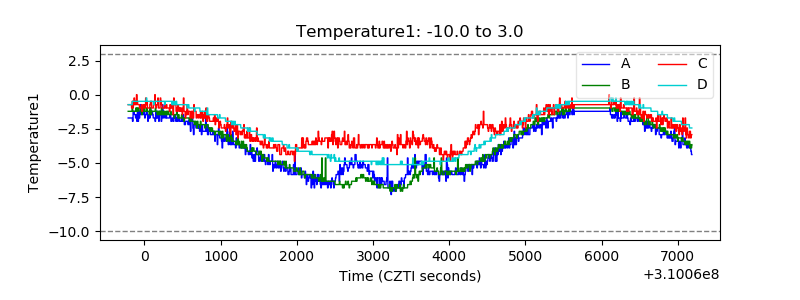 |
| Veto HV Monitor | 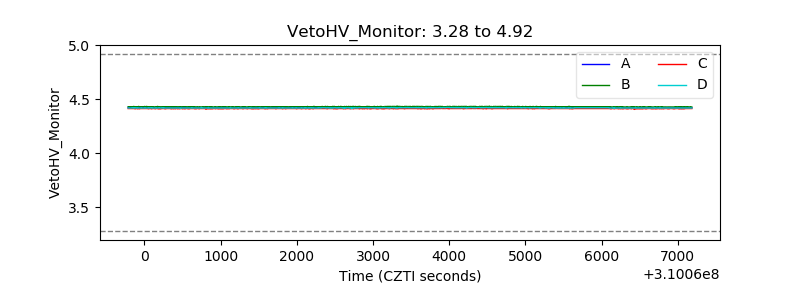 |
| Veto LLD | 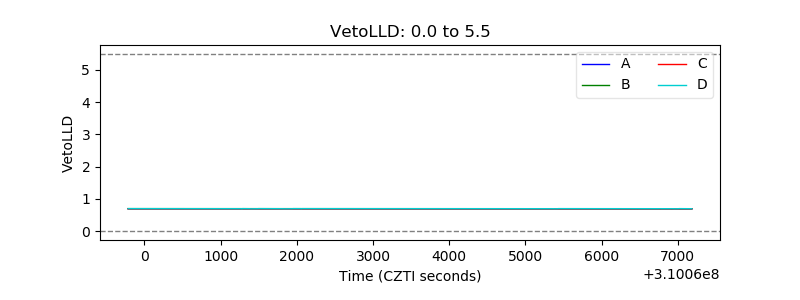 |
| Alpha Counter | 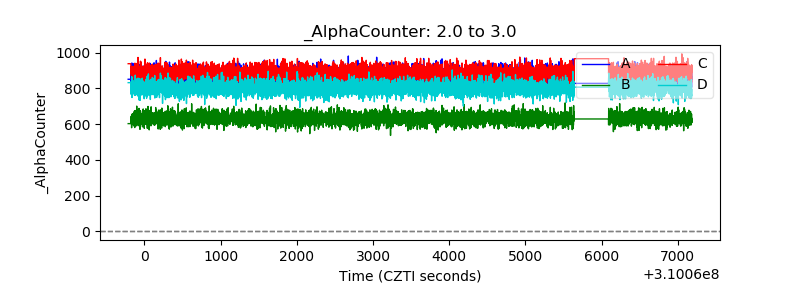 |
| _CPM_Rate | 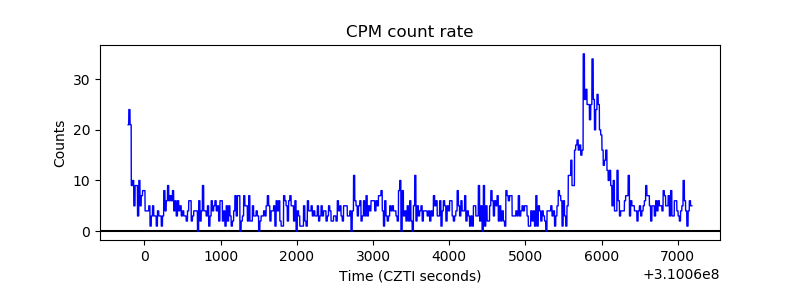 |
| CZT Counter | 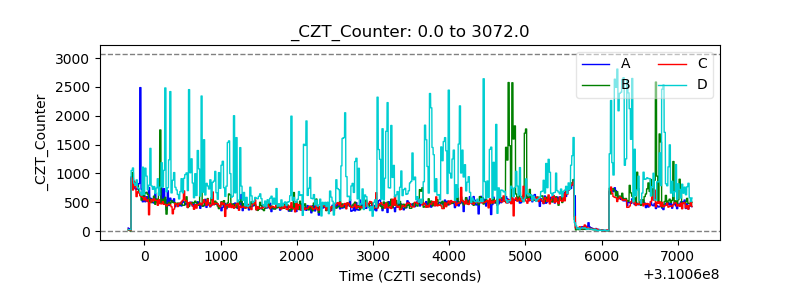 |
| +2.5 Volts monitor |  |
| +5 Volts monitor | 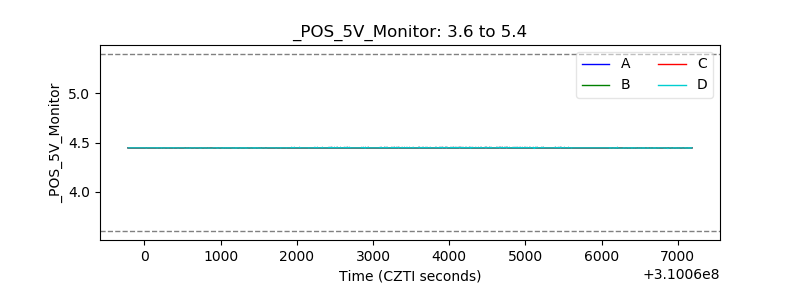 |
| _ROLL_ROT | 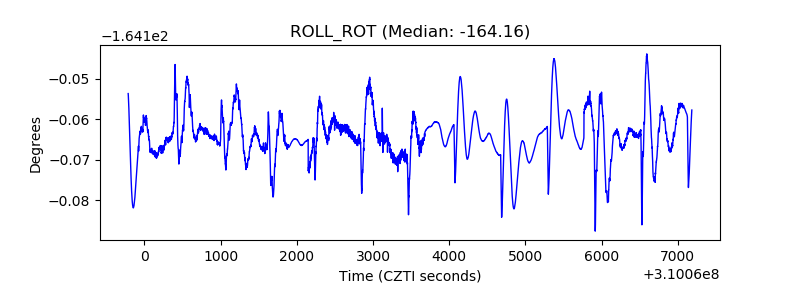 |
| _Roll_DEC | 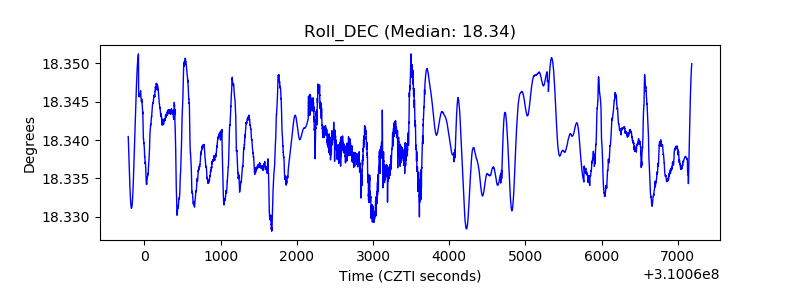 |
| _Roll_RA | 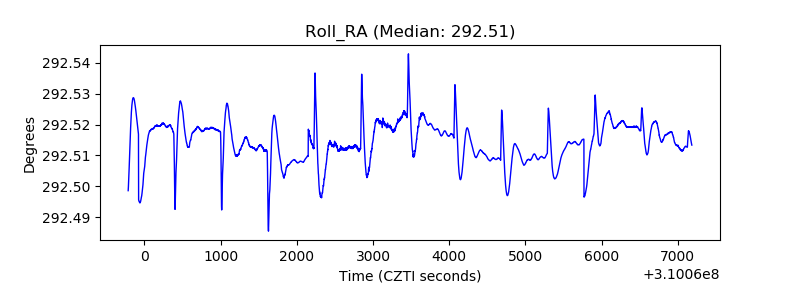 |
| Veto Counter | 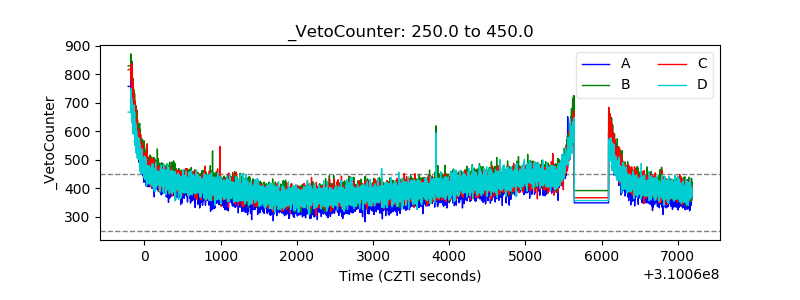 |