| Param | Original file | Final file |
|---|---|---|
| Filename | modeM0/AS1A07_007T04_9000003276cztM0_level2.fits | modeM0/AS1A07_007T04_9000003276cztM0_level2_quad_clean.evt |
| Size (bytes) | 1,163,871,360 | 1,110,876,480 |
| Size | 1.1 GB | 1.0 GB |
| Events in quadrant A | 7,293,506 | 6,796,534 |
| Events in quadrant B | 6,924,924 | 6,754,608 |
| Events in quadrant C | 6,982,342 | 6,418,810 |
| Events in quadrant D | 5,937,192 | 5,565,632 |
| Mode M9 | |||
|---|---|---|---|
| Quadrant | BADHDUFLAG | Total packets | Discarded packets |
| A | 0 | 185 | 0 |
| B | 0 | 185 | 0 |
| C | 0 | 185 | 0 |
| D | 0 | 185 | 0 |
| Mode M0 | |||
|---|---|---|---|
| Quadrant | BADHDUFLAG | Total packets | Discarded packets |
| A | 0 | 248701 | 0 |
| B | 0 | 252090 | 0 |
| C | 0 | 247565 | 0 |
| D | 0 | 335405 | 0 |
| Mode SS | |||
|---|---|---|---|
| Quadrant | BADHDUFLAG | Total packets | Discarded packets |
| A | 0 | 2404 | 0 |
| B | 0 | 2404 | 0 |
| C | 0 | 2404 | 0 |
| D | 0 | 2404 | 0 |
| Quadrant | Total seconds | Saturated seconds | Saturation percentage |
|---|---|---|---|
| A | 118330 | 1450 | 1.225387% |
| B | 118331 | 1839 | 1.554115% |
| C | 118330 | 1967 | 1.662300% |
| D | 118331 | 8437 | 7.130000% |
Noise dominated data is calculated using 1-second bins in cleaned event files. If a bin has >2000 counts, and if more than 50% of those come from <1% of pixels, then it is considered to be noise-dominated and hence unusable.
| Quadrant | # 1 sec bins | Bins with >0 counts | Bins with >2000 counts | High rate bins dominated by noise | Noise dominated (total time) | Noise dominated (detector-on time) | Marked lightcurve |
|---|---|---|---|---|---|---|---|
| A | 136351 | 118328 | 0 | 0 | 0.00% | 0.00% |  |
| B | 136351 | 118313 | 0 | 0 | 0.00% | 0.00% | 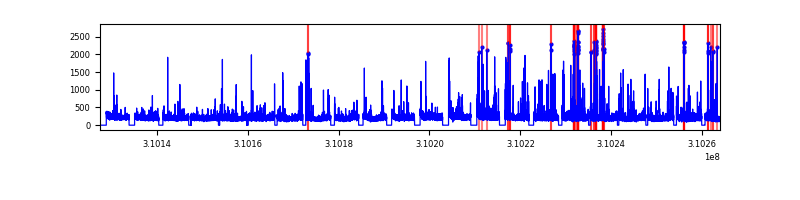 |
| C | 136351 | 118332 | 0 | 0 | 0.00% | 0.00% |  |
| D | 136351 | 118148 | 0 | 0 | 0.00% | 0.00% | 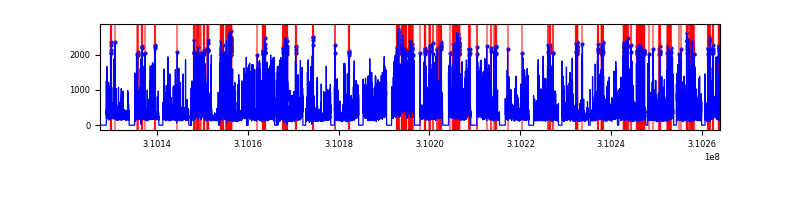 |
Top three noisy pixels from each quadrant. If the there are fewer than three noisy pixels in the level2.evt file, extra rows are filled as -1
| Pixel properties | Quadrant properties | ||||||
|---|---|---|---|---|---|---|---|
| Quadrant | DetID | PixID | Counts | Sigma | Mean | Median | Sigma |
| A | 0 | 29 | 6939 | 11.24 | 1897 | 1786 | 458.6 |
| A | 7 | 110 | 5660 | 8.45 | 1897 | 1786 | 458.6 |
| A | 9 | 19 | 5559 | 8.23 | 1897 | 1786 | 458.6 |
| B | 2 | 9 | 5521 | 10.62 | 1831 | 1751 | 355.0 |
| B | 3 | 17 | 4621 | 8.08 | 1831 | 1751 | 355.0 |
| B | 2 | 8 | 4600 | 8.02 | 1831 | 1751 | 355.0 |
| C | 12 | 241 | 4888 | 6.7 | 1846 | 1722 | 472.8 |
| C | 9 | 209 | 4619 | 6.13 | 1846 | 1722 | 472.8 |
| C | 3 | 126 | 4610 | 6.11 | 1846 | 1722 | 472.8 |
| D | 6 | 231 | 4355 | 6.31 | 1694 | 1544 | 445.2 |
| D | 3 | 14 | 4310 | 6.21 | 1694 | 1544 | 445.2 |
| D | 7 | 3 | 4249 | 6.07 | 1694 | 1544 | 445.2 |
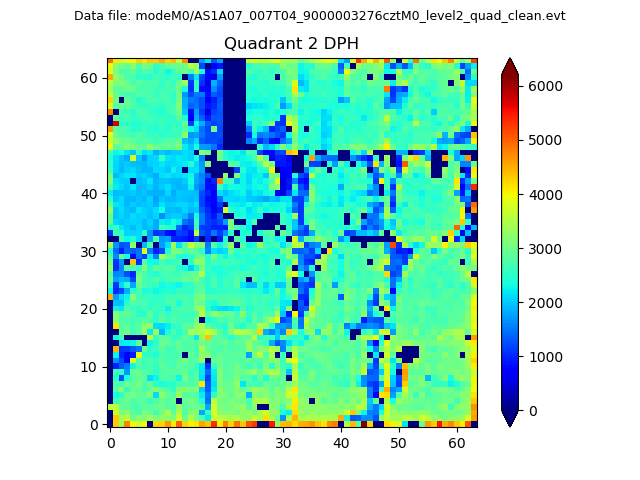
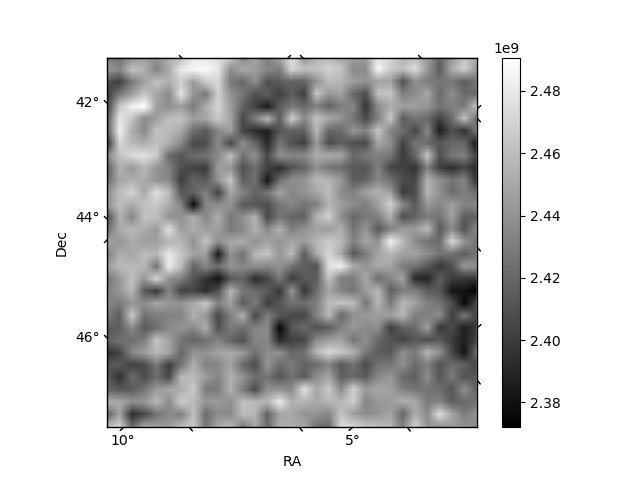
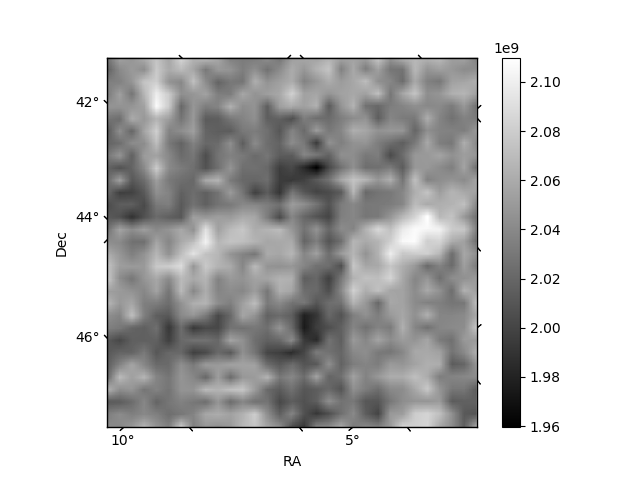
Histogram calculated using DETX and DETY for each event in the final _common_clean file
| Quadrant A | 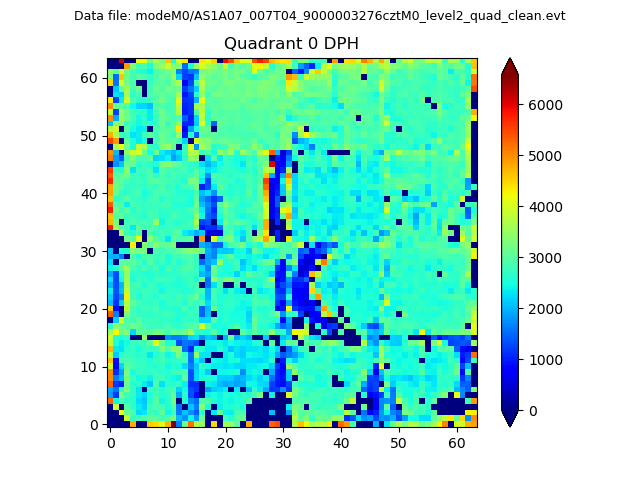 |
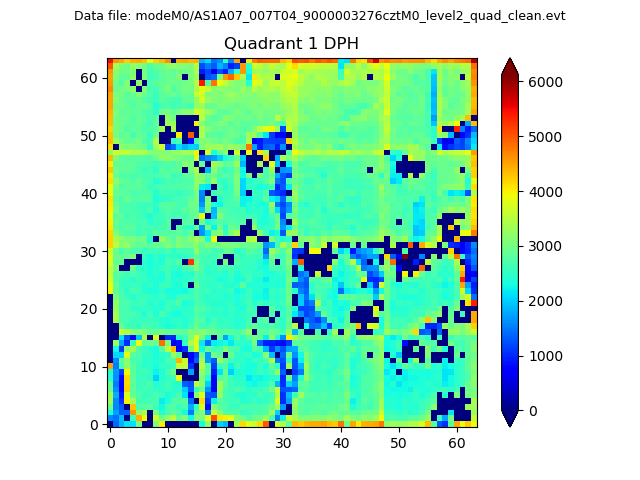 |
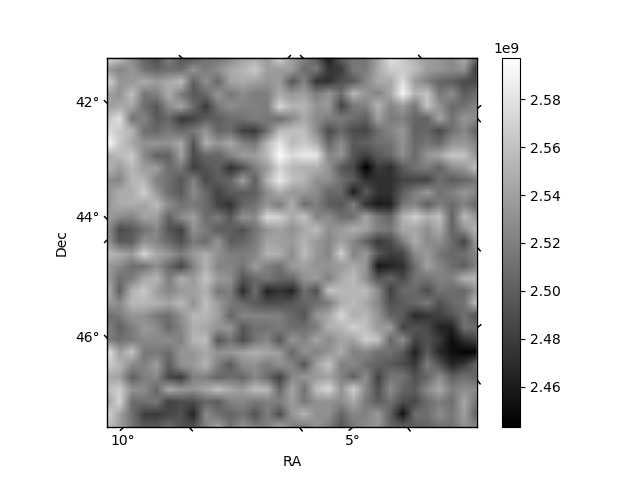
Quadrant B |
|---|---|---|---|
| Quadrant D | 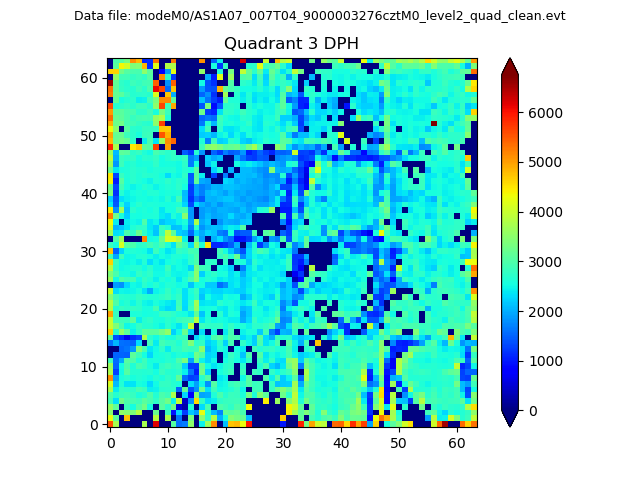 |
 |
Quadrant C |
| Plot type | Count rate plots | Images |
|---|---|---|
| Comparison with Poisson distribution Blue bars denote a histogram of data divided into 1 sec bins. Red curve is a Poisson curve with rate = median count rate of data. |
 |
 |
| Quadrant-wise count rates Data is divided into 100 sec bins |
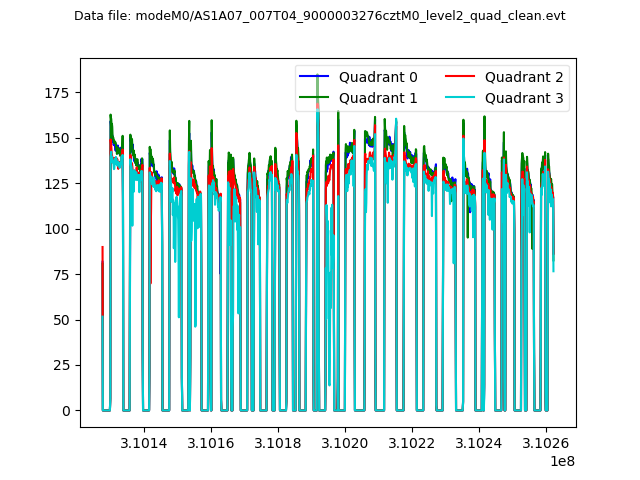 |
|
| Module-wise count rates for Quadrant A Data is divided into 100 sec bins |
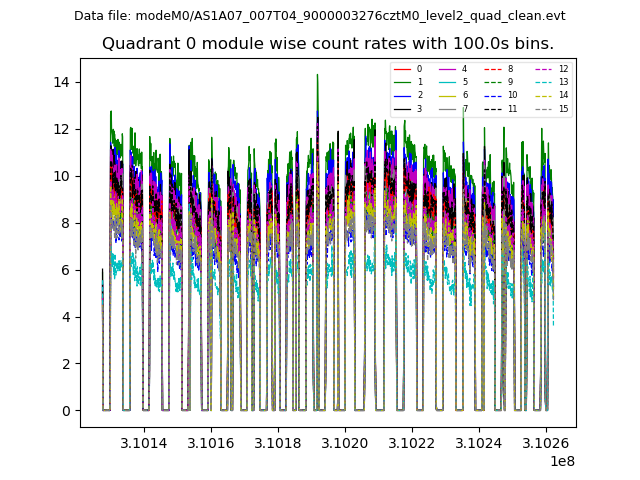 |
 |
| Module-wise count rates for Quadrant B Data is divided into 100 sec bins |
 |
 |
| Module-wise count rates for Quadrant C Data is divided into 100 sec bins |
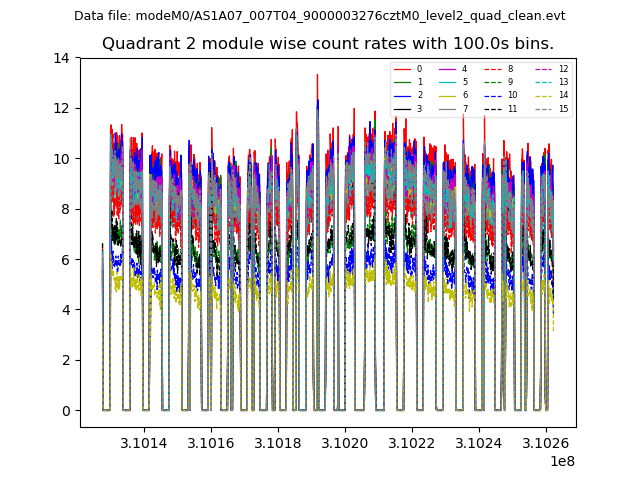 |
 |
| Module-wise count rates for Quadrant D Data is divided into 100 sec bins |
 |
 |
| Parameter | Plot |
|---|---|
| CZT HV Monitor | 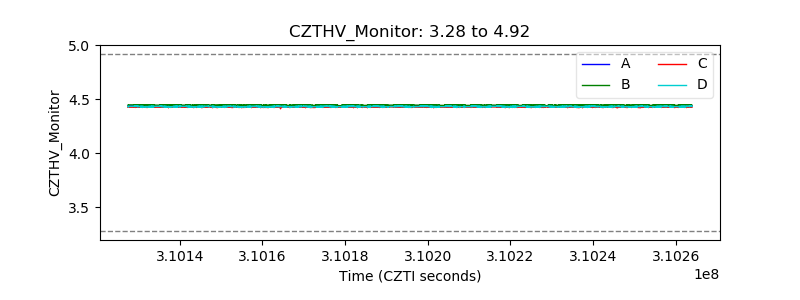 |
| D_VDD | 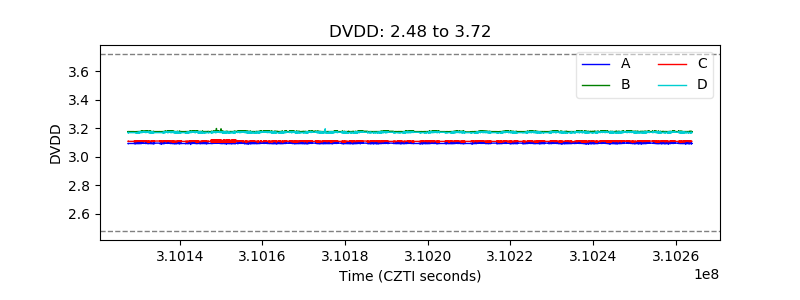 |
| Temperature 1 |  |
| Veto HV Monitor |  |
| Veto LLD | 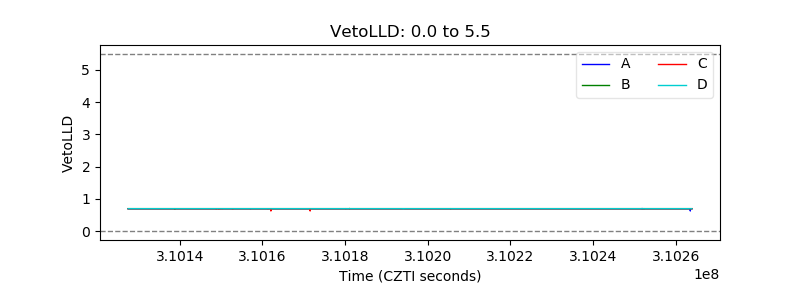 |
| Alpha Counter |  |
| _CPM_Rate | 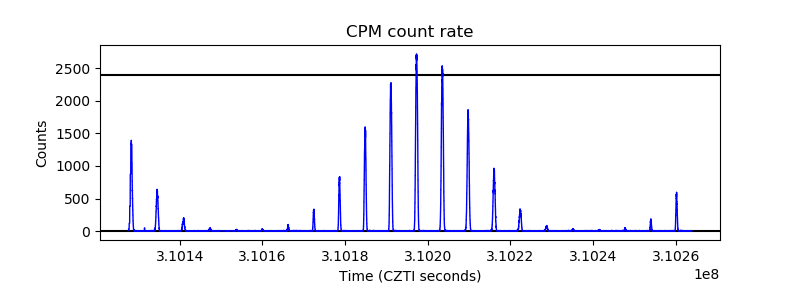 |
| CZT Counter |  |
| +2.5 Volts monitor | 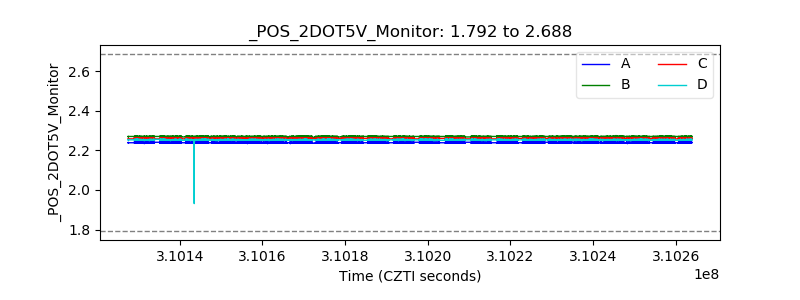 |
| +5 Volts monitor | 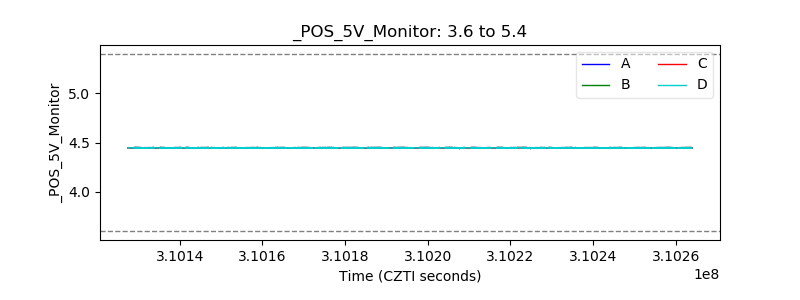 |
| _ROLL_ROT | 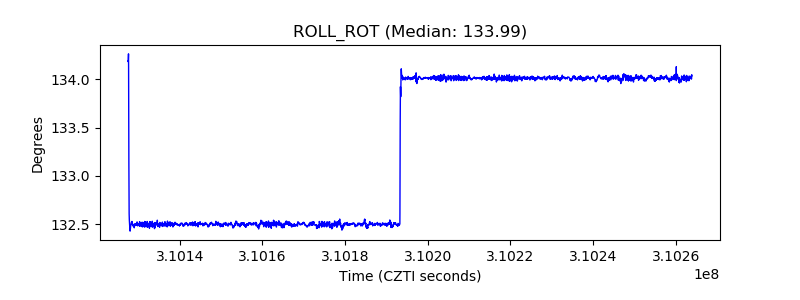 |
| _Roll_DEC | 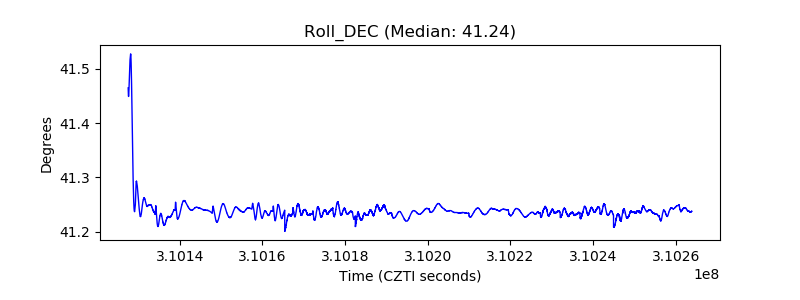 |
| _Roll_RA | 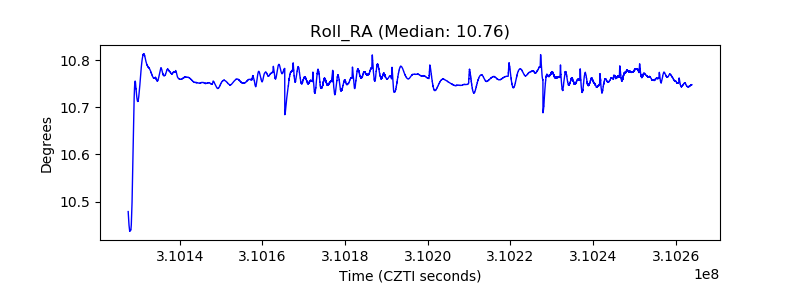 |
| Veto Counter |  |