| Param | Original file | Final file |
|---|---|---|
| Filename | modeM0/AS1A07_007T04_9000003276_22104cztM0_level2.evt | modeM0/AS1A07_007T04_9000003276_22104cztM0_level2_quad_clean.evt |
| Size (bytes) | 473,993,280 | 103,584,960 |
| Size | 452.0 MB | 98.8 MB |
| Events in quadrant A | 3,449,359 | 692,862 |
| Events in quadrant B | 3,369,194 | 697,955 |
| Events in quadrant C | 3,362,382 | 654,342 |
| Events in quadrant D | 3,736,907 | 642,935 |
| Mode M9 | |||
|---|---|---|---|
| Quadrant | BADHDUFLAG | Total packets | Discarded packets |
| A | 0 | 12 | 0 |
| B | 0 | 12 | 0 |
| C | 0 | 12 | 0 |
| D | 0 | 12 | 0 |
| Mode M0 | |||
|---|---|---|---|
| Quadrant | BADHDUFLAG | Total packets | Discarded packets |
| A | 0 | 14082 | 2 |
| B | 0 | 13767 | 1 |
| C | 0 | 13630 | 1 |
| D | 0 | 14928 | 1 |
| Mode SS | |||
|---|---|---|---|
| Quadrant | BADHDUFLAG | Total packets | Discarded packets |
| A | 0 | 132 | 0 |
| B | 0 | 132 | 0 |
| C | 0 | 132 | 0 |
| D | 0 | 132 | 0 |
| Quadrant | Total seconds | Saturated seconds | Saturation percentage |
|---|---|---|---|
| A | 6433 | 102 | 1.585574% |
| B | 6433 | 93 | 1.445671% |
| C | 6434 | 99 | 1.538701% |
| D | 6434 | 159 | 2.471247% |
Noise dominated data is calculated using 1-second bins in cleaned event files. If a bin has >2000 counts, and if more than 50% of those come from <1% of pixels, then it is considered to be noise-dominated and hence unusable.
| Quadrant | # 1 sec bins | Bins with >0 counts | Bins with >2000 counts | High rate bins dominated by noise | Noise dominated (total time) | Noise dominated (detector-on time) | Marked lightcurve |
|---|---|---|---|---|---|---|---|
| A | 7653 | 6434 | 8 | 8 | 0.10% | 0.12% | 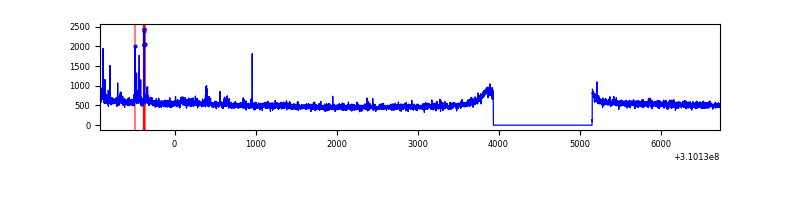 |
| B | 7653 | 6434 | 0 | 0 | 0.00% | 0.00% | 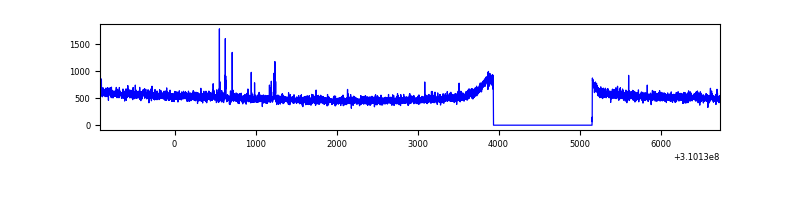 |
| C | 7654 | 6435 | 0 | 0 | 0.00% | 0.00% | 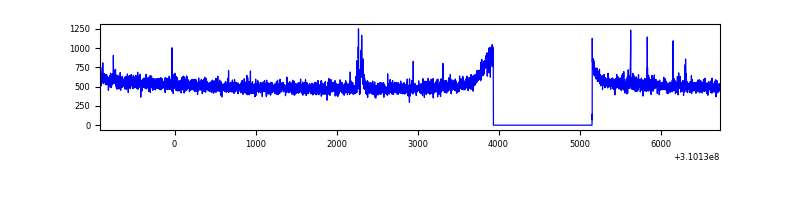 |
| D | 7654 | 6435 | 53 | 53 | 0.69% | 0.82% | 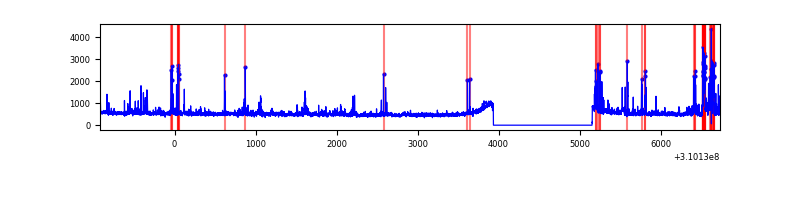 |
Top three noisy pixels from each quadrant. If the there are fewer than three noisy pixels in the level2.evt file, extra rows are filled as -1
| Pixel properties | Quadrant properties | ||||||
|---|---|---|---|---|---|---|---|
| Quadrant | DetID | PixID | Counts | Sigma | Mean | Median | Sigma |
| A | 5 | 16 | 93883 | 540.35 | 871 | 856 | 172.2 |
| A | 13 | 254 | 9995 | 53.08 | 871 | 856 | 172.2 |
| A | 0 | 226 | 7514 | 38.67 | 871 | 856 | 172.2 |
| B | 12 | 111 | 18739 | 111.57 | 853 | 833 | 160.5 |
| B | 11 | 111 | 16973 | 100.57 | 853 | 833 | 160.5 |
| B | 14 | 111 | 14874 | 87.49 | 853 | 833 | 160.5 |
| C | 14 | 238 | 130828 | 689.27 | 818 | 824 | 188.6 |
| C | 10 | 22 | 34387 | 177.95 | 818 | 824 | 188.6 |
| C | 8 | 222 | 5713 | 25.92 | 818 | 824 | 188.6 |
| D | 11 | 176 | 324415 | 1602.09 | 836 | 814 | 202.0 |
| D | 1 | 52 | 119077 | 585.5 | 836 | 814 | 202.0 |
| D | 2 | 136 | 67974 | 332.5 | 836 | 814 | 202.0 |
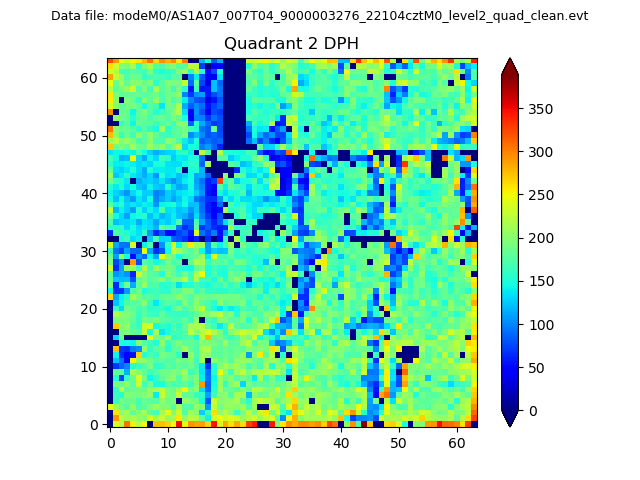
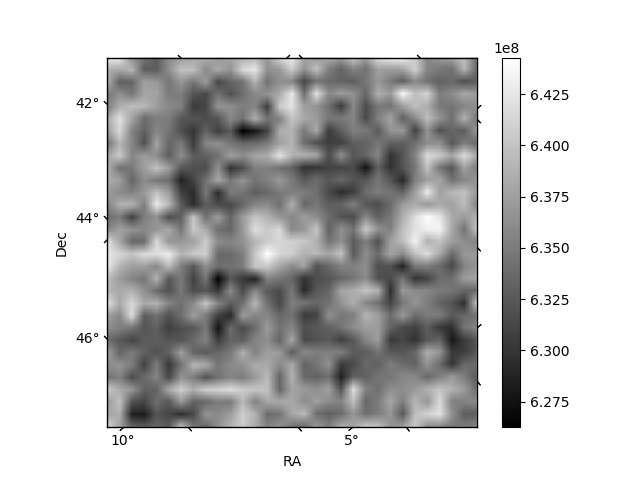
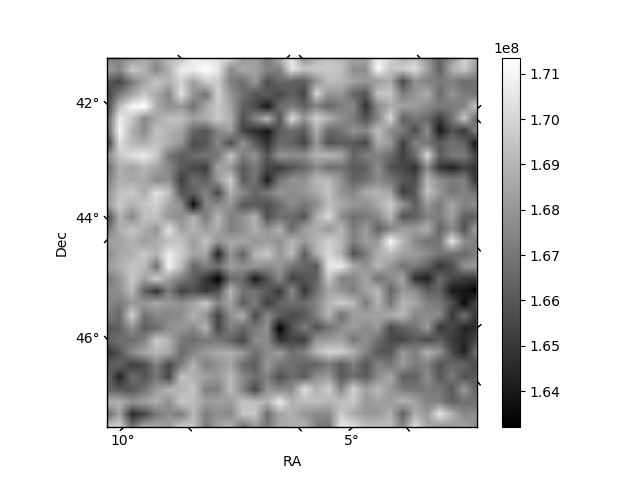
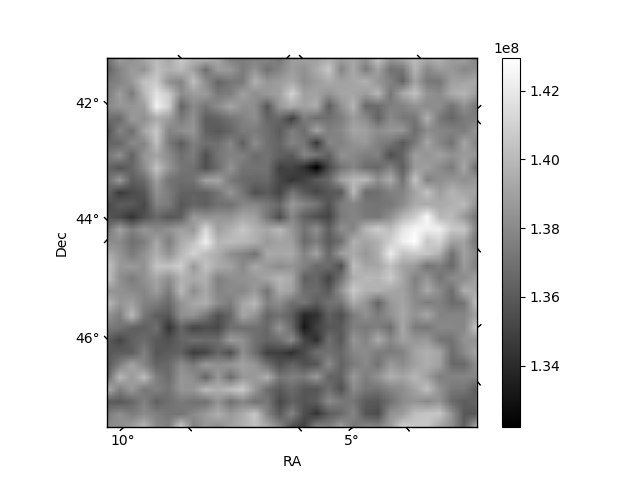
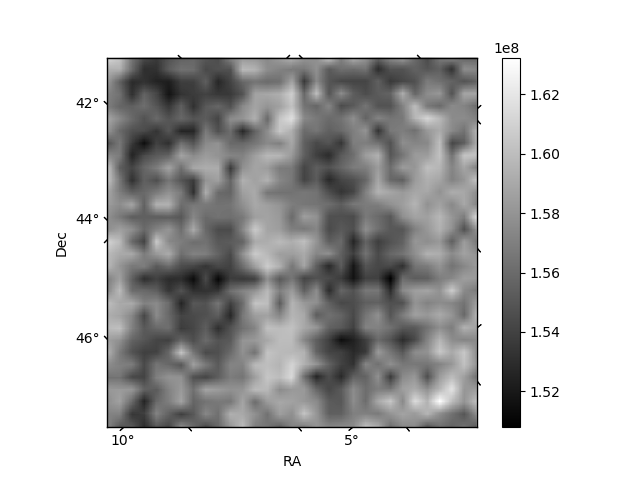
Histogram calculated using DETX and DETY for each event in the final _common_clean file
| Quadrant A | 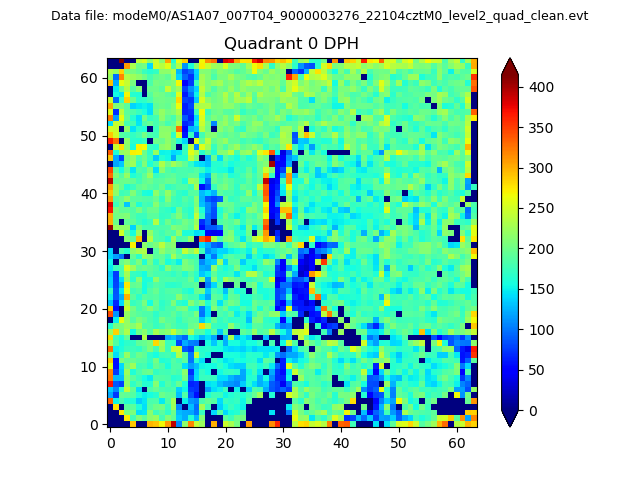 |
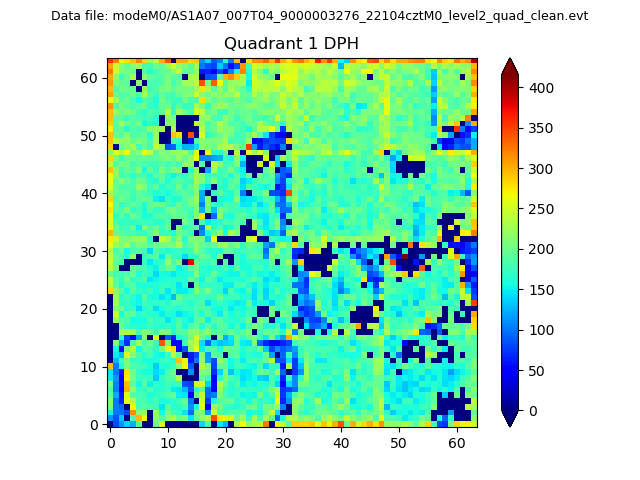 |
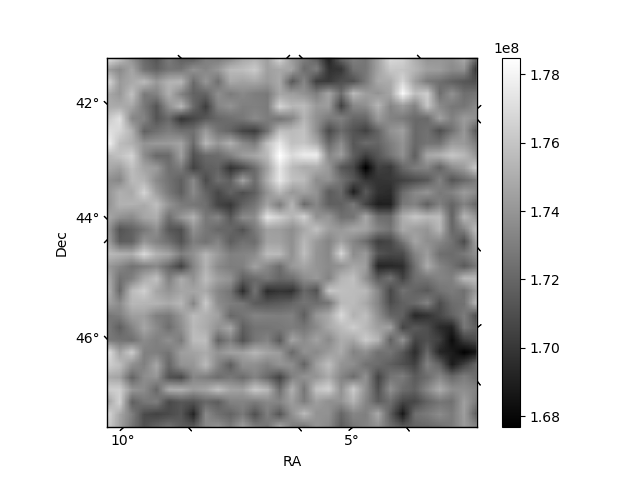
Quadrant B |
|---|---|---|---|
| Quadrant D | 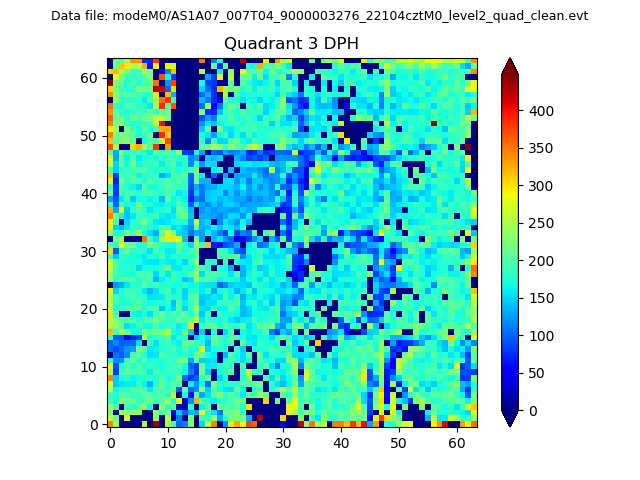 |
 |
Quadrant C |
| Plot type | Count rate plots | Images |
|---|---|---|
| Comparison with Poisson distribution Blue bars denote a histogram of data divided into 1 sec bins. Red curve is a Poisson curve with rate = median count rate of data. |
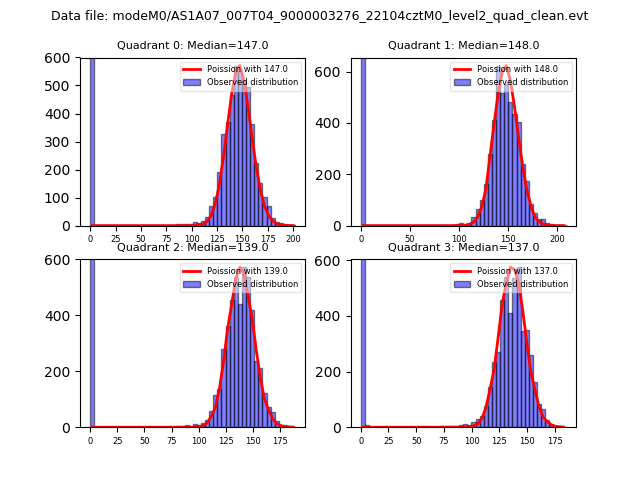 |
 |
| Quadrant-wise count rates Data is divided into 100 sec bins |
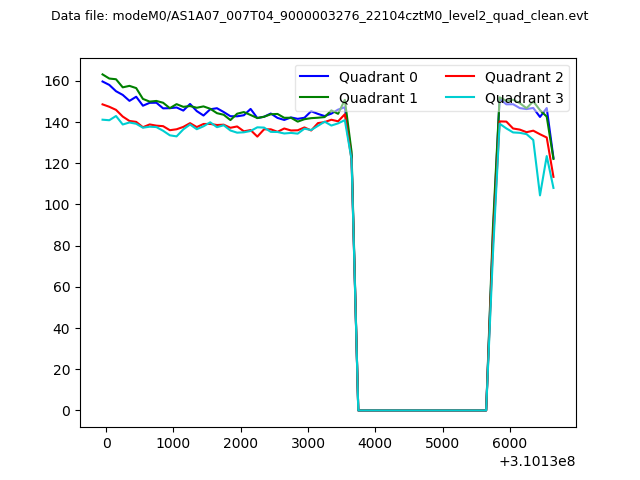 |
|
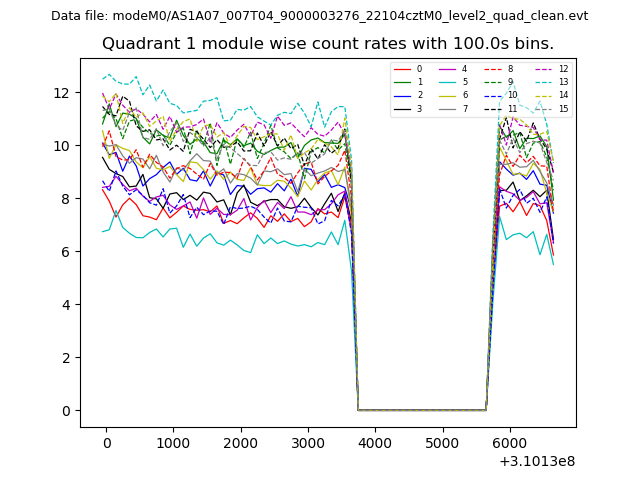
| Module-wise count rates for Quadrant A Data is divided into 100 sec bins |
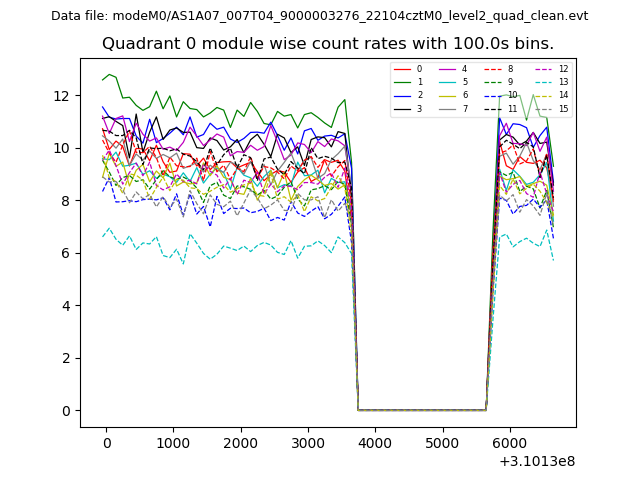 |
 |
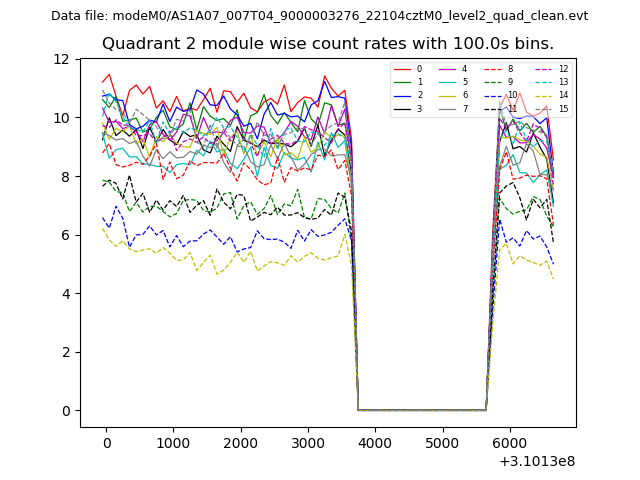
| Module-wise count rates for Quadrant B Data is divided into 100 sec bins |
 |
 |
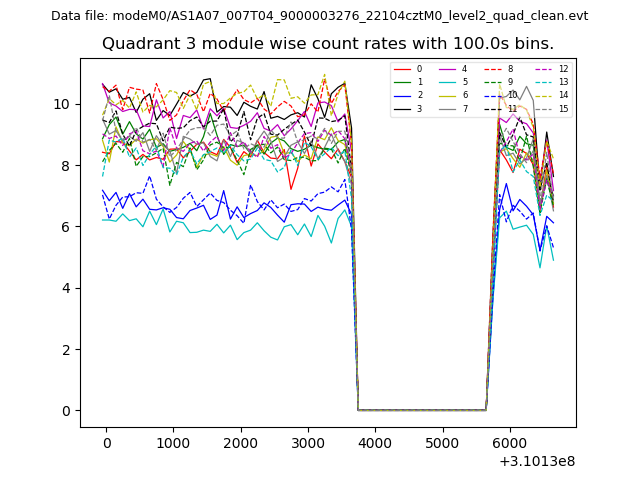
| Module-wise count rates for Quadrant C Data is divided into 100 sec bins |
 |
 |
| Module-wise count rates for Quadrant D Data is divided into 100 sec bins |
 |
 |
| Parameter | Plot |
|---|---|
| CZT HV Monitor | 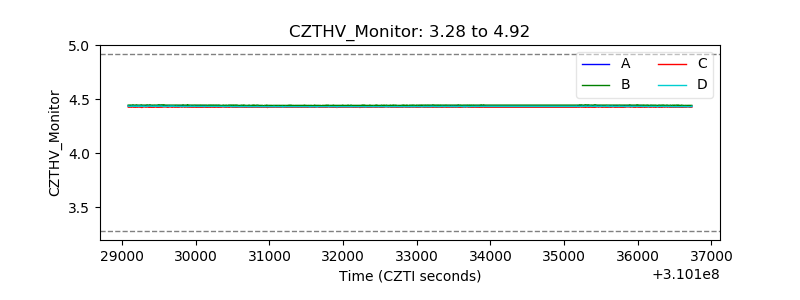 |
| D_VDD |  |
| Temperature 1 |  |
| Veto HV Monitor | 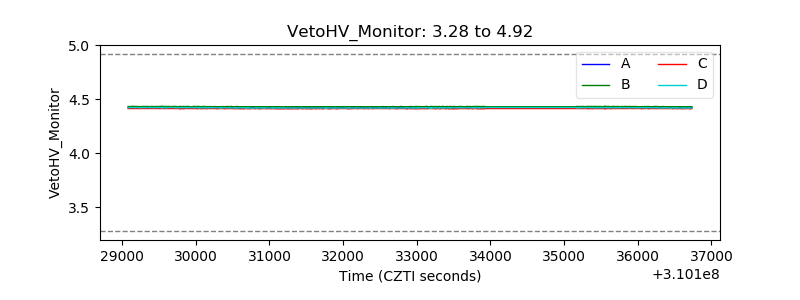 |
| Veto LLD | 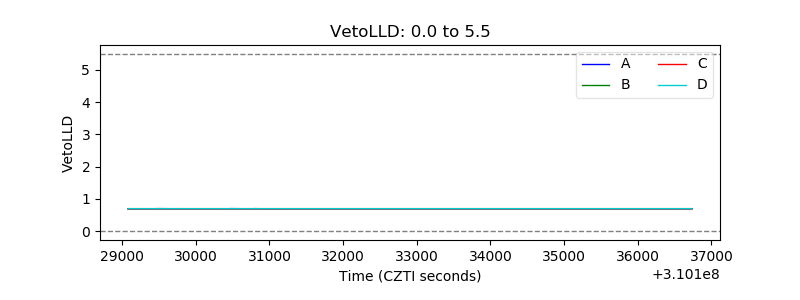 |
| Alpha Counter | 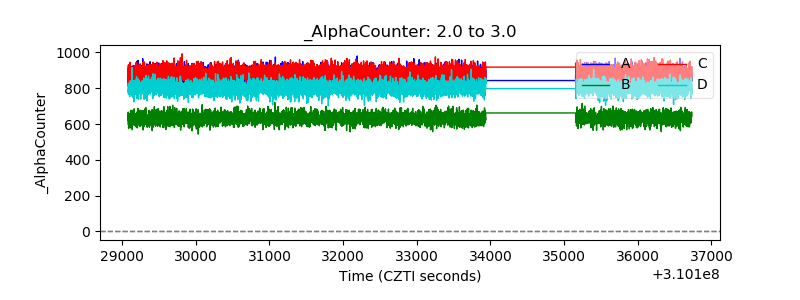 |
| _CPM_Rate | 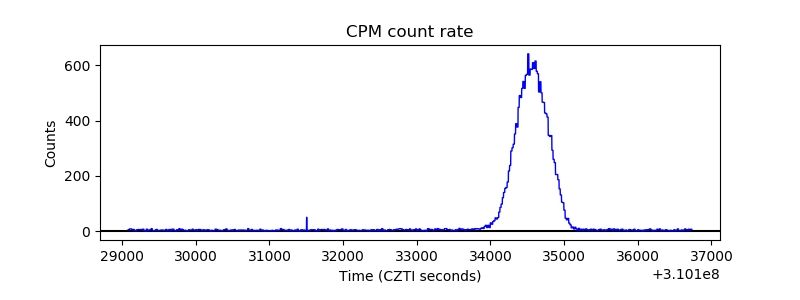 |
| CZT Counter | 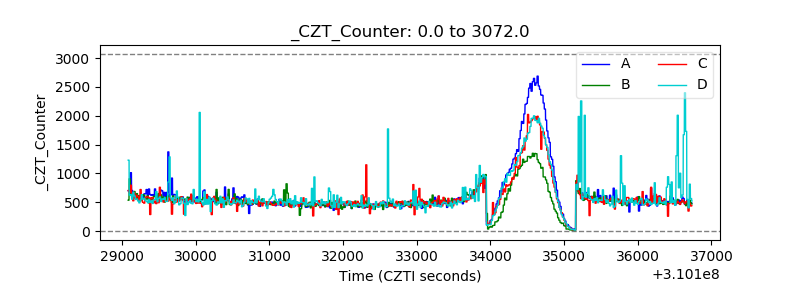 |
| +2.5 Volts monitor | 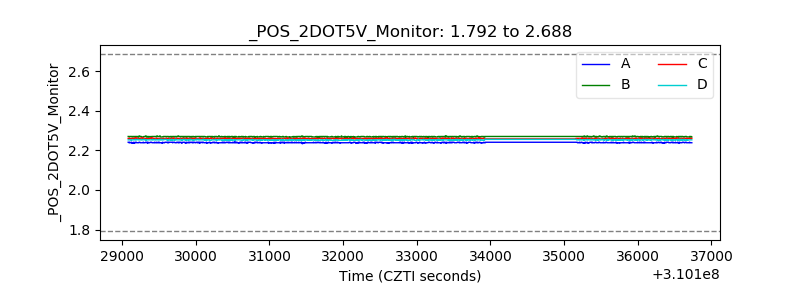 |
| +5 Volts monitor |  |
| _ROLL_ROT | 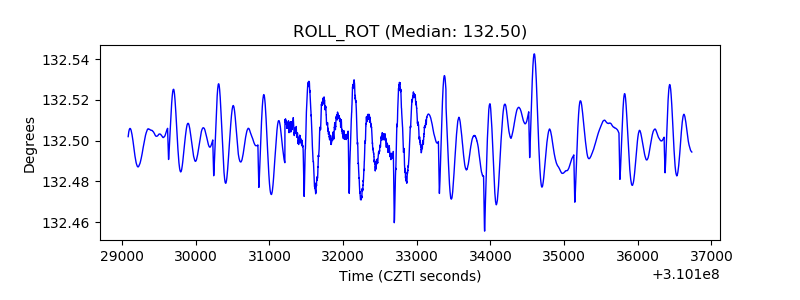 |
| _Roll_DEC | 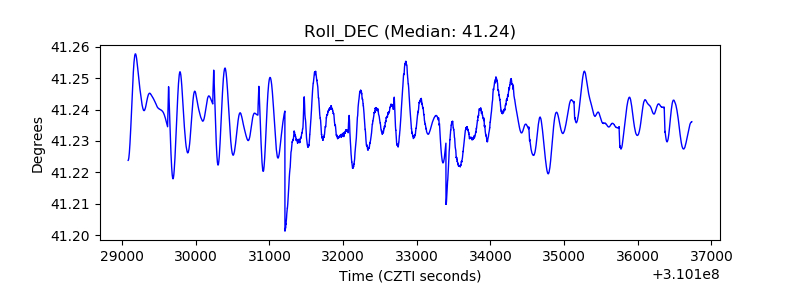 |
| _Roll_RA | 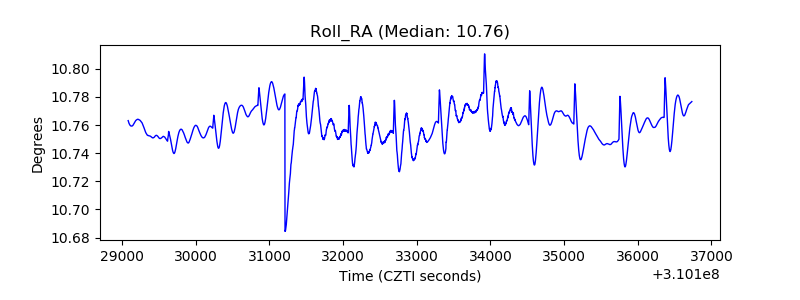 |
| Veto Counter | 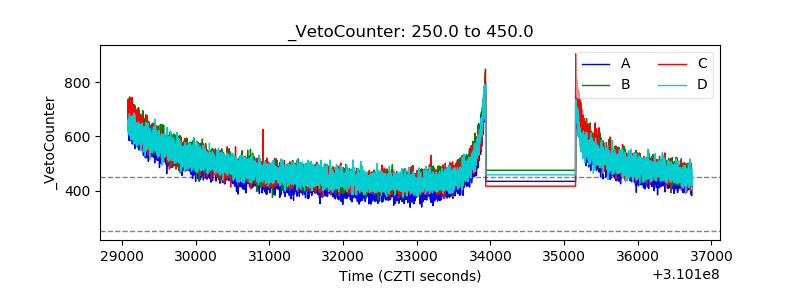 |