| Param | Original file | Final file |
|---|---|---|
| Filename | modeM0/AS1A07_007T04_9000003276_22106cztM0_level2.evt | modeM0/AS1A07_007T04_9000003276_22106cztM0_level2_quad_clean.evt |
| Size (bytes) | 476,939,520 | 100,054,080 |
| Size | 454.8 MB | 95.4 MB |
| Events in quadrant A | 3,254,487 | 661,051 |
| Events in quadrant B | 3,239,219 | 667,351 |
| Events in quadrant C | 3,479,479 | 627,515 |
| Events in quadrant D | 4,020,600 | 612,275 |
| Mode M9 | |||
|---|---|---|---|
| Quadrant | BADHDUFLAG | Total packets | Discarded packets |
| A | 0 | 6 | 0 |
| B | 0 | 6 | 0 |
| C | 0 | 6 | 0 |
| D | 0 | 6 | 0 |
| Mode M0 | |||
|---|---|---|---|
| Quadrant | BADHDUFLAG | Total packets | Discarded packets |
| A | 0 | 13906 | 1 |
| B | 0 | 13786 | 1 |
| C | 0 | 14493 | 1 |
| D | 0 | 16370 | 1 |
| Mode SS | |||
|---|---|---|---|
| Quadrant | BADHDUFLAG | Total packets | Discarded packets |
| A | 0 | 134 | 0 |
| B | 0 | 134 | 0 |
| C | 0 | 134 | 0 |
| D | 0 | 134 | 0 |
| Quadrant | Total seconds | Saturated seconds | Saturation percentage |
|---|---|---|---|
| A | 6632 | 123 | 1.854644% |
| B | 6632 | 130 | 1.960193% |
| C | 6632 | 269 | 4.056092% |
| D | 6632 | 316 | 4.764777% |
Noise dominated data is calculated using 1-second bins in cleaned event files. If a bin has >2000 counts, and if more than 50% of those come from <1% of pixels, then it is considered to be noise-dominated and hence unusable.
| Quadrant | # 1 sec bins | Bins with >0 counts | Bins with >2000 counts | High rate bins dominated by noise | Noise dominated (total time) | Noise dominated (detector-on time) | Marked lightcurve |
|---|---|---|---|---|---|---|---|
| A | 7147 | 6634 | 18 | 18 | 0.25% | 0.27% | 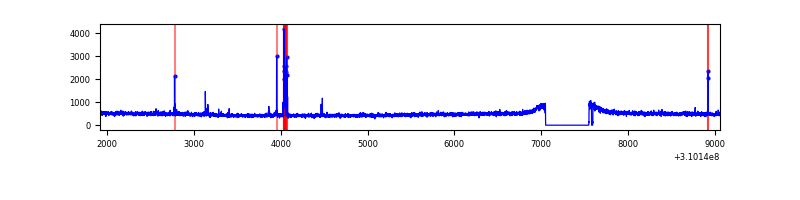 |
| B | 7147 | 6634 | 2 | 2 | 0.03% | 0.03% | 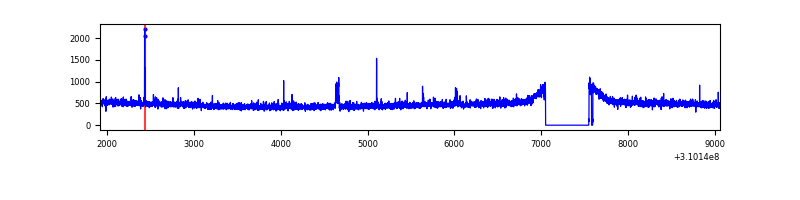 |
| C | 7147 | 6634 | 104 | 104 | 1.46% | 1.57% | 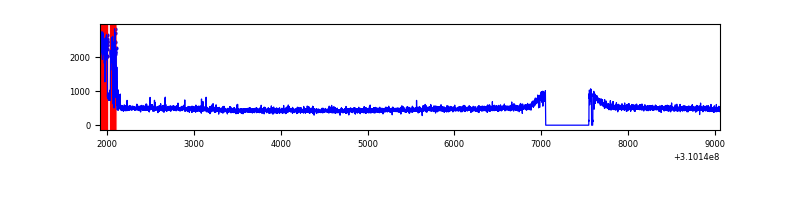 |
| D | 7147 | 6634 | 162 | 162 | 2.27% | 2.44% | 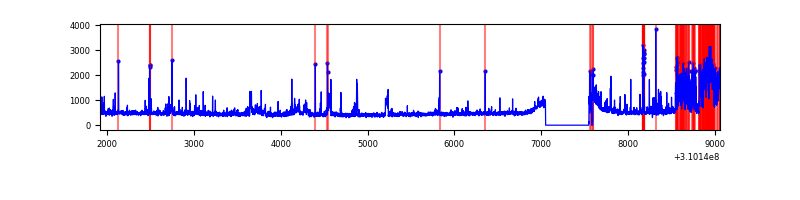 |
Top three noisy pixels from each quadrant. If the there are fewer than three noisy pixels in the level2.evt file, extra rows are filled as -1
| Pixel properties | Quadrant properties | ||||||
|---|---|---|---|---|---|---|---|
| Quadrant | DetID | PixID | Counts | Sigma | Mean | Median | Sigma |
| A | 5 | 16 | 86906 | 521.27 | 822 | 805 | 165.2 |
| A | 13 | 254 | 10438 | 58.32 | 822 | 805 | 165.2 |
| A | 0 | 226 | 7214 | 38.8 | 822 | 805 | 165.2 |
| B | 12 | 111 | 18862 | 115.42 | 817 | 798 | 156.5 |
| B | 11 | 111 | 16693 | 101.56 | 817 | 798 | 156.5 |
| B | 0 | 197 | 15560 | 94.32 | 817 | 798 | 156.5 |
| C | 10 | 22 | 288501 | 1557.37 | 784 | 787 | 184.7 |
| C | 14 | 238 | 122543 | 659.05 | 784 | 787 | 184.7 |
| C | 5 | 4 | 6775 | 32.41 | 784 | 787 | 184.7 |
| D | 2 | 133 | 597145 | 3082.74 | 796 | 772 | 193.5 |
| D | 11 | 176 | 170421 | 876.94 | 796 | 772 | 193.5 |
| D | 1 | 52 | 103143 | 529.17 | 796 | 772 | 193.5 |
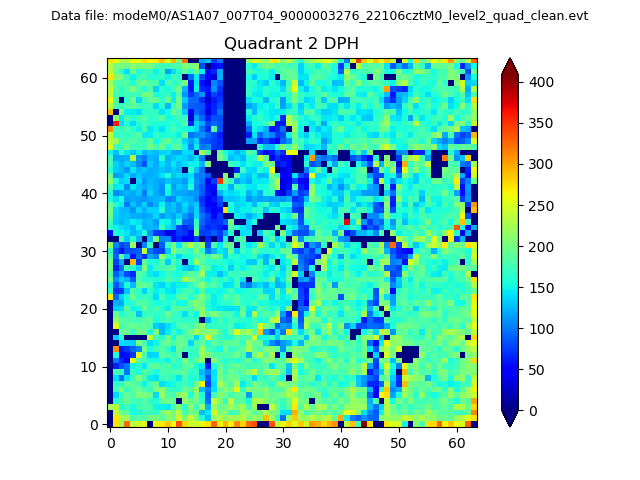
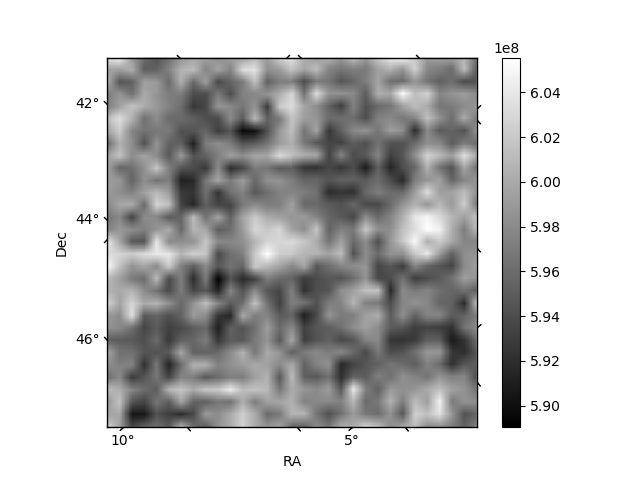
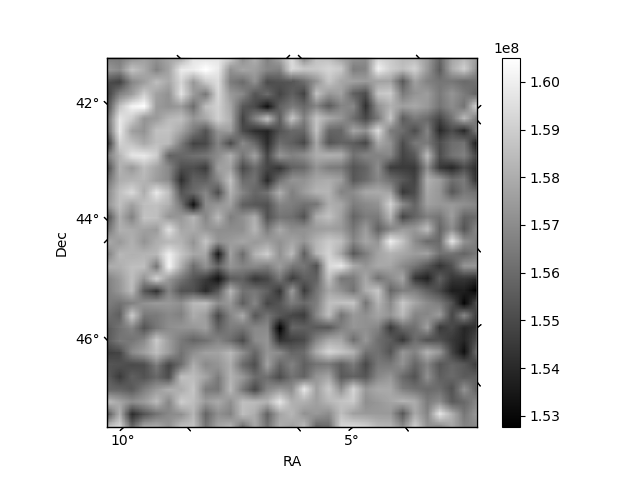
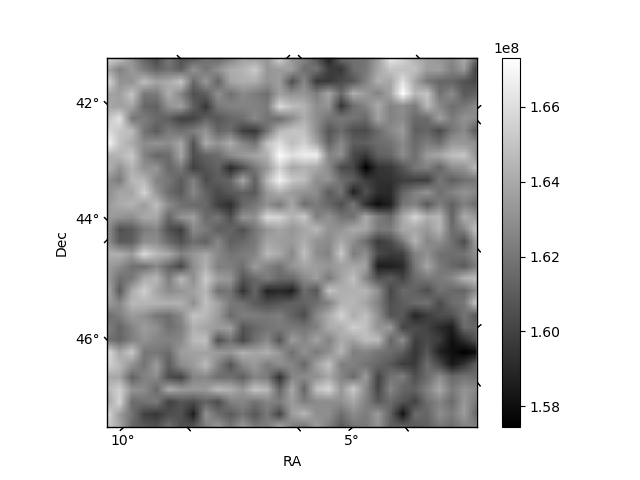
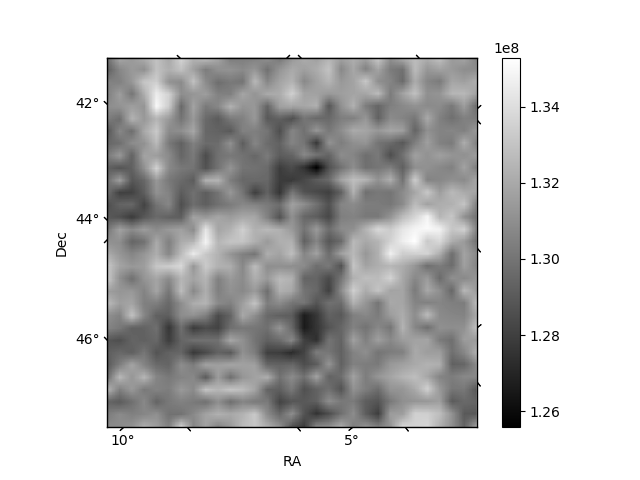
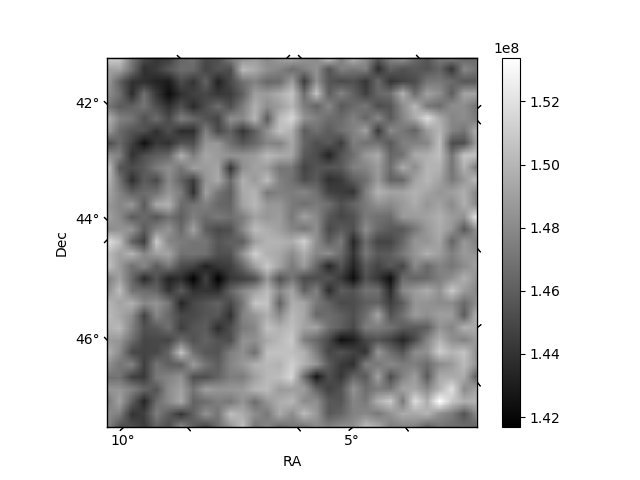
Histogram calculated using DETX and DETY for each event in the final _common_clean file
| Quadrant A | 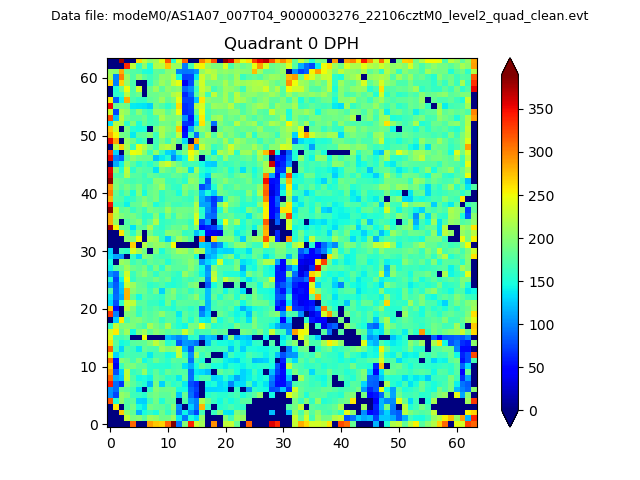 |
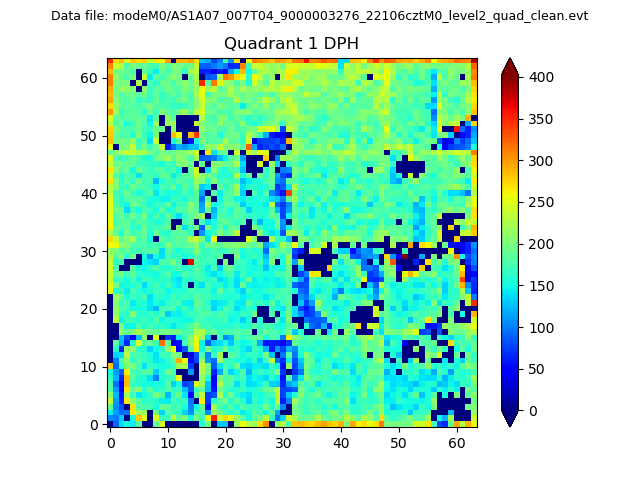 |
Quadrant B |
|---|---|---|---|
| Quadrant D | 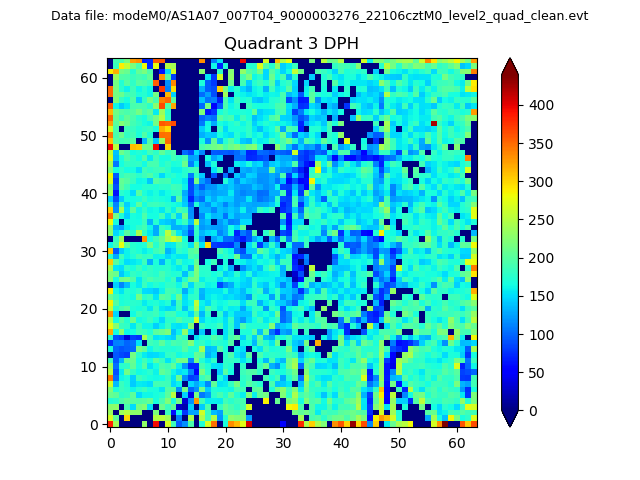 |
 |
Quadrant C |
| Plot type | Count rate plots | Images |
|---|---|---|
| Comparison with Poisson distribution Blue bars denote a histogram of data divided into 1 sec bins. Red curve is a Poisson curve with rate = median count rate of data. |
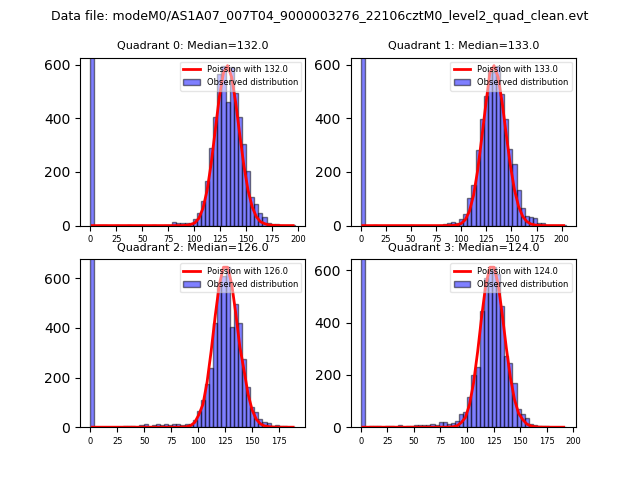 |
 |
| Quadrant-wise count rates Data is divided into 100 sec bins |
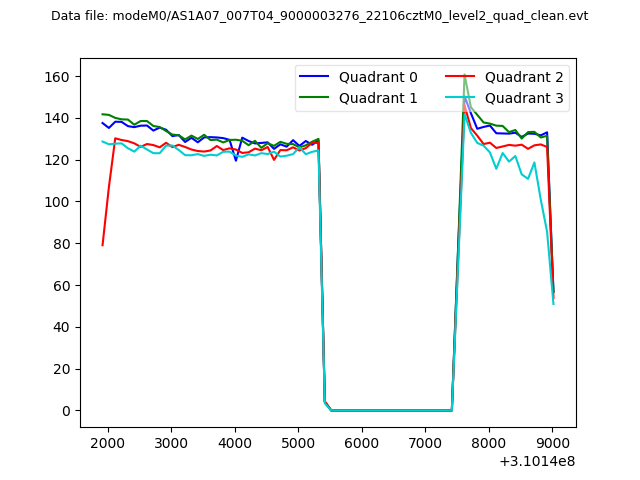 |
|
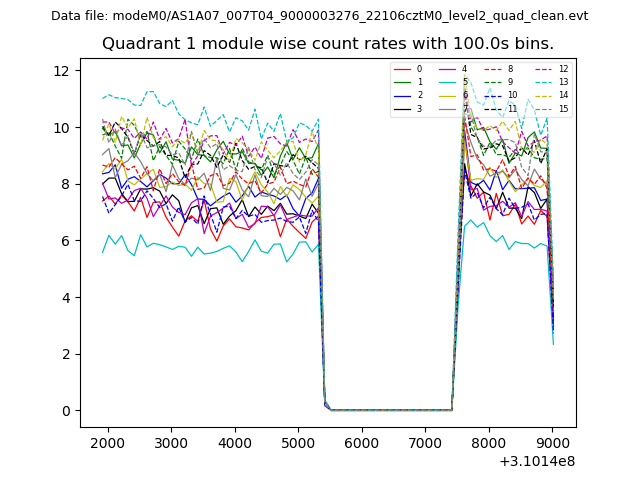
| Module-wise count rates for Quadrant A Data is divided into 100 sec bins |
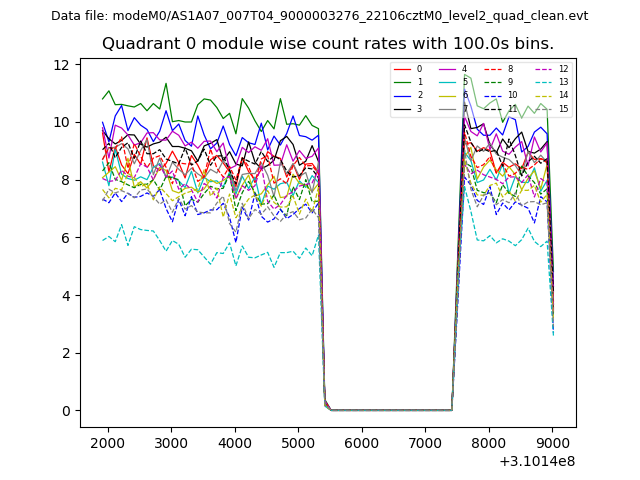 |
 |
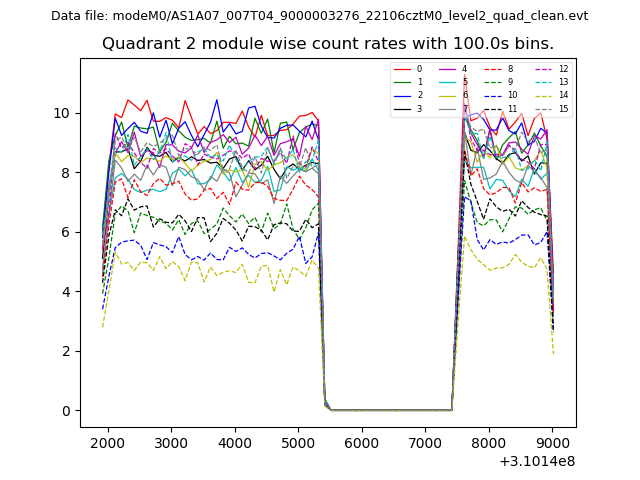
| Module-wise count rates for Quadrant B Data is divided into 100 sec bins |
 |
 |
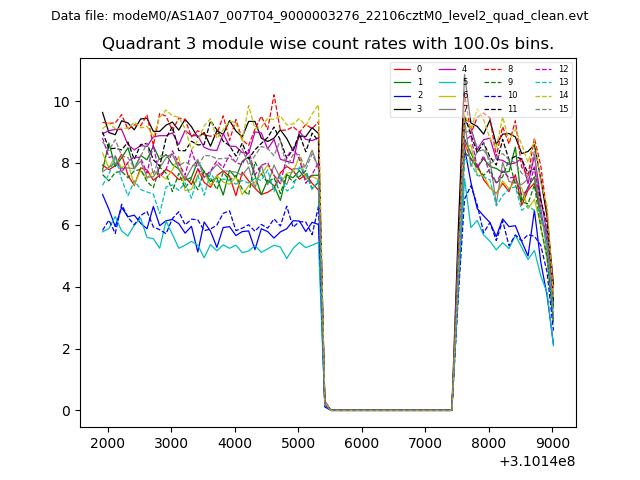
| Module-wise count rates for Quadrant C Data is divided into 100 sec bins |
 |
 |
| Module-wise count rates for Quadrant D Data is divided into 100 sec bins |
 |
 |
| Parameter | Plot |
|---|---|
| CZT HV Monitor | 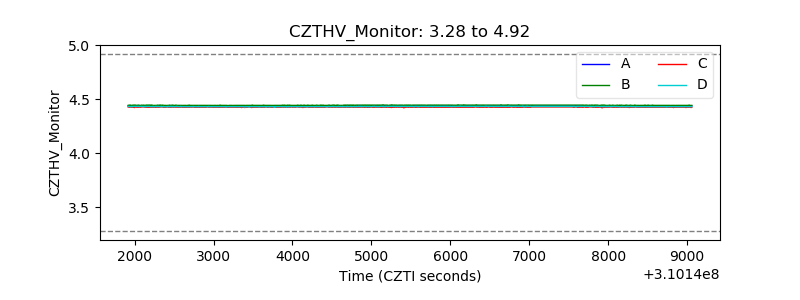 |
| D_VDD | 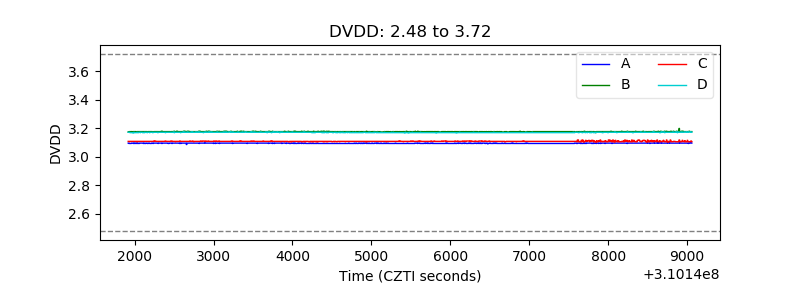 |
| Temperature 1 | 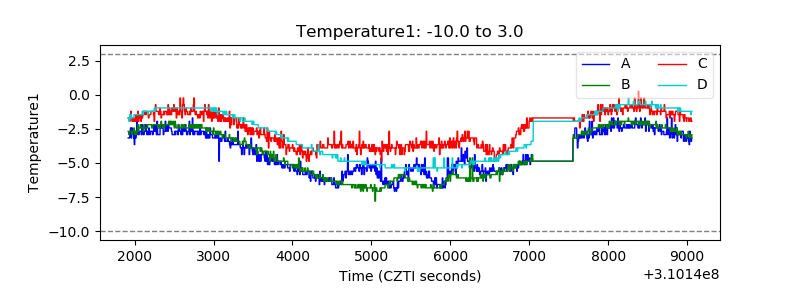 |
| Veto HV Monitor | 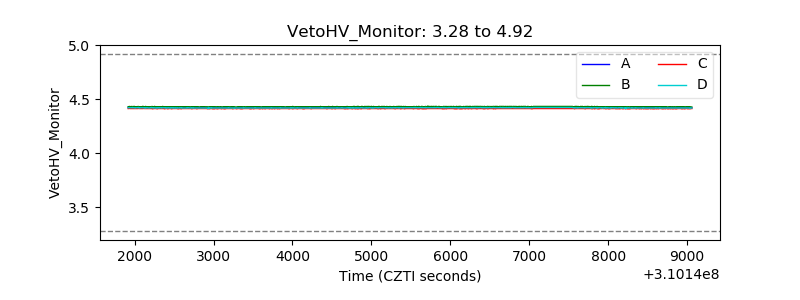 |
| Veto LLD | 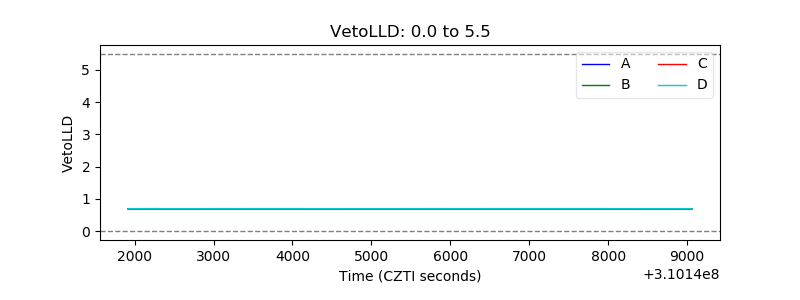 |
| Alpha Counter | 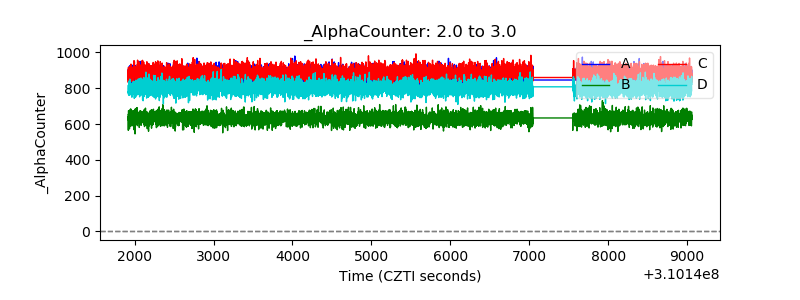 |
| _CPM_Rate | 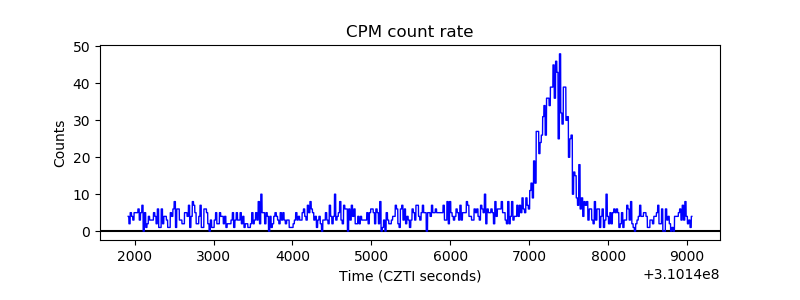 |
| CZT Counter | 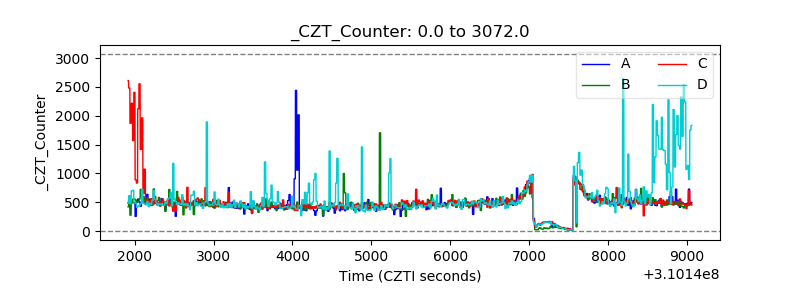 |
| +2.5 Volts monitor |  |
| +5 Volts monitor |  |
| _ROLL_ROT | 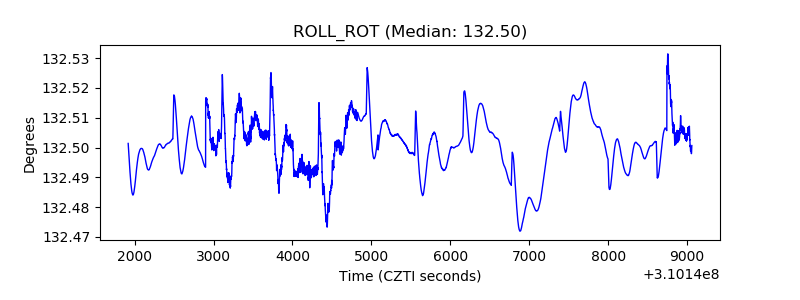 |
| _Roll_DEC | 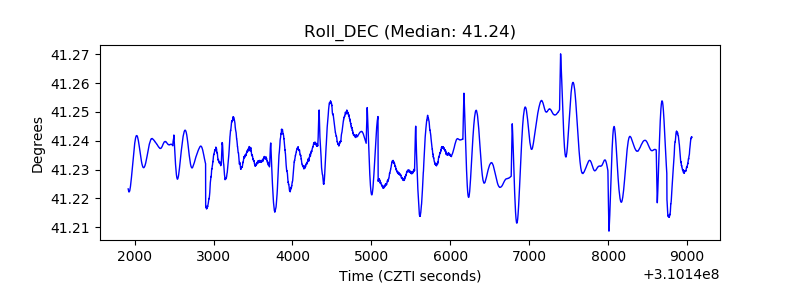 |
| _Roll_RA | 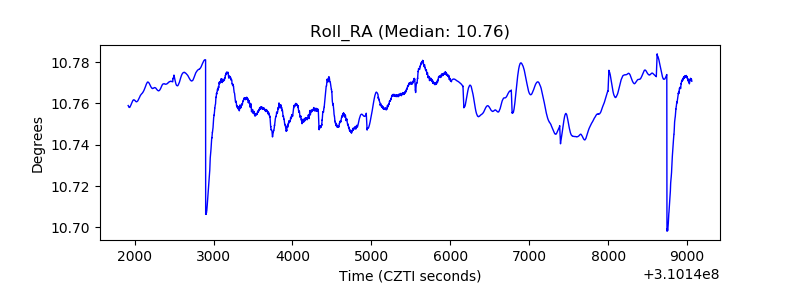 |
| Veto Counter | 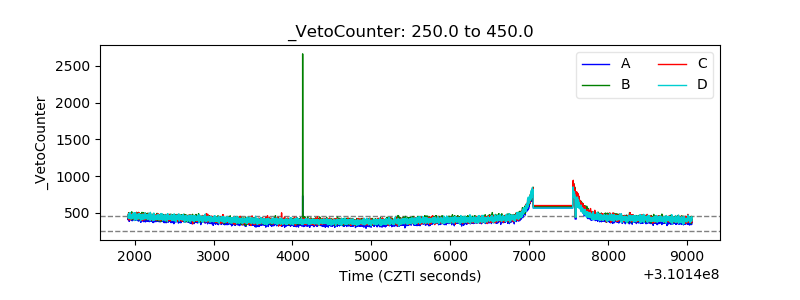 |