| Param | Original file | Final file |
|---|---|---|
| Filename | modeM0/AS1A07_007T04_9000003276_22107cztM0_level2.evt | modeM0/AS1A07_007T04_9000003276_22107cztM0_level2_quad_clean.evt |
| Size (bytes) | 639,285,120 | 108,901,440 |
| Size | 609.7 MB | 103.9 MB |
| Events in quadrant A | 3,797,542 | 725,779 |
| Events in quadrant B | 3,737,110 | 731,143 |
| Events in quadrant C | 3,721,718 | 699,501 |
| Events in quadrant D | 7,588,774 | 611,792 |
| Mode M9 | |||
|---|---|---|---|
| Quadrant | BADHDUFLAG | Total packets | Discarded packets |
| A | 0 | 4 | 0 |
| B | 0 | 4 | 0 |
| C | 0 | 4 | 0 |
| D | 0 | 4 | 0 |
| Mode M0 | |||
|---|---|---|---|
| Quadrant | BADHDUFLAG | Total packets | Discarded packets |
| A | 0 | 16244 | 2 |
| B | 0 | 16014 | 3 |
| C | 0 | 15895 | 2 |
| D | 0 | 27731 | 2 |
| Mode SS | |||
|---|---|---|---|
| Quadrant | BADHDUFLAG | Total packets | Discarded packets |
| A | 0 | 154 | 0 |
| B | 0 | 154 | 0 |
| C | 0 | 154 | 0 |
| D | 0 | 154 | 0 |
| Quadrant | Total seconds | Saturated seconds | Saturation percentage |
|---|---|---|---|
| A | 7613 | 133 | 1.747012% |
| B | 7613 | 154 | 2.022856% |
| C | 7613 | 169 | 2.219887% |
| D | 7613 | 1274 | 16.734533% |
Noise dominated data is calculated using 1-second bins in cleaned event files. If a bin has >2000 counts, and if more than 50% of those come from <1% of pixels, then it is considered to be noise-dominated and hence unusable.
| Quadrant | # 1 sec bins | Bins with >0 counts | Bins with >2000 counts | High rate bins dominated by noise | Noise dominated (total time) | Noise dominated (detector-on time) | Marked lightcurve |
|---|---|---|---|---|---|---|---|
| A | 7888 | 7616 | 10 | 10 | 0.13% | 0.13% | 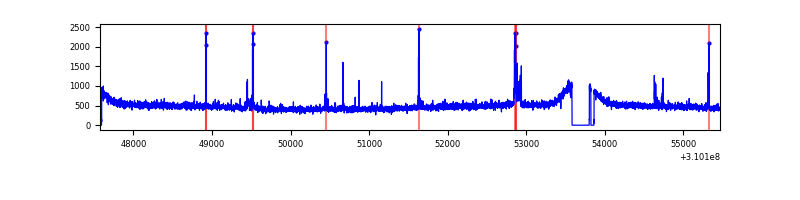 |
| B | 7888 | 7616 | 2 | 2 | 0.03% | 0.03% | 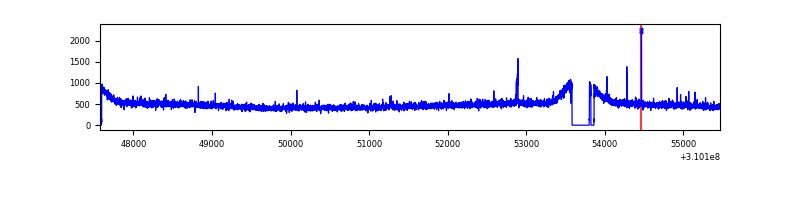 |
| C | 7888 | 7616 | 0 | 0 | 0.00% | 0.00% | 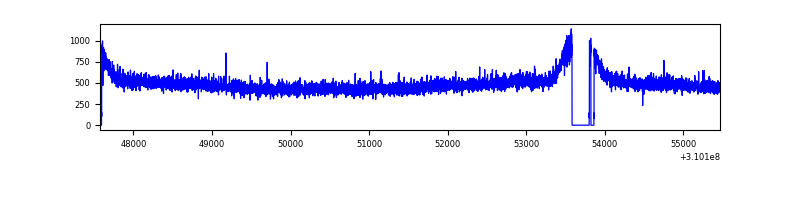 |
| D | 7888 | 7616 | 1017 | 1017 | 12.89% | 13.35% | 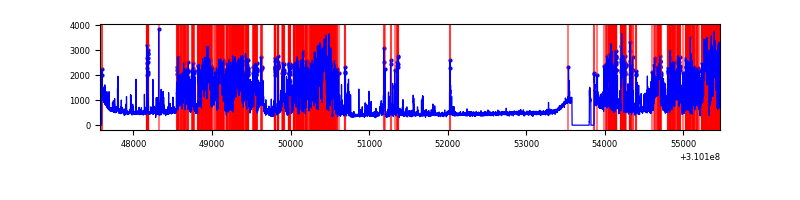 |
Top three noisy pixels from each quadrant. If the there are fewer than three noisy pixels in the level2.evt file, extra rows are filled as -1
| Pixel properties | Quadrant properties | ||||||
|---|---|---|---|---|---|---|---|
| Quadrant | DetID | PixID | Counts | Sigma | Mean | Median | Sigma |
| A | 5 | 16 | 90700 | 469.91 | 951 | 930 | 191.0 |
| A | 4 | 2 | 38740 | 197.92 | 951 | 930 | 191.0 |
| A | 13 | 254 | 12154 | 58.75 | 951 | 930 | 191.0 |
| B | 12 | 111 | 22167 | 117.5 | 943 | 917 | 180.9 |
| B | 11 | 111 | 19626 | 103.45 | 943 | 917 | 180.9 |
| B | 14 | 111 | 16461 | 85.95 | 943 | 917 | 180.9 |
| C | 14 | 238 | 141596 | 651.79 | 912 | 915 | 215.8 |
| C | 8 | 128 | 12657 | 54.4 | 912 | 915 | 215.8 |
| C | 8 | 112 | 6336 | 25.12 | 912 | 915 | 215.8 |
| D | 2 | 133 | 2536586 | 11845.29 | 876 | 850 | 214.1 |
| D | 11 | 176 | 1331044 | 6213.79 | 876 | 850 | 214.1 |
| D | 1 | 52 | 246105 | 1145.67 | 876 | 850 | 214.1 |
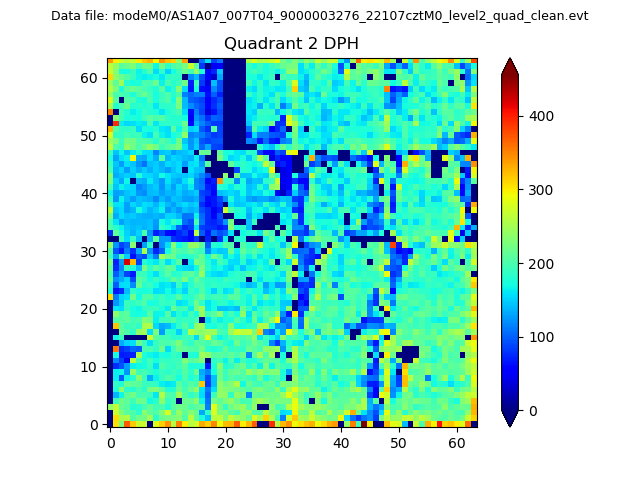
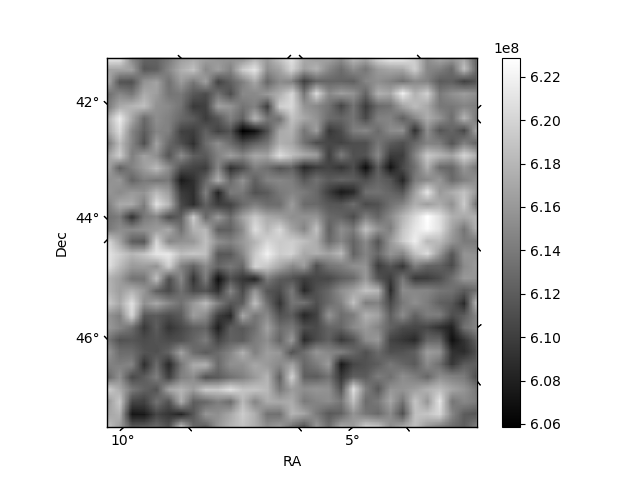
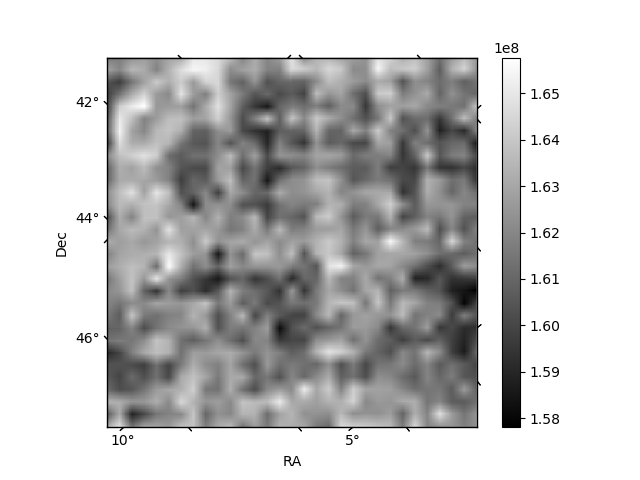
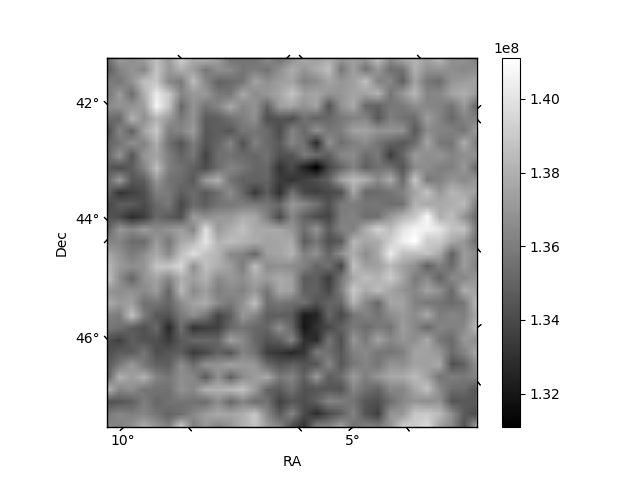
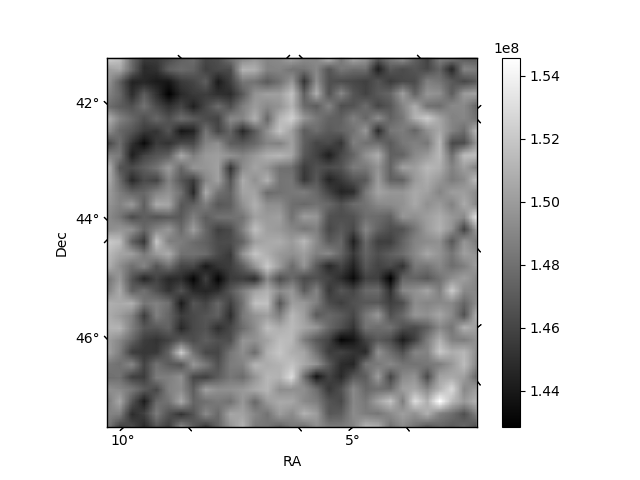
Histogram calculated using DETX and DETY for each event in the final _common_clean file
| Quadrant A | 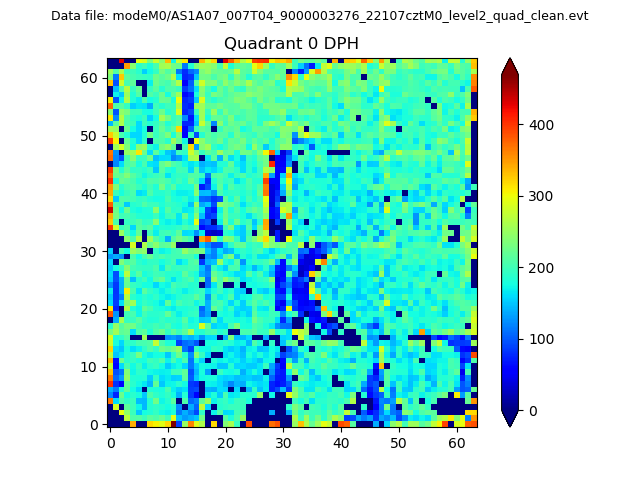 |
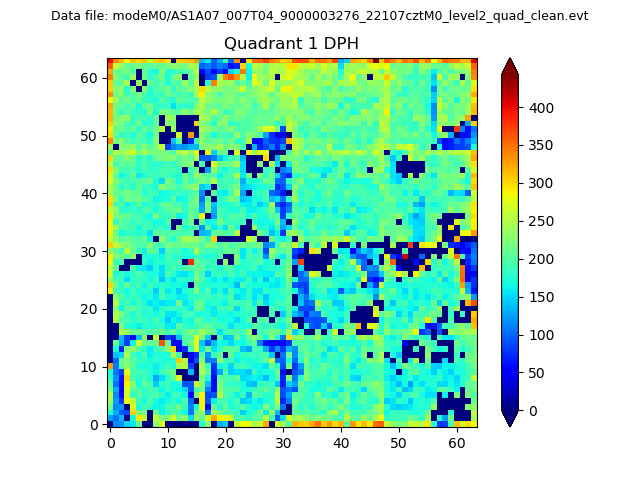 |
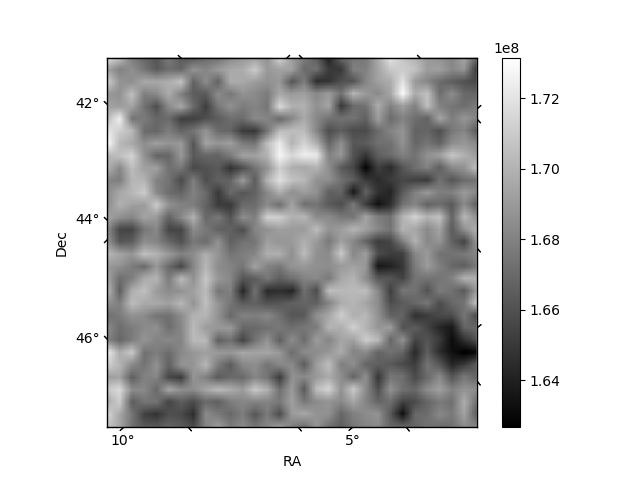
Quadrant B |
|---|---|---|---|
| Quadrant D | 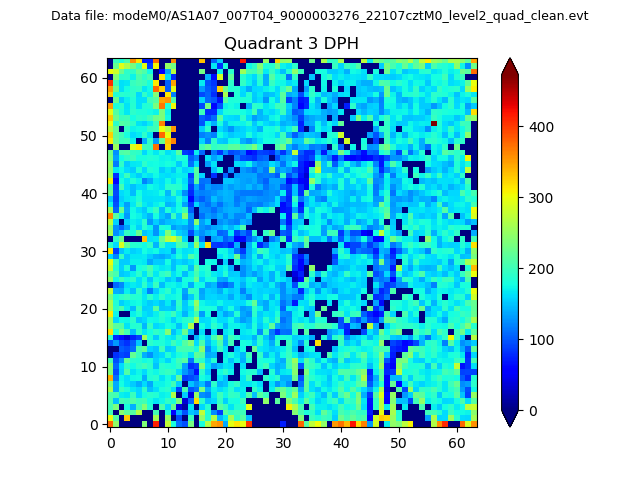 |
 |
Quadrant C |
| Plot type | Count rate plots | Images |
|---|---|---|
| Comparison with Poisson distribution Blue bars denote a histogram of data divided into 1 sec bins. Red curve is a Poisson curve with rate = median count rate of data. |
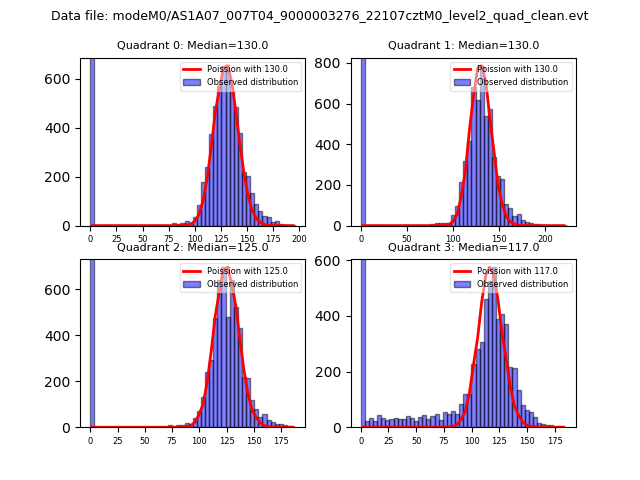 |
 |
| Quadrant-wise count rates Data is divided into 100 sec bins |
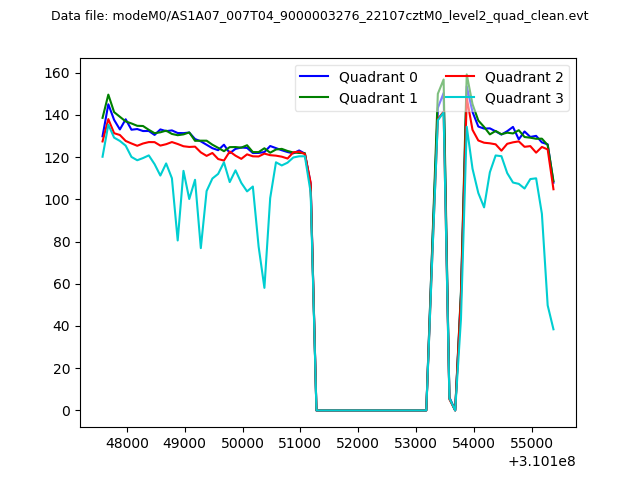 |
|
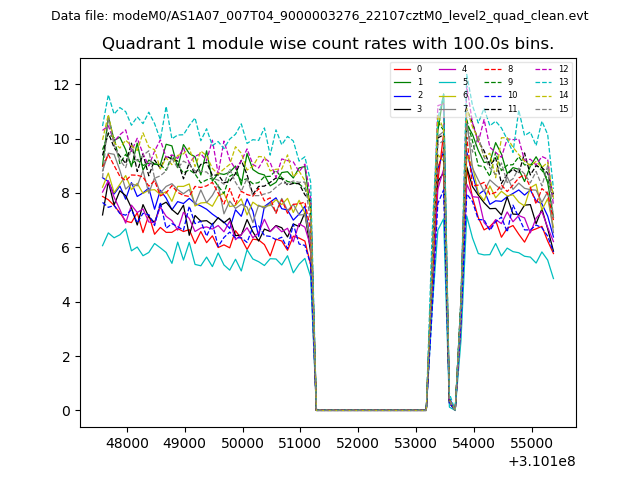
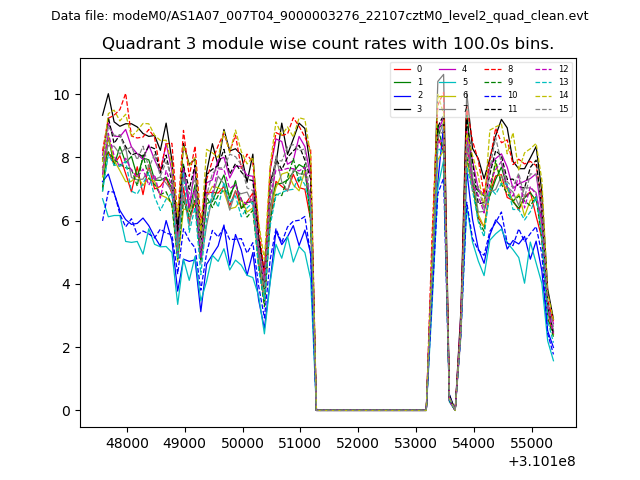
| Module-wise count rates for Quadrant A Data is divided into 100 sec bins |
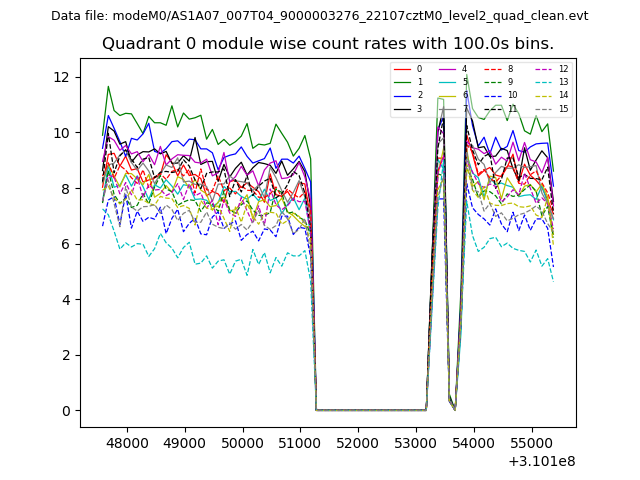 |
 |
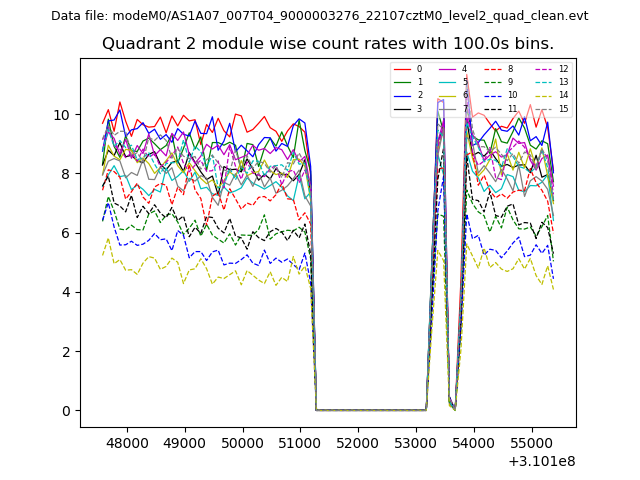
| Module-wise count rates for Quadrant B Data is divided into 100 sec bins |
 |
 |
| Module-wise count rates for Quadrant C Data is divided into 100 sec bins |
 |
 |
| Module-wise count rates for Quadrant D Data is divided into 100 sec bins |
 |
 |
| Parameter | Plot |
|---|---|
| CZT HV Monitor | 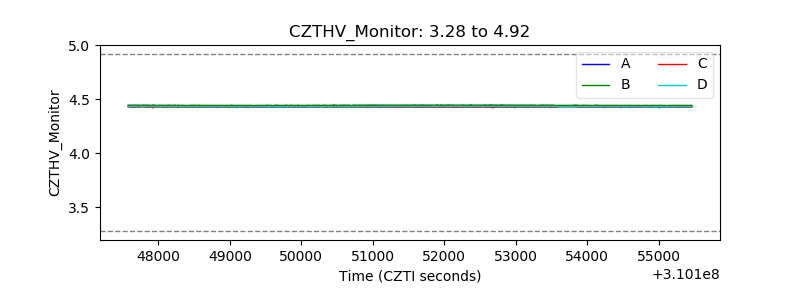 |
| D_VDD | 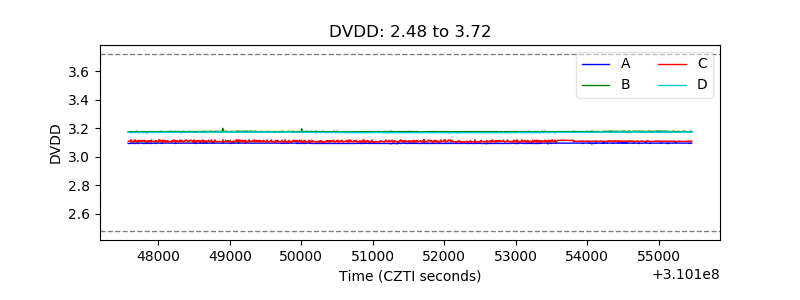 |
| Temperature 1 | 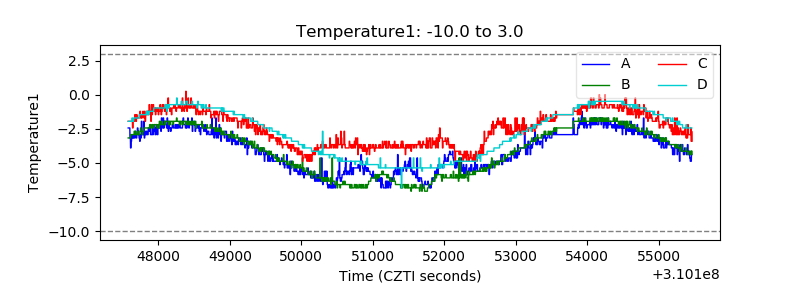 |
| Veto HV Monitor | 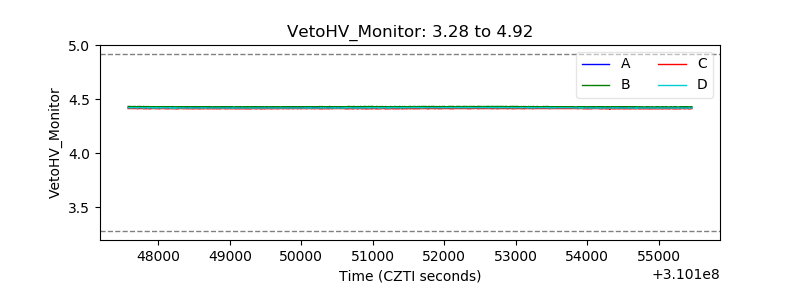 |
| Veto LLD | 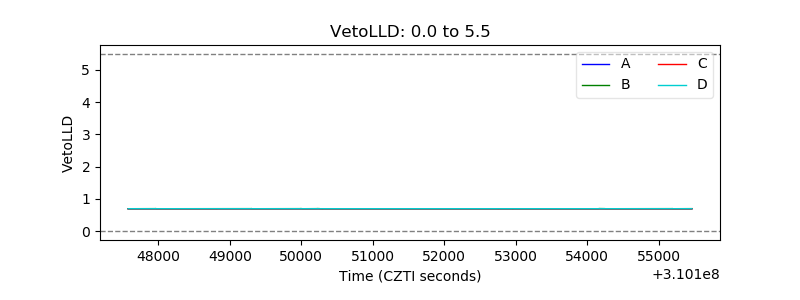 |
| Alpha Counter | 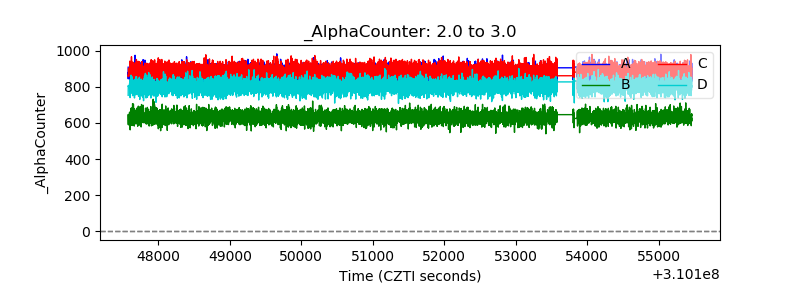 |
| _CPM_Rate | 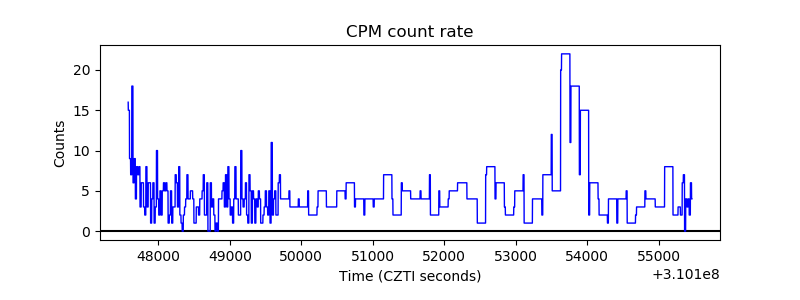 |
| CZT Counter | 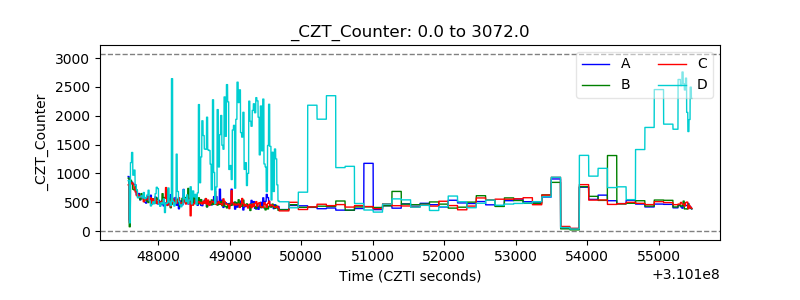 |
| +2.5 Volts monitor |  |
| +5 Volts monitor |  |
| _ROLL_ROT | 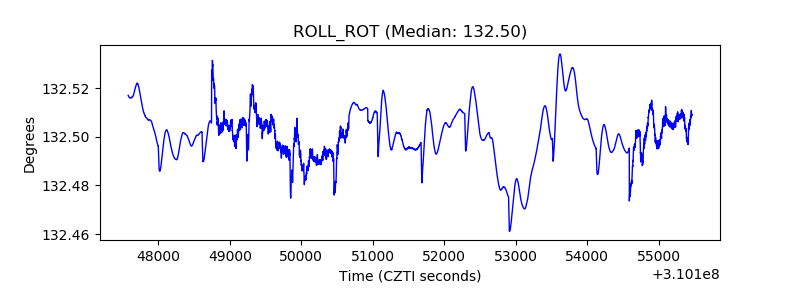 |
| _Roll_DEC | 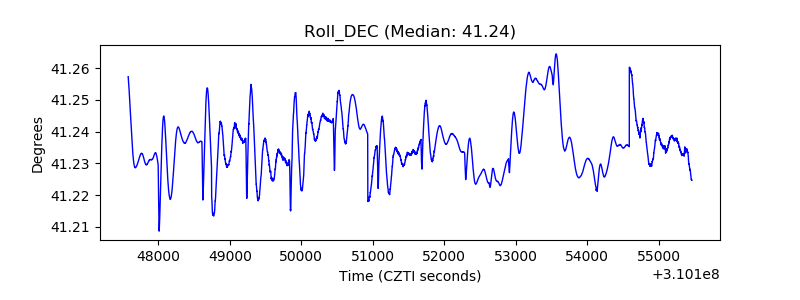 |
| _Roll_RA | 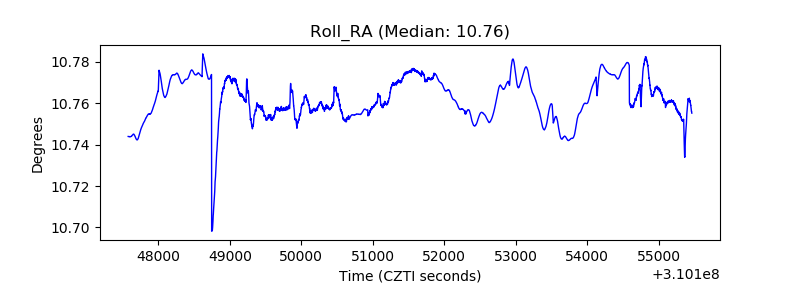 |
| Veto Counter | 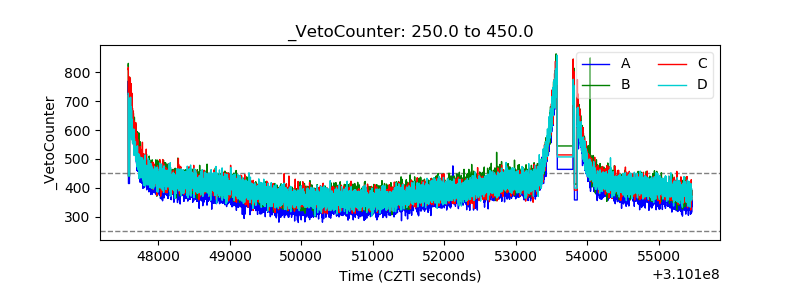 |